Bar Statistics - DELTA/OI/TOTAL/BUY/SELL/LONGS/SHORTSBar Statistics - Advanced Volume & Open Interest Analysis
Overview
The Bar Statistics indicator is a comprehensive analytical tool designed to provide traders with detailed insights into market microstructure through advanced volume analysis, open interest tracking, and market flow detection. This indicator transforms complex market data into easily digestible visual information, displaying six key metrics in customizable colored boxes that update in real-time.
Unlike traditional volume indicators that only show basic volume data, this indicator combines multiple data sources to reveal the underlying forces driving price movement, including volume delta calculations from lower timeframes, open interest changes, and estimated market positioning.
What Makes This Indicator Unique
1. Multi-Timeframe Volume Delta Precision
The indicator utilizes lower timeframe data (default 1-second) to calculate highly accurate volume delta measurements, providing much more precise buy/sell pressure analysis than standard timeframe-based calculations. This approach captures intraday volume dynamics that are often missed by conventional indicators.
2. Real-Time Updates
Unlike many indicators that only update on bar completion, this tool provides live updates for the developing candle, allowing traders to see evolving market conditions as they happen.
3. Market Flow Analysis
The unique "L/S" (Long/Short) metric combines open interest changes with price/volume direction to estimate net market positioning, helping identify when participants are accumulating or distributing positions.
4. Adaptive Visual Intensity
The gradient color system automatically adjusts based on historical context, making it easy to identify when current values are significant relative to recent market activity.
5. Complete Customization
Every aspect of the display can be customized, from the order of metrics to individual color schemes, allowing traders to adapt the tool to their specific analysis needs.
6.All In One Solution
6 Metrics in one indicator no more using 5 different indicators.
Core Features Explained
DELTA (Volume Delta)
What it shows: Net difference between aggressive buy volume and aggressive sell volume
Calculation: Uses lower timeframe data to determine whether each trade was initiated by buyers or sellers
Interpretation:
Positive values indicate aggressive buying pressure
Negative values indicate aggressive selling pressure
Magnitude indicates the strength of directional pressure
OI Δ (Open Interest Change)
What it shows: Change in open interest from the previous bar
Data source: Fetches open interest data using the "_OI" symbol suffix
Interpretation:
Positive values indicate new positions entering the market
Negative values indicate positions being closed
Combined with price direction, reveals market participant behavior
L/S (Net Long/Short Bias)
What it shows: Estimated net change in long vs short market positions
Calculation method: Combines open interest changes with price/volume direction using configurable logic
Scenarios analyzed:
New Longs: Rising OI + Rising Price/Volume = Long position accumulation
Liquidated Longs: Falling OI + Falling Price/Volume = Long position exits
New Shorts: Rising OI + Falling Price/Volume = Short position accumulation
Covered Shorts: Falling OI + Rising Price/Volume = Short position exits
Result: Net bias toward long (positive) or short (negative) market sentiment
TOTAL (Total Volume)
What it shows: Standard volume for the current bar
Purpose: Provides context for other metrics and baseline activity measurement
Enhanced display: Uses gradient intensity based on recent volume history
BUY (Estimated Buy Volume)
What it shows: Estimated aggressive buy volume
Calculation: (Total Volume + Delta) / 2
Use case: Helps quantify the actual buying pressure in monetary/contract terms
SELL (Estimated Sell Volume)
What it shows: Estimated aggressive sell volume
Calculation: (Total Volume - Delta) / 2
Use case: Helps quantify the actual selling pressure in monetary/contract terms
Configuration Options
Timeframe Settings
Custom Timeframe Toggle: Enable/disable custom lower timeframe selection
Timeframe Selection: Choose the precision level for volume delta calculations
Auto-Selection Logic: Automatically selects optimal timeframe based on chart timeframe
Net Positions Calculation
Direction Method: Choose between Price-based or Volume Delta-based direction determination
Value Method: Select between Open Interest Change or Volume for position size calculations
Display Customization
Row Order: Completely customize which metrics appear and in what order (6 positions available)
Color Schemes: Individual color selection for positive/negative values of each metric
Gradient Intensity: Configurable lookback period (10-200 bars) for relative intensity calculations
Visual Elements
Box Format: Clean, professional box display with clear labels
Color Coding: Intuitive color schemes with customizable transparency gradients
Real-time Updates: Live updating for developing candles with historical stability
How to Use This Indicator
For Day Traders
Volume Confirmation: Use DELTA to confirm breakout validity - strong directional moves should show corresponding volume delta
Entry Timing: Watch for volume delta divergences at key levels to time entries
Exit Signals: Monitor when aggressive volume shifts against your position
For Swing Traders
Market Flow: Focus on the L/S metric to identify when participants are accumulating or distributing
Open Interest Analysis: Use OI Δ to confirm whether moves are backed by new money or position adjustments
Trend Validation: Combine multiple metrics to validate trend strength and sustainability
For Scalpers
Real-time Edge: Utilize the live updates to see developing imbalances before bar completion
Quick Decision Making: Focus on DELTA and BUY/SELL for immediate market pressure assessment
Volume Profile: Use TOTAL volume context for optimal entry/exit sizing
Setup Recommendations
Futures Markets: Enable OI tracking and use Volume Delta direction method
Crypto Markets: Focus on DELTA and volume metrics; OI may not be available
Stock Markets: Use Price direction method with volume value calculations
High-Frequency Analysis: Set lower timeframe to 1S for maximum precision
Technical Implementation
Data Accuracy
Utilizes TradingView's ta.requestVolumeDelta() function for precise buy/sell classification
Implements error checking for data availability
Handles missing data gracefully with fallback calculations
Performance Optimization
Efficient array management with configurable lookback periods
Smart box creation and deletion to prevent memory issues
Optimized real-time updates without historical data corruption
Compatibility
Works on all timeframes from seconds to daily
Compatible with futures, forex, crypto, and stock markets
Automatically adjusts calculation methods based on available data
Risk Disclaimers
This indicator is designed for educational and analytical purposes. It provides statistical analysis of market data but does not guarantee trading success. Users should:
Combine with other forms of analysis
Practice proper risk management
Understand that past performance doesn't predict future results
Be aware that volume delta and open interest data quality varies by market and data provider
Conclusion
The Bar Statistics indicator represents a significant advancement in retail trader access to professional-grade market analysis tools. By combining multiple data sources into a single, customizable display, it provides the depth of analysis needed for comprehensive market microstructure understanding while maintaining the simplicity required for effective decision-making.
Tìm kiếm tập lệnh với "order"

Net Positions (Net Longs & Net Shorts) - Volume AdjustedNet Positions (Net Longs & Net Shorts) - Volume Adjusted
Based on the legendary LeviathanCapital - Net Positions Indicator
Adjusted to use volume calculation for more percise data
Few important caveats:
- EVERY BUYER NEED A SELLER AND EVERY SELLER NEED A BUYER
- This indicator is meant to give you a sense of direction for the market orders ("who is the aggresive side") and should be used as confluence not as true values
In reality, in market movement each candle will contain both buying and selling, contracts closing and opening but due to some limitations that is hard to make properly.
Even with these limitations this indicator can provide a better picture than some other even external tools out there.
The main benefit of using volume delta and open interest instead of just open interest and candle closes G/R that it solves the problem with extreme cases where there might be an absorption of market orders.
Example of the Volume Edge in Action:
Bullish Absorption (The "Trap" for Sellers)
Candle Close + OI: A large Red Candle forms with Rising OI. The interpretation is simply: "New shorts are opening"
Volume Delta + OI: The same Red Candle with Rising OI has a Positive Volume Delta.
The True Story: Aggressive buyers tried to push the price up, but they were completely absorbed by large passive sell orders.
The "Volume Delta" logic:
If OI ↑ → new positions opened
• Delta ↑ → net longs added
• Delta ↓ → net shorts added
If OI ↓ → positions closed
• Delta ↑ → shorts closing
• Delta ↓ → longs closing
The "Price" logic:
If OI ↑ → new positions opened
• Price ↑ → net longs added
• Price ↓ → net shorts added
If OI ↓ → positions closed
• Price ↑ → shorts closing
• Price ↓ → longs closing

Breaker Blocks Screener | Flux Charts💎 GENERAL OVERVIEW
Introducing our new Breaker Blocks Screener! This screener can provide information about the latest breaker blocks in up to 5 tickers. You can also customize the algorithm that finds the breaker blocks and the styling of the screener.
Features of the new Breaker Blocks Screener :
Find Latest Breaker Blocks Accross 5 Tickers
Latest Status, Restests & Volume
Customizable Algoritm / Styling
📌 HOW DOES IT WORK ?
Breaker blocks form when an order block fails, or "breaks". It is often associated with market going in the opposite direction of the broken order block, and they can be spotted by following order blocks and finding the point they get broken, ie. price goes below a bullish order block.
The volume of a breaker block is simply the total volume of the bar that the original order block is broken. Often the higher the breaking bar's volume, the stronger the breaker block is.
This screener then finds breaker blocks accross 5 different tickers, and shows the latest information about them.
Status ->
Far -> The current price is far away from the breaker block.
Approaching ⬆️/⬇️ -> The current price is approaching the breaker block, and the direction it's approaching from.
Inside -> The price is currently inside the breaker block.
Retests -> Retest means the price to invalidate the breaker block, but failed to do so. Here you can see how many times the price retested the breaker block.
For the volume, check the top of the "How Does It Work" section.
🚩UNIQUENESS
This screener can detect latest breaker blocks and give information about them for up to 5 tickers. This saves the user time by showing them all in a dashboard at the same time. The screener shows the number of the retests of the breaker block as an unique trait. Another unique ability of the screener is that it shows the latest valid breaker block's volume in the dashboard.
⚙️SETTINGS
1. Tickers
You can set up to 5 tickers for the screener to scan breaker blocks here. You can also enable / disable them and set their individual timeframes.
2. General Configuration
Zone Invalidations -> Select between Wick & Close price for Order & Breaker Block Invalidation.
Swing Length -> Swing length is used when finding order block formations. Smaller values will result in finding smaller order blocks.

Smart Money Setup 07 [TradingFinder] Liquidity Hunts & Minor OB🔵 Introduction
The Smart Money Concept relies on analyzing market structure, tracking liquidity flows, and identifying order blocks. Research indicates that traders who apply these methods can improve their accuracy in predicting market movements by up to 30%.
These elements allow traders to understand the behavior of market makers, including banks and large financial institutions, which have the ability to influence price movements and shape major market trends. By recognizing how these entities operate, traders can align their strategies with Smart Money actions and better anticipate shifts in the market.
Smart Money typically enters the market at points of high liquidity where trading opportunities are more attractive. By following these liquidity flows, professional traders can position themselves at market reversal points, leading to profitable trades.
The Smart Money Setup 07 indicator has been specifically designed to detect these complex patterns. Using advanced algorithms, this indicator automatically identifies both bullish and bearish trading setups, assisting traders in discovering hidden market opportunities.
As a powerful technical analysis tool, the Smart Money Setup indicator helps predict the actions of major market participants and highlights optimal entry and exit points. Essentially, this tool enables traders to act like institutional investors and market makers, making the most of price fluctuations in their favor.
Ultimately, the Smart Money Setup 07 indicator transforms complex technical analysis into a simple and practical tool. By detecting order blocks and liquidity zones, this tool helps traders execute their strategies with greater precision, leading to more informed and successful trading decisions.
🟣 Bullish Setup
🟣 Bearish Setup
🔵 How to Use
One of the key strengths of the Smart Money Setup 07 indicator is its ability to accurately identify order blocks and analyze liquidity flows. Order blocks represent areas where large buy or sell orders are placed by Smart Money investors, which often indicate key reversal points in the market. Traders can use these order blocks to pinpoint potential entry and exit opportunities.
The Smart Money Setup indicator detects and visually displays these order blocks on the chart, helping traders identify the best zones to enter or exit trades. Since these zones are frequently used by large institutional investors, following these blocks allows traders to capitalize on price fluctuations and trade with confidence.
🟣 Bullish Smart Money Setup
A Bullish Smart Money Setup forms when the market creates Higher Lows and Higher Highs. In this situation, the indicator analyzes pivot points, liquidity flows, and order blocks to identify buy opportunities. Liquidity points in these setups indicate areas where Smart Money is likely to enter long positions.
In the bullish setup image, multiple Higher Lows and Higher Highs are formed. The green zone represents a Bullish Order Block, signaling traders to enter a long trade. The Smart Money Setup indicator displays a green arrow, indicating a high-probability upward price movement from this liquidity zone.
🟣 Bearish Smart Money Setup
A Bearish Smart Money Setup occurs when the market structure shows Lower Highs and Lower Lows, indicating weakness in price. The indicator identifies these patterns and highlights potential sell opportunities. Liquidity points in this setup mark areas where Smart Money enters sell positions.
In the bearish setup image, a Lower High is followed by a Lower Low, with the red liquidity zone acting as a Bearish Order Block. The Smart Money Setup indicator shows a red arrow, signaling a likely downward move, offering traders an opportunity to enter short positions.
🔵 Settings
Pivot Period : This setting determines how many candles are needed to form a pivot point. A default value of 2 is optimal for quickly identifying key pivot points in price action.
Order Block Validity Period : This parameter defines the lifespan of an order block. Traders can adjust how long each order block remains valid. For instance, setting it to 500 means that an order block will be valid for 500 bars after its formation.
Mitigation Level OB : This setting allows traders to select whether order blocks should be based on the "Proximal," "50% OB," or "Distal" levels, helping traders manage risk more effectively.
Order Block Refinement : Traders can refine the order blocks with precision. The indicator offers two refinement modes: Defensive and Aggressive. The Defensive mode identifies safer order blocks, while the Aggressive mode targets higher-risk blocks with the potential for larger reversals.
🔵 Conclusion
The Smart Money Setup 07 indicator is a powerful tool for identifying key Smart Money movements in the market. It provides traders with essential insights for making informed trading decisions, particularly when combined with technical analysis and liquidity flow analysis. This indicator allows traders to accurately pinpoint entry and exit points, helping them maximize profits and minimize risk.
By offering a range of customizable settings, the Smart Money Setup indicator adapts to different trading styles and strategies. Furthermore, its ability to detect order blocks and identify supply and demand zones makes it an indispensable tool for any trader looking to enhance their strategy.
In conclusion, the Smart Money Setup 07 is a crucial tool for traders aiming to optimize their trading performance. By utilizing the concepts of Smart Money in technical analysis, traders can make more precise decisions and take advantage of market fluctuations.

Cumulative Volume Delta Strategy | Flux Charts💎 GENERAL OVERVIEW
Introducing the Cumulative Volume Delta Strategy (CVDS) Indicator, an advanced tool designed to enhance trading strategies by identifying potential trend reversals through volume dynamics. This script features integrated order block detection, Fair Value Gaps (FVGs), and a dynamic take-profit (TP) and stop-loss (SL) system. For an in-depth understanding of the strategy, refer to the "HOW DOES IT WORK?" section below.
Features of the new Cumulative Volume Delta Strategy (CVDS) Indicator :
Cumulative Volume Delta-based Strategy
Order Block and Fair Value Gap (FVG) Entry Methods
Dynamic TP/SL System
Customizable Risk Management Settings
Alerts for Buy, Sell, TP, and SL Signals
📌 HOW DOES IT WORK ?
The CVDS indicator operates by tracking the net volume difference between buyers and sellers to identify divergences that could indicate potential trend reversals. A cumulative volume delta (CVD) calculation is employed to measure the intensity of these divergences in relation to price movements. The net volume sum is reset every trading day (can be changed from the settings using the anchor period option), and divergences are detected when the cumulative volume crosses the 0-line over or under.
Once a significant divergence is detected, the indicator identifies breakout points, confirmed by either Fair Value Gaps (FVGs) or Order Blocks (OBs). Depending on your chosen entry mode, the indicator will trigger a buy or sell entry when the confirmation signal aligns with the breakout direction. Alerts for Buy, Sell, Take-Profit, and Stop-Loss are available.
Note that the indicator cannot run on 1-minute and 1-second charts, as it needs to get data from a lower timeframe. 1-minutes & 1-second timeframes are the minimum timeframes in their ranges respectively.
🚩 UNIQUENESS
What sets this indicator apart is the combination of volume divergence analysis with advanced price action tools like Fair Value Gaps (FVGs) and Order Blocks (OBs). The ability to choose between these methods, along with a dynamic TP/SL system that adapts based on volatility, provides flexibility for traders in any market condition. The backtesting dashboard provides metrics about the performance of the indicator. You can use it to tune the settings for best use in the current ticker. The CVD-based strategy ensures that trades are initiated only when meaningful divergences between volume and price occur, filtering out noise and increasing the likelihood of profitable trades.
⚙️ SETTINGS
1. General Configuration
Anchor Period: Time anchor period used in CVD calculation. This is essentially the period that the volume delta sum will be reset. Lower timeframes may result in more entries at the cost of less reliable results.
Entry Mode: Choose between FVGs or OBs to trigger your entries based on the confirmation signals.
Retracement Requirement: Enable to confirm the entry after a retracement toward the FVG or OB.
2. Fair Value Gaps
FVG Sensitivity: Modify the sensitivity of FVG detection, allowing for more or fewer gaps to be considered valid.
3. Order Blocks (OB)
Swing Length: Define the swing length to identify OB formations. Shorter lengths find smaller OBs, while longer lengths detect larger structures.
4. TP / SL
TP / SL Method:
a) Dynamic: The TP / SL zones will be auto-determined by the algorithm based on the Average True Range (ATR) of the current ticker.
b) Fixed : You can adjust the exact TP / SL ratios from the settings below.
Dynamic Risk: The risk you're willing to take if "Dynamic" TP / SL Method is selected. Higher risk usually means a better winrate at the cost of losing more if the strategy fails. This setting is has a crucial effect on the performance of the indicator, as different tickers may have different volatility so the indicator may have increased performance when this setting is correctly adjusted.

Propulsion Blocks | Flux Charts💎 GENERAL OVERVIEW
Introducing our new Propulsion Blocks indicator! This new indicator can find & render ICT's propulsion blocks in the current ticker. It's highly customizable with detection, invalidation and style settings. For more information, please visit the "HOW DOES IT WORK ?" section.
Features of the new Propulsion Blocks indicator :
Render Bullish & Bearish Propulsion Blocks
Customizable Algorithm
Enable / Disable Historic Zones
Visual Customizability
📌 HOW DOES IT WORK ?
Order blocks occur when there is a high amount of market orders exist on a price range. It is possible to find order blocks using specific formations on the chart. One of which this indicator uses requires a large engulfing candlestick right after another one of the opposite direction. Then if the price comes back to retest the area that two candlesticks create, then it's an order block pattern.
Propulsion blocks are a specific type of order block used in the trading methodology. They build on the concept of order blocks and aim to identify potential areas for strong price movements. They are detected when a candlestick wicks to any existing order block, retesting it. Then a strong momentum in the direction of the order block is needed for the propulsion block to get created. Check this example :
You can use them as entry / exit points, or for confirmations for your trades. For example, a successful retest attempt to a bullish propulsion block might hint a strong bullish momentum. This indicator works best when used together with other ICT concepts.
🚩UNIQUENESS
Propulsion blocks can help traders identify key levels in a chart, and can be used mainly for confirmation. This indicator can identify and show them automatically in your chart, and provides customization settings for order & propulsion block detection and invalidation. Another capability of the indicator is that it combines overlapping order & propulsion blocks so you will have a clean look at the chart without any overlapping zones.
⚙️SETTINGS
1. General Configuration
Show Historic Zones -> This setting will hide invalidated propulsion blocks if enabled.
Max Distance To Last Bar -> This setting defines the maximum range that the indicator will find propulsion blocks to the past. Higher options will make older zones visible.
Zone Invalidation -> Select between Wick & Close price for Order Block & Propulsion Block Invalidation.
Swing Length -> Swing length is used when finding order block formations. Smaller values will result in finding smaller order blocks.

ICT Propulsion Block [LuxAlgo]The ICT Propulsion Block indicator is meant to detect and highlight propulsion blocks, which are specific price structures introduced by the Inner Circle Trader (ICT).
Propulsion Blocks are essentially blocks located where prices interact with preceding order blocks. Traders often utilize them when analyzing price movements to identify potential turning points and market behavior or areas of interest in the market.
🔶 USAGE
An order block is a significant area on a price chart where there was a notable accumulation or distribution of orders, often identified by a strong move in price followed by a consolidation or sideways movement. Traders use order blocks to identify potential support or resistance levels.
A Propulsion Block, on the other hand, is a concept taught by the Inner Circle Trader (ICT) and refers to a specific type of order block that interacts with the preceding order block. Traders often analyze propulsion blocks to identify potential turning points and areas of interest in the market.
A mitigated order block refers to an order block that has been invalidated or nullified due to subsequent market movements or developments. It no longer holds the same significance or relevance in the current market context.
Let's explore a bearish order block and propulsion block scenario commonly utilized by ICT traders in their trading strategies.
🔶 SETTINGS
🔹 Order & Propulsion Blocks
Swing Detection Length: Lookback period used to detect swing points for creating order blocks and/or propulsion blocks.
Mitigation Price: Allows users to choose between the closing price or the candle's wick for mitigation.
Highlight Propulsion Block Signals: Highlights the propulsion block and its sentiment for easier identification and analysis.
Remove Unassociated Order Blocks: Eliminate order blocks that are not associated with any propulsion block.
Remove Mitigated Blocks: Eliminates mitigated order blocks and propulsion blocks along with their associated order blocks, streamlining the visualization for clearer analysis.
Most Recent Blocks: Activates processing of the specified number of most recent blocks according to the option. If not enabled, the script defaults to processing the last 125 occurrences.
🔹 Order & Propulsion Blocks Style
Bullish Order & Propulsion Blocks: Toggles the visibility of bullish order and propulsion blocks, along with color customization options.
Bearish Order & Propulsion Blocks: Toggles the visibility of bearish order and propulsion blocks, along with color customization options.
Block Labels: Toggles the visibility of order and propulsion block labels, and label size customization option.
🔶 RELATED SCRIPTS
Order-Blocks-Breaker-Blocks .

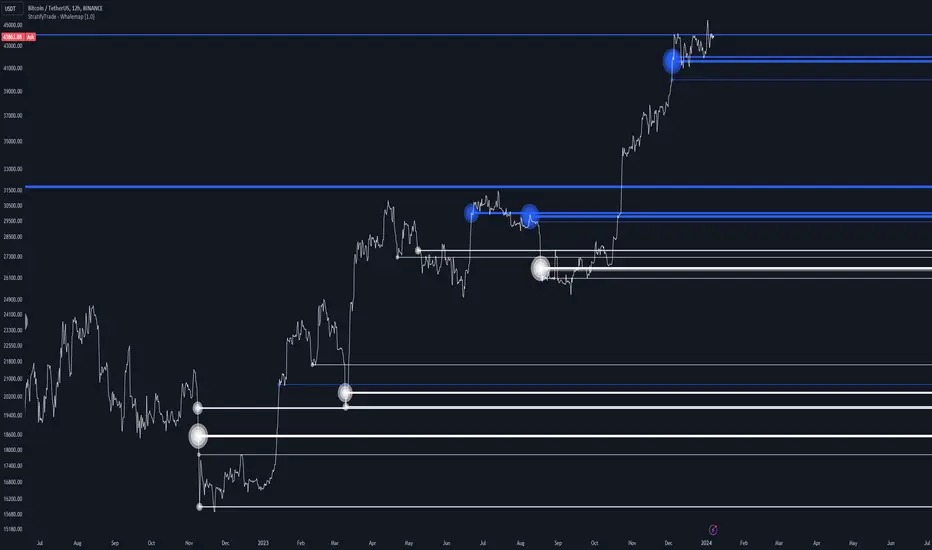
Whalemap [BigBeluga]The Whalemap indicator aims to spot big buying and selling activity represented as big orders for a possible bottom or top formation on the chart.
🔶 CALCULATION
The indicator uses volume to spot big volume activity represented as big orders in the market.
for i = 0 to len - 1
blV.vol += (close > close ? volume : 0)
brV.vol += (close < close ? volume : 0)
When volume exceeds its own threshold, it is a sign that volume is exceeding its normal value and is considered as a "Whale order" or "Whale activity," which is then plotted on the chart as circles.
🔶 DETAILS
The indicator plots Bubbles on the chart with different sizes indicating the buying or selling activity. The bigger the circle, the more impact it will have on the market.
On each circle is also plotted a line, and its own weight is also determined by the strength of its own circle; the bigger the circle, the bigger the line.
Old buying/selling activity can also be used for future support and resistance to spot interesting areas.
The more price enters old buying/selling activity and starts producing orders of the same direction, it might be an interesting point to take a closer look.
🔶 EXAMPLES
The chart above is showing us price reacting to big orders, finding good bottoms in price and good tops in confluence with old activity.
🔶 SETTINGS
Users will have the options to:
Filter options to adjust buying and selling sensitivity.
Display/Hide Lines
Display/Hide Bubbles
Choose which orders to display (from smallest to biggest)
Breaker Blocks | Flux Charts💎 GENERAL OVERVIEW
Introducing our new Volumized Breaker Blocks indicator! This new indicator can render breaker blocks with their volumetric information. It's highly customizable with detection, invalidation and style settings.
Features of the new Volumized Breaker Block indicator :
Render Bullish & Bearish Breaker Blocks
Enable / Disable Volumetric Information
Enable / Disable Historic Zones
Visual Customizability
📌 HOW DOES IT WORK ?
Breaker blocks form when an order block fails, or "breaks". It is often associated with market going in the opposite direction of the broken order block, and they can be spotted by following order blocks and finding the point they get broken, ie. price goes below a bullish order block.
The volume of a breaker block is simply the total volume of the bar that the original order block is broken.
🚩UNIQUENESS
This indicator can not only detect breaker blocks, but it can also detect them with their volumetric information. Volumetric information can be crucial when considering an breaker block's strength, which can be a crucial form of confluence in certain trading strategies.
⚙️SETTINGS
1. General Configuration
Volumetric Info -> The volumetric information of the Breaker Blocks will be rendered if activated.
Zone Invalidation -> Select between Wick & Close price for Breaker Block Invalidation.
Swing Length -> Swing length is used when finding breaker block formations. Smaller values will result in finding smaller breaker blocks.

NormInvTargetSeekerNormInvTargetSeeker
The NormInvTargetSeeker is a trading tool designed to aid traders in identifying and capitalizing on Distribution and Accumulation zones, highlighting specific price levels that could serve as targets for future price movements. Although the indicator itself is not multi-timeframe, an effective trading strategy might involve signal validation across multiple timeframes.
🔶 USAGE
The indicator identifies Distribution and Accumulation zones, providing potential targets for future price moves.
Traders are encouraged to use these zones as profit targets or potential reversal points.
Confluence Zones
These zones are identified as regions where various factors or levels converge, signaling an increased probability of price reaction.
They can be used to reinforce signals or identify levels where price might encounter significant resistance or support.
🔹 Trading Strategy
First, identify a signal on your primary trading timeframe.
Manually check higher timeframes to ensure the signal aligns with them.
Use the identified zones, whether Distribution or Accumulation, as target zones for your trades.
🔶 Order Blocks
The NormInvTargetSeeker identifies "Order Blocks" by examining a specified number of consecutive candles with a specific condition: the current candle must completely engulf the previous candle. This means that both the high and low of the current candle are higher and lower, respectively, than the high and low of the previous candle, signifying a dominant move in the direction of the current candle.
🔹 Trading Strategy
Target Confirmation: Order Blocks can serve to confirm target points, providing additional validation for identified levels.
Market Insight: They offer crucial insights into whether "big hands" or institutional players are positioned as buyers or sellers in the market.
Traders can use Order Blocks as a means to validate targets or key price levels, observing if the price reacts significantly upon reaching these blocks.
They can also provide insights into the general market direction or underlying market strength by identifying where the major market players are placing their orders.
🔶 SETTINGS
The indicator allows users to adjust various parameters to customize the display and logic of the tool to fit their needs.
🔹 Display Settings
Users can customize the colors and displays of various zones and labels to match their preferences.
🔶 LICENSE AND CREDITS
This work is licensed under Attribution-NonCommercial-ShareAlike 4.0 International (CC BY-NC-SA 4.0). More information here: creativecommons.org
This indicator utilizes a TypeScript implementation of the Normal Inverse function as a reference, which can be found here : github.com
Special thanks to the authors of the referenced code for providing a foundation upon which this indicator was built.
🔶 UPDATES
Current Version: 1.0.0
For future updates, please check the comment section.
🔶 CONTACT
For any questions or suggestions, please feel free to contact @RickSimpson on TradingView.

Smart Money Concepts (SMC) [LuxAlgo]This all-in-one indicator displays real-time market structure (internal & swing BOS / CHoCH), order blocks, premium & discount zones, equal highs & lows, and much more...allowing traders to automatically mark up their charts with widely used price action methodologies. Following the release of our Fair Value Gap script, we received numerous requests from our community to release more features in the same category.
"Smart Money Concepts" (SMC) is a fairly new yet widely used term amongst price action traders looking to more accurately navigate liquidity & find more optimal points of interest in the market. Trying to determine where institutional market participants have orders placed (buy or sell side liquidity) can be a very reasonable approach to finding more practical entries & exits based on price action.
The indicator includes alerts for the presence of swing structures and many other relevant conditions.
Features
This indicator includes many features relevant to SMC, these are highlighted below:
Full internal & swing market structure labeling in real-time
Break of Structure (BOS)
Change of Character (CHoCH)
Order Blocks (bullish & bearish)
Equal Highs & Lows
Fair Value Gap Detection
Previous Highs & Lows
Premium & Discount Zones as a range
Options to style the indicator to more easily display these concepts
Settings
Mode: Allows the user to select Historical (default) or Present, which displays only recent data on the chart.
Style: Allows the user to select different styling for the entire indicator between Colored (default) and Monochrome.
Color Candles: Plots candles based on the internal & swing structures from within the indicator on the chart.
Internal Structure: Displays the internal structure labels & dashed lines to represent them. (BOS & CHoCH).
Confluence Filter: Filter non-significant internal structure breakouts.
Swing Structure: Displays the swing structure labels & solid lines on the chart (larger BOS & CHoCH labels).
Swing Points: Displays swing points labels on chart such as HH, HL, LH, LL.
Internal Order Blocks: Enables Internal Order Blocks & allows the user to select how many most recent Internal Order Blocks appear on the chart.
Swing Order Blocks: Enables Swing Order Blocks & allows the user to select how many most recent Swing Order Blocks appear on the chart.
Equal Highs & Lows: Displays EQH/EQL labels on chart for detecting equal highs & lows.
Bars Confirmation: Allows the user to select how many bars are needed to confirm an EQH/EQL symbol on chart.
Fair Value Gaps: Displays boxes to highlight imbalance areas on the chart.
Auto Threshold: Filter out non-significant fair value gaps.
Timeframe: Allows the user to select the timeframe for the Fair Value Gap detection.
Extend FVG: Allows the user to choose how many bars to extend the Fair Value Gap boxes on the chart.
Highs & Lows MTF: Allows the user to display previous highs & lows from daily, weekly, & monthly timeframes as significant levels.
Premium/Discount Zones: Allows the user to display Premium, Discount, and Equilibrium zones on the chart
Usage
Users can see automatic CHoCH and BOS labels to highlight breakouts of market structure, which allows to determine the market trend. In the chart below we can see the internal structure which displays more frequent labels within larger structures. We can also see equal highs & lows (EQH/EQL) labels plotted alongside the internal structure to frequently give indications of potential reversals.
In the chart below we can see the swing market structure labels. These are also labeled as BOS and CHoCH but with a solid line & larger text to show larger market structure breakouts & trend reversals. Users can be mindful of these larger structure labels while trading internal structures as displayed in the previous chart.
Order blocks highlight areas where institutional market participants open positions, one can use order blocks to determine confirmation entries or potential targets as we can expect there is a large amount of liquidity at these order blocks. In the chart below we can see 2 potential trade setups with confirmation entries. The path outlined in red would be a potential short entry targeting the blue order block below, and the path outlined in green would be a potential long entry, targeting the red order blocks above.
As we can see in the chart below, the bullish confirmation entry played out in this scenario with the green path outlined in hindsight. As price breaks though the order blocks above, the indicator will consider them mitigated causing them to disappear, and as per the logic of these order blocks they will always display 5 (by default) on the chart so we can now see more actionable levels.
The Smart Money Concepts indicator has many other features and here we can see how they can also help a user find potential levels for price action trading. In the screenshot below we can see a trade setup using the Previous Monthly High, Strong High, and a Swing Order Block as a stop loss. Accompanied by the Premium from the Discount/Premium zones feature being used as a potential entry. A potential take profit level for this trade setup that a user could easily identify would be the 50% mark labeled with the Fair Value Gap & the Equilibrium all displayed automatically by the indicator.
Conclusion
This indicator highlights all relevant components of Smart Money Concepts which can be a very useful interpretation of market structure, liquidity, & more simply put, price action. The term was coined & popularized primarily within the forex community & by ICT while making its way to become a part of many traders' analysis. These concepts, with or without this indicator do not guarantee a trader to be trading within the presence of institutional or "bank-level" liquidity, there is no supporting data regarding the validity of these teachings.

Big Orders Detector - Whale Activity SpotterDetect Institutional & Whale Trading Activity with Volume Analysis
This indicator helps traders identify significant buy/sell orders (whale activity) by analyzing volume spikes and price movements. Perfect for spotting institutional entries and exits.
📊 Key Features:
Volume Spike Detection - Identifies when volume exceeds average by customizable multiplier
Price Movement Analysis - Tracks significant price changes with adjustable threshold
Smart Direction Detection - Distinguishes between big buy and sell orders
Visual Markers - Clear arrows, background highlights, and detailed labels
Flexible Settings - Fully customizable parameters for different trading styles
Statistics Table - Optional real-time order count tracking
Alert System - Built-in alerts for automated notifications
⚙️ How It Works:
The indicator combines volume analysis with price movement detection to identify unusual market activity. When volume significantly exceeds the moving average AND price shows meaningful movement, it marks these as potential whale orders.
🎯 Best Used For:
Crypto markets with high volume activity
Forex pairs during major news events
Stock trading around earnings/announcements
Identifying institutional accumulation/distribution
📈 Settings Guide:
Volume Multiplier (3.0) - How many times above average volume (recommended minimum: 3.0)
Volume Period (20) - Moving average period for volume
Price Threshold (1.5%) - Minimum price change requirement
Visual Options - Toggle arrows, labels, and background highlights
💡 Trading Tips:
Use on liquid markets with consistent volume
Combine with support/resistance levels
Higher timeframes show more significant orders
Adjust sensitivity based on market volatility
⚠️ Important Notes:
Not financial advice - for educational purposes only
Past performance doesn't guarantee future results
Always use proper risk management
Test parameters on your specific markets
Perfect for swing traders, day traders, and anyone looking to spot whale activity in their favorite markets!

Price Action Volumetric Breaker Blocks [UAlgo]The Price Action Volumetric Breaker Blocks indicator is designed to identify and visualize significant price levels in the market. It combines concepts of price action, volume analysis, and market structure to provide traders with a comprehensive view of potential support and resistance areas. This indicator identifies "breaker blocks," which are price zones where the market has shown significant interest in the past.
These blocks are created based on swing highs and lows, and are further analyzed using volume data to determine their strength. The indicator also tracks market structure shifts, providing additional context to price movements.
By visualizing these key levels and market structure changes, traders can gain insights into potential areas of price reversal or continuation, helping them make more informed trading decisions.
🔶 Key Features
Dynamic Breaker Block Identification: The indicator automatically detects and draws breaker blocks based on swing highs and lows. These blocks represent areas of potential support and resistance.
Volume-Weighted Strength Analysis: Each breaker block is analyzed using volume data to determine its bullish and bearish strength. This is visually represented by the proportion of green (bullish) and red (bearish) coloring within each block.
Market Structure Break (MSB) and Break of Structure (BOS): The indicator identifies and labels Market Structure Breaks (MSB) and Break of Structure (BOS) events, providing context to larger market trends.
Customizable Settings:
- Adjustable swing length for identifying pivot points
- Option to show a specific number of recent breaker blocks
- Choice between wick or close price for violation checks
- Toggle to hide overlapping blocks for cleaner analysis
Violation Detection: Automatically detects when a breaker block has been violated (broken through), either by wick or close price, depending on user settings.
Overlap Control: Provides an option to hide overlapping order blocks, ensuring that the chart remains clean and easy to read when multiple blocks are detected in close proximity.
🔶 Interpreting Indicator
Breaker Blocks:
Breaker blocks are key areas where the price moves through and invalidates a previously identified order block. The indicator detects a breaker block when the price violates an order block by exceeding its high or low (depending on whether it's a bullish or bearish block). This violation is determined by either the wick or the close of a candle, depending on the user's selection in the "Violation Check" setting. When a breaker block is detected, the indicator removes the violated order block from the chart, signaling that the zone is no longer relevant for future price action.
Bullish Breaker Block: This occurs when a bearish order block (red) is violated by the price closing above the block’s top boundary or when the wick surpasses this level. It signals that a prior bearish structure has been invalidated, and the market may shift to a bullish trend.
Bearish Breaker Block: This occurs when a bullish order block (teal) is violated by the price closing below the block’s bottom boundary or when the wick drops below it. It suggests that a previous bullish structure has been broken, indicating potential bearish momentum.
Market Structure Labels:
"MSB" (Market Structure Break) labels indicate a potential change in trend direction.
"BOS" (Break of Structure) labels confirm the continuation of the current trend after breaking a significant level.
Block Strength:
A block with more green indicates stronger bullish interest.
A block with more red indicates stronger bearish interest.
The relative sizes of the green and red portions show the balance of power between buyers and sellers at that level.
🔶 Disclaimer
Use with Caution: This indicator is provided for educational and informational purposes only and should not be considered as financial advice. Users should exercise caution and perform their own analysis before making trading decisions based on the indicator's signals.
Not Financial Advice: The information provided by this indicator does not constitute financial advice, and the creator (UAlgo) shall not be held responsible for any trading losses incurred as a result of using this indicator.
Backtesting Recommended: Traders are encouraged to backtest the indicator thoroughly on historical data before using it in live trading to assess its performance and suitability for their trading strategies.
Risk Management: Trading involves inherent risks, and users should implement proper risk management strategies, including but not limited to stop-loss orders and position sizing, to mitigate potential losses.
No Guarantees: The accuracy and reliability of the indicator's signals cannot be guaranteed, as they are based on historical price data and past performance may not be indicative of future results.

Market Structure Break Targets [UAlgo]The "Market Structure Break Targets " indicator is designed to identify and visualize key market structure points such as Market Structure Breaks (MSBs) and Break of Structures (BoS). These points are crucial for understanding market trends and potential reversal zones. By plotting these structures on the chart, traders can easily spot significant support and resistance levels, as well as potential entry and exit points.
This indicator uses a combination of swing highs and lows to determine market structures and calculates targets based on user-defined percentages or Average True Range (ATR) multipliers. It provides visual cues in the form of lines, labels, and boxes to help traders quickly interpret market conditions.
🔶 Key Features
Customizable Swing Length: Users can set the swing length to identify the pivot highs and lows, which are crucial for determining market structure.
Target Duration Bars: Defines the maximum duration (in bars) for which the targets will be considered valid.
Target Calculation Methods: The target levels are crucial for setting potential price objectives. The calculation can be based on a percentage move from the identified pivot or using the ATR to factor in market volatility. These targets help in setting realistic profit-taking levels or identifying stop-loss placements.
Bullish and Bearish Market Structure Break (MSB): Detects and highlights bullish and bearish market structure breaks with customizable colors and target percentages.
Bullish MSB
When the price closes above a significant pivot high, a bullish MSB is identified. The indicator will draw a line at this level and calculate a target based on the chosen method (percentage or ATR). The target is visualized with a dotted line, and a label "MSB" is displayed. Additionally, an order block is created at the level of the bullish MSB. This order block is highlighted with a semi-transparent box, representing a potential area where price might find support in the future.
Bearish MSB
Conversely, when the price closes below a significant pivot low, a bearish MSB is marked. Similar to bullish MSBs, targets are calculated and displayed on the chart. An order block is also generated at the level of the bearish MSB, visualized with a semi-transparent box. This box highlights a potential resistance area where price might face selling pressure.
Bullish and Bearish Break of Structure (BoS): Identifies break of structures for both bullish and bearish scenarios, providing additional target levels.
Bullish BoS
If the price continues to rise and breaks another significant level, a bullish BoS is detected. This break is also marked with lines and labels, providing additional target levels for traders. An order block is created at the BoS level, serving as a potential support zone.
Bearish BoS
If the price falls further after a bearish MSB, a bearish BoS is identified and visualized similarly. The indicator creates an order block at the BoS level, which acts as a potential resistance zone.
🔶 Disclaimer:
Use with Caution: This indicator is provided for educational and informational purposes only and should not be considered as financial advice. Users should exercise caution and perform their own analysis before making trading decisions based on the indicator's signals.
Not Financial Advice: The information provided by this indicator does not constitute financial advice, and the creator (UAlgo) shall not be held responsible for any trading losses incurred as a result of using this indicator.
Backtesting Recommended: Traders are encouraged to backtest the indicator thoroughly on historical data before using it in live trading to assess its performance and suitability for their trading strategies.
Risk Management: Trading involves inherent risks, and users should implement proper risk management strategies, including but not limited to stop-loss orders and position sizing, to mitigate potential losses.
No Guarantees: The accuracy and reliability of the indicator's signals cannot be guaranteed, as they are based on historical price data and past performance may not be indicative of future results.

Smart Money Setup 03 [TradingFinder] Minor OB & Trend Proof🔵 Introduction
The "Smart Money Concept" transcends mere technical trading strategies; it embodies a comprehensive philosophy elucidating market dynamics. Central to this concept is the acknowledgment that influential market participants manipulate price actions, presenting challenges for retail traders.
As a "retail trader", aligning your strategy with the behavior of "Smart Money," primarily market makers, is paramount. Understanding their trading patterns, which revolve around supply, demand, and market structure, forms the cornerstone of your approach. Consequently, decisions to enter trades should be informed by these considerations.
🟣 Important Note
In this setup, pattern formation revolves around the robustness of the "Stop Hunt" targeting retail traders.
When this stop hunt occurs, if the price tests below the minor pivot or above the minor pivot, a "Minor Order Block" is formed.
Similarly, if the price tests below the major pivot or above the major pivot, a "Major Order Block" is formed.
Since the price hasn't successfully broken the major pivots before breaking the Top or Bottom, it can be inferred that the minor pivots formed within a leg of price movement exhibit a "Range" structure.
For a deeper comprehension of this setup, refer to the accompanying visual aids below.
Bullish Setup Details :
Bearish Setup Details :
🔵 How to Use
Upon integrating the indicator into your chart, exercise patience as you await the evolution of the trading setup.
Experiment with different trading positions by adjusting both the "Time Frame" and "Pivot Period". Typically, setups materializing over longer "Time Frames" and "Pivot Periods" carry heightened validity.
Bullish Setup Details on Chart :
Bearish Setup Details on Chart :
Within the settings, you possess the flexibility to modify the "Pivot Period" input to tailor the indicator to your preferences.

action zone - ATR stop reverse order strategy v0.1 by 9nckACTION ZONE-ATR MOD v0.1 DOCUMENTATION
Overview
This tradingview pine script strategy is mainly created to enrich my coding skill. It is a combination of “CDC-ACTIONZONE” and my personal studies of trading techniques in various sources e.g.book, course or blog. This strategy purposefully built to connect with my automatic trading bot. However, It will be very useful to aid your trading routine by diminishing mental distraction which possibly leads to bad trades.
How does it work?
This strategy will do a basic simple thing that most traders do by creating entry signals on both sides long/short and also set the stop loss. Furthermore, It will also reverse the order (from long to short and vice versa (if long/short conditions are met). Finally, it will recalculate the stop loss/take profit price in every complete bar to increase the chance of winning and limit our loss.
Entry rules(Long/Short)
If you have no open order, an order will be created when a fast EMA crosses(up(long)/down(short) the slow EMA(It’s as simple as that).
If you have an open order, the current order will be (sold if long, covered if short) and the opposite side order will be created.
Exit and Reverse rules(Long/Short)
If fast EMA cross (DOWN(long), UP(short)), the current order will be closed, THE OPPOSITE SIDE ORDER WILL ALSO BE CREATED.
Risk management
FLEX STOP PRICE : initial value will be set at the bar which order created. It is a fast ema (+/-) MIDDLE ATR value.
If MIDDLE ATR value rises, it will be our new stop price.
If MIDDLE ATR value falls, stop price unchanged
If Price OVERBOUGHT(long)/SOLD(short), LOW of that bar will be a new stop price.
Minimum position hold period
In order to eliminate risk of repeatedly open, close orders in sideway trends. Minimum hold period must be passed to start exit our position. However, It always respects stop loss prices. The value refers to the number of bars.
MUST READ!!!
This strategy uses only MARKET ORDER. If you trade with a bot, make sure you choose only enormous market cap tokens.
This strategy is bi-direction strategy. It will work best in the DERIVATIVE market.
It was initially designed to compete in the cryptocurrency market which has very high volume and volatility.
I only use this strategy in 1HR (acceptable change rate, optimum trade frequency)
How (should) we use it?
Choose crypto future pairs (recommend only top 10-15 market volume pairs in Binance, let’s say 1000M+ trade value)
Choose your time frame (1H is strongly recommended)
Setup your portfolio profile (Setting->Properties) such as Initial cap, order size, commission. DO NOT USE CAL ON EVERY TICK IT WILL CAUSE REPAINTING AND YOUR CAPITAL IS BLEEDING !!!
BACKTEST FIRST!! Back test is a combination of art, math and statis(and a bit of luck). You can apply to train and test methods or whatever you are familiar with. In my opinion, your test period should include UPTREND, SIDEWAY, DOWNTREND. Fine tune fast, slow ema first(my best ema length of 1H timeframe around 7-10, 17-22). Try to eliminate fault breakout trade and use other options only necessary. Hopefully we can use automatic optimization on Pine Script soon.
Don’t forget to turn off using a specific backtest date option to start your strategy.A
THIS IS NOT A PERFECT (OR EVEN PROFITABLE) STRATEGY. USE AT YOUR OWN RISK AND TRADE RESPONSIBLY. DYOR DUDE.

[S1B] Engulfing Orderblock
The Engulfing Orderblock indicator is a custom script designed to visually highlight and track bullish and bearish engulfing patterns on a price chart. These patterns are widely used in technical analysis to identify potential reversal points. The indicator dynamically draws colored boxes around the previous candle involved in the engulfing event, making it easier for traders to spot these setups in the price action.
Key Features:
Bullish Engulfing Pattern:
When a bearish candle (one where the open is higher than the close) is followed by a candle whose close is above the previous candle’s open, the indicator detects a bullish engulfing pattern. A green box is drawn around the previous candle.
• Box Style Options: Users can choose whether the box represents the candle’s body (from open to close) or its wick (from open to low).
Bearish Engulfing Pattern:
When a bullish candle (one where the open is lower than the close) is followed by a candle whose close is below the previous candle’s open, a bearish engulfing pattern is identified. A red box is drawn around the previous candle.
• Box Style Options: The box can be drawn using the candle’s body (from close to open) or its wick (from high to open), according to the user’s preference.
Dynamic Box Management:
Once a box is drawn, the indicator continuously monitors the price. If the price moves beyond the box’s range, the box is either deleted or its color changes to gray, indicating that the pattern’s relevance may be diminishing.
Max Pattern Tracking:
To prevent clutter, the indicator limits the number of displayed engulfing boxes to 500 by default. Older boxes are removed as new patterns are detected.
Customization:
Users can adjust the number of previous bars scanned for engulfing patterns as well as the maximum number of patterns displayed. An option is also provided to select whether the box should reflect the candle’s body or include the wick.
How It Works:
Pattern Detection:
The script compares the current price with the previous candle’s data to detect either a bullish or bearish engulfing pattern.
Box Creation:
When a pattern is detected, a colored box is drawn around the previous candle’s price range (using the user-selected style) to visually highlight the orderblock.
Pattern Expiry and Cleanup:
The indicator monitors each drawn box, deleting or modifying it (changing the color to gray) if the price moves significantly beyond the box’s range.
Remark:
The original concept for this indicator is from daisukeburn .

Cnagda Liquidit Trading SystemCnagda Liquidit Trading System helps spot where price is likely to trap traders and reverse, then gives simple, actionable Level to entry, place SL, and take profits with confidence. It blends imbalance zones, trend bias, order blocks, liquidity pools, high-probability fake Signal, and context-aware candle patterns into one clean workflow.
🟩🟥 Imbalance boxes: “Crowd rushed, gaps left”
What it is: Green/red boxes mark fast, one-sided moves where price “skipped” orders—think FVG-like zones that often get revisited.
Why it helps: Price frequently pulls back to “fill” these zones, creating clean retest entries with logical stops.
⏩How to use:
Green box = potential demand retest; Red box = potential supply retest. Enter on pullback into box, not on first impulse. Put stop on far side of box and aim first targets at recent swing points.
↕️ Swing bias (HH/HL vs LH/LL): “Which way is the road?”
What it is: Higher-highs/higher-lows = up-bias; Lower-highs/lower-lows = down-bias. system plots Buy/Sell OB levels aligned with that bias.
Why it helps: Trading with the broader flow reduces “hero trades” against institutions. Bias gives clearer entries and cleaner drawdowns.
⏩How to use:
Up-bias: look for long on Buy OB retests. Down-bias: look for short on Sell OB retests. Wait for a small rejection/engulfing to confirm before triggering.
🧱Order blocks: “Where big players remember”
What it is: last opposite-colored candle before an impulsive move—these zones often hold memory and reaction. system plots these as Buy/Sell OB lines.
Why it helps: Many breakouts pull back to the origin. Good entries often happen on retest, not on the breakout chase.
⏩ How to use:
Let price return into the OB, show wick rejection, and decent volume. Enter with stop beyond OB; define risk-reward before entry.
📊Volume coloring: “How Volume is move?”
What it is: Bar color reflects relative volume; inside bars are black. The dashboard also shows Volume and “Volume vs Prev.”
Why it helps: Patterns without volume often fade; volume validates strength and intent of moves.
⏩ How to use:
Favor entries where imbalance/OB/liquidity-grab coincide with higher volume. If volume is weak, reduce size or skip.
🧲 BSL/SSL liquidity pools: “Fishing for stops”
What it is: Equal highs cluster stops above (BSL); equal lows cluster stops below (SSL). system plots these and highlights the nearest one (“magnet”).
Why it helps: Price often sweeps these pools to trigger stops before reversing. This is a prime trap-reversal location.
⏩ How to use:
Watch nearest BSL/SSL. If price wicks through and closes back inside, anticipate a reversal. Trade reaction, not first poke. When price closes beyond, consider that pool mitigated and move on.
🟢🔴 Advanced liquidity grab: “Catch fakeout”
What it is: Bullish grab = makes a new low beyond a prior low but closes back above it, with a long lower wick, small body, and higher volume. Bearish is mirror. Labeled automatically.
Why it helps: It exposes trap moves (stop hunts) and often precedes true direction.
⏩ How to use:
Best when it aligns with a nearby imbalance/OB and supportive volume. Enter on reversal candle break or on retest. Stop goes beyond sweep wick.
🧠 Smart candlestick patterns (only in right place)
What it is: Engulfing, Hammer, Shooting Star, Hanging Man, Doji (with high volume), Morning/Evening Star, Piercing—but marked “effective” only if context (swing/trend/location) agrees.
Why it helps: same pattern in the wrong place is noise; in the right place, it’s signal.
⏩ How to use:
Location first (BSL/SSL/OB/imbalance), then pattern. Treat pattern as trigger/confirmation—one fresh label shows to keep chart clean.
🧭 Dashboard: “Context in a glance”
⏩ Reversal Level: current swing anchor—expect turns or reactions nearby; great for alerts and planning.
⏩ Volume vs Prev + Volume: Strength meter for signal candle—higher adds conviction.
⏩ Nearest Pool: next “magnet” area—look for sweeps/rejections there.
🧩Step-by-step trading flow (with mindset)
⏩ Set bias: HH/HL = long bias, LH/LL = short bias. Counter-trend only on clean sweeps with strong confirmation.
⏩ Find magnet: Check Nearest Pool (BSL/SSL). Focus attention there; it saves screen time.
⏩ Wait for event: Look for a sweep/grab label, or sharp rejection at pool/OB/imbalance. Avoid FOMO.
⏩ Add confluence: Stack 2–3 of these—imbalance box, OB, contextual pattern, supportive volume.
⏩Plan entry: Bullish: trigger above reversal candle high or take retest of FVG/OB. Stop below sweep wick/zone. Target at least 1:1.5–1:2.
Bearish: mirror above.
⏩Manage smartly: Take partials, move to breakeven or trail thoughtfully. Don’t drag stops inside zone out of emotion.
🎛️ Parameter tuning (to reduce human error)
⏩ swingLen: Smaller = faster but noisier; larger = cleaner but slower. Backtest first, then go live.
⏩ Tolerance (ATR or percent): ATR tolerance adapts to volatility (good for fast markets and lower TFs). Start around 0.15–0.30. In calm markets, try percent 0.05–0.15%.
⏩ minBarsGap: Start with 3–5 so equal highs/lows are truly equal—reduces false pools.
❌Common mistakes → ✅ Better habits
⏩Chasing every breakout → Wait for sweep/rejection, then confirm.
⏩Ignoring volume → Validate strength; cut size or skip on weak volume.
⏩Losing history of pools → If reviewing/backtesting, keep mitigated pools visible (dashed/faded).
⏩Over-tight tolerance/too small swingLen → Increases false signals; backtest to find balance.
📝 checklist (before entry)
⏩ Is there a nearby BSL/SSL and did a sweep/grab happen there?
⏩ Is there a close imbalance/OB that price can retest?
⏩ Do we have an effective pattern plus supportive volume?
⏩Is the stop beyond the wick/zone and RR ≥ 1:1.5?
•?((¯°·._.• 🎀 𝐻𝒶𝓅𝓅𝓎 𝒯𝓇𝒶𝒹𝒾𝓃𝑔 🎀 •._.·°¯((?•

Cumulative Volume Delta (SB-1) 2.0
📈 Cumulative Volume Delta (CVD) — Stair-Step + Threshold Alerts
🔍 Overview
This Cumulative Volume Delta (CVD) tool visualizes aggressive buying and selling pressure in the market by plotting candlestick-style bars based on volume delta. It helps traders understand which side — buyers or sellers — is exerting more control on lower timeframes and highlights momentum shifts through stair-step patterns and delta threshold breaks. Resets to zero at EOD
Ideal for futures traders, scalpers, and intraday strategists looking for orderflow-based confirmation.
🧠 What Is CVD?
CVD (Cumulative Volume Delta) measures the difference between market buys and sells over a specific timeframe. When the delta is rising, it suggests buyers are being more aggressive. Falling delta suggests seller dominance.
This script aggregates volume delta from a lower timeframe and plots it in a higher timeframe context, allowing you to track microstructure shifts within larger candles.
📊 Features
✅ CVD Candlesticks
Each bar represents volume delta as an OHLC-style candle using:
Open: Delta at the start of the bar
High/Low: Peak delta range
Close: Final delta value at bar close
Teal candles = Net buying pressure
Red candles = Net selling pressure
✅ Threshold Levels (Key Visual Zones)
The script includes horizontal dashed lines at:
+5,000 and +10,000 → Signify strong buying pressure
-5,000 and -10,000 → Signify strong selling pressure
0 line → Neutrality line (no net pressure)
These levels act as volume-based support/resistance zones and breakout confirmation tools. For example:
A CVD cross above +5,000 shows buyers taking control
A CVD cross above +10,000 implies strong bullish momentum
A CVD cross below -5,000 or -10,000 signals intense selling pressure
📈 Stair-Step Pattern Detection
Detects two specific volume-based continuation setups:
Bullish Stair-Step: Both the high and low of the CVD candle are higher than the previous candle
Bearish Stair-Step: Both the high and low of the CVD candle are lower than the previous candle
These patterns often appear during trending moves and serve as confirmation of strength or continuation.
Visual markers:
🟢 Green triangles below bars = Bullish stair-step
🔴 Red triangles above bars = Bearish stair-step
🔔 Alert Conditions
Get real-time alerts when:
Bullish Stair-Step is detected
Bearish Stair-Step is detected
CVD crosses above +5,000
CVD crosses below -5,000
📢 Alerts only trigger on crossover, not every time CVD remains above or below. This avoids repetitive notifications.
⚙️ Inputs & Customization
Anchor Timeframe: The higher timeframe to which CVD data is applied (default: 1D)
Lower Timeframe: The timeframe used to calculate the CVD delta (default: 5 minutes)
Optional Override: Use custom timeframe toggle to force your own micro timeframe
📌 How to Use This CVD Indicator (Step-by-Step Guide)
✅ 1. Confirm Bias Using the Zero Line
The zero line (0 CVD) represents neutral pressure — neither buyers nor sellers are dominating.
Use it as your first filter:
🔼 If CVD is above 0 and rising → Buyer control
🔽 If CVD is below 0 and falling → Seller control
🧠 Tip: CVD rising while price is consolidating may signal hidden buyer interest.
✅ 2. Watch for Crosses of Key Levels: +5,000 and +10,000
These levels act as momentum thresholds:
Level Signal Type What It Means
+5,000 Buyer breakout Buyers are starting to dominate
+10,000 Strong bull bias Strong institutional or algorithmic buying flow
-5,000 Seller breakout Sellers are taking control
-10,000 Strong bear bias Heavy selling pressure is entering the market
Wait for CVD to cross above +5K or below -5K to confirm the active side.
Use these crossovers as entry triggers, breakout confirmations, or trade filters.
🔔 Alerts fire only when the level is first crossed, not every bar above/below.
✅ 3. Use Stair-Step Patterns for Continuation Confirmation
The indicator shows stair-step patterns using triangle signals:
🟢 Green triangle below bar = Bullish stair-step
Suggests a higher high and higher low in delta → buyers stepping up
🔴 Red triangle above bar = Bearish stair-step
Suggests lower highs and lower lows in delta → selling pressure building
Use stair-step signals:
To confirm a continuation of trend
As an entry or add-on signal
Especially after a threshold breakout
🧠 Example: If CVD breaks above +5K and forms bullish stairs → confirms strong trend, ideal for momentum entries.
✅ 4. Combine with Price Action or Structure
CVD works best when used with price, not in isolation. For example:
📉 Price makes a new low but CVD doesn’t → potential bullish divergence
📈 CVD surges while price lags → buyers are absorbing, breakout likely
Use it with:
VWAP
Orderblocks
Liquidity sweeps
Break of market structure/MSS/BOS
✅ 5.
Set Anchor Timeframe = Daily
Set Lower Timeframe = 5 minutes (default)
This lets you:
See intraday flow inside daily bars
Confirm whether a daily candle is being built on net buying or selling
🧠 You’re essentially seeing intra-bar aggression within a bigger time structure.
🧭 Example Trading Setup
Bullish Scenario:
CVD is rising and above 0
CVD crosses above +5,000 → alert fires
Green stair-step appears
Price breaks local resistance or liquidity sweep completes
✅ Consider long entry with structure and CVD alignment
🎯 Place stops below last stair-step or structural low
📌 Final Notes
This tool does not repaint and is designed to work in real-time across all futures, crypto, and equity instruments that support volume data. If your symbol does not provide volume, the script will notify you.
Use it in confluence with VWAP, liquidity zones, or structure breaks for high-confidence trades.

Cluster Reversal Zones📌 Cluster Reversal Zones – Smart Market Turning Point Detector
📌 Category : Public (Restricted/Closed-Source) Indicator
📌 Designed for : Traders looking for high-accuracy reversal zones based on price clustering & liquidity shifts.
🔍 Overview
The Cluster Reversal Zones Indicator is an advanced market reversal detection tool that helps traders identify key turning points using a combination of price clustering, order flow analysis, and liquidity tracking. Instead of relying on static support and resistance levels, this tool dynamically adjusts to live market conditions, ensuring traders get the most accurate reversal signals possible.
📊 Core Features:
✅ Real-Time Reversal Zone Mapping – Detects high-probability market turning points using price clustering & order flow imbalance.
✅ Liquidity-Based Support/Resistance Detection – Identifies strong rejection zones based on real-time liquidity shifts.
✅ Order Flow Sensitivity for Smart Filtering – Filters out weak reversals by detecting real market participation behind price movements.
✅ Momentum Divergence for Confirmation – Aligns reversal zones with momentum divergences to increase accuracy.
✅ Adaptive Risk Management System – Adjusts risk parameters dynamically based on volatility and trend state.
🔒 Justification for Mashup
The Cluster Reversal Zones Indicator contains custom-built methodologies that extend beyond traditional support/resistance indicators:
✔ Smart Price Clustering Algorithm: Instead of plotting fixed support/resistance lines, this system analyzes historical price clustering to detect active reversal areas.
✔ Order Flow Delta & Liquidity Shift Sensitivity: The tool tracks real-time order flow data, identifying price zones with the highest accumulation or distribution levels.
✔ Momentum-Based Reversal Validation: Unlike traditional indicators, this tool requires a momentum shift confirmation before validating a potential reversal.
✔ Adaptive Reversal Filtering Mechanism: Uses a combination of historical confluence detection + live market validation to improve accuracy.
🛠️ How to Use:
• Works well for reversal traders, scalpers, and swing traders seeking precise turning points.
• Best combined with VWAP, Market Profile, and Delta Volume indicators for confirmation.
• Suitable for Forex, Indices, Commodities, Crypto, and Stock markets.
🚨 Important Note:
For educational & analytical purposes only.

Relative volume zone + Smart Order Flow Dynamic S/ROverview:
The Relative Volume Zone + Smart Order Flow with Dynamic S/R indicator is designed to help traders identify key trading opportunities by combining multiple technical components. This script integrates relative volume analysis, order flow detection, VWAP, RSI filtering, and dynamic support and resistance levels to offer a comprehensive view of the market conditions. It is particularly effective on shorter timeframes (M5, M15), making it suitable for scalping and day trading strategies.
Key Components:
1. Relative Volume Zones:
• The script calculates the relative volume by comparing the current volume with the average volume over a defined lookback period (volLookback). When the relative volume exceeds a specified multiplier (volMultiplier), it indicates a high volume zone, signaling potential accumulation or distribution areas.
• Purpose: Identifies high-volume trading zones that may act as significant support or resistance, indicating possible entry or exit points.
2. Smart Order Flow Analysis:
• The indicator uses Volume Delta (the difference between buying and selling volume) and a Cumulative Delta to detect order imbalances in the market.
• Order Imbalance is identified using a moving average of the Volume Delta (orderImbalance), which helps highlight hidden buying or selling pressure.
• Purpose: Reveals market sentiment by showing whether buyers or sellers dominate the market, aiding in the identification of trend reversals or continuations.
3. VWAP (Volume Weighted Average Price):
• VWAP is calculated over a default daily length (vwapLength) to show the average price a security has traded at throughout the day, based on both volume and price.
• Purpose: Provides insight into the fair value of the asset, indicating whether the market is in an accumulation or distribution phase.
4. RSI (Relative Strength Index) Filter:
• RSI is used to filter buy and sell signals, preventing trades in overbought or oversold conditions. It is calculated using a specified period (rsiPeriod).
• Purpose: Reduces false signals and improves trade accuracy by only allowing trades when RSI conditions align with volume and order flow signals.
5. Dynamic Support and Resistance Levels:
• The script dynamically plots support and resistance levels based on recent swing highs and lows (swingLookback).
• Purpose: Identifies potential reversal zones where price action may change direction, allowing for more precise entry and exit points.
How It Works:
• Buy Signal:
A buy signal is generated when:
• The price enters a high-volume zone.
• The price crosses above a 5-period moving average.
• The cumulative delta shows more buying pressure (cumulativeDelta > SMA of cumulativeDelta).
• The RSI is below 70 (not in overbought conditions).
• Sell Signal:
A sell signal is generated when:
• The price enters a high-volume zone.
• The price crosses below a 5-period moving average.
• The cumulative delta shows more selling pressure (cumulativeDelta < SMA of cumulativeDelta).
• The RSI is above 30 (not in oversold conditions).
• Dynamic Support and Resistance Lines:
Drawn based on recent swing highs and lows, these lines provide context for potential price reversals or breakouts.
• VWAP and Order Imbalance Lines:
Plotted to show the average traded price and highlight order flow shifts, helping to validate buy/sell signals.
How to Use:
1. Apply the Indicator:
Add the script to your chart and adjust the settings to match your trading style and preferred timeframe (optimized for M5/M15).
2. Interpret the Signals:
Use the buy and sell signals in conjunction with dynamic support/resistance, VWAP, and order imbalance lines to identify high-probability trade setups.
3. Monitor Alerts:
Set alerts for significant order flow events to receive notifications when there is a positive or negative order imbalance, indicating potential market shifts.
What Makes It Unique:
This script is unique because it combines multiple market analysis tools — relative volume zones, smart order flow, VWAP, RSI filtering, and dynamic support/resistance — to provide a well-rounded, multi-dimensional view of the market. This integration allows traders to make more informed decisions by validating signals across various indicators, enhancing overall trading accuracy and effectiveness.

OKX Signal BOT - Strategy Scanner & Orderer
Hello traders,
With the OKX Signal BOT - Strategy Scanner & Orderer, you can now design your own strategy, scan over 20 cryptocurrencies, and send orders for futures trades on the OKX exchange.
How to Use:
🌐 First, log into your account on the OKX exchange and create a signal bot.
📝 While creating the signal bot, note down the webhook URL and signal token variables given to you; they'll be needed later.
🔍 Select the trading pairs that the bot will work on.
📈 Add this indicator to your chart.
⚙️ Adjust the values of the indicators you will use in your strategy.
📊 Set your entry conditions and indicator setups according to your preference.
🚀 Decide which condition will generate a LONG signal and which will generate a SHORT signal.
🔗 Then, link these conditions with either an AND or OR connector.
🛠️ This also serves as a strategy designer.
🆔 Paste the signal token value you got from OKX into the OKX Signal ID section in the indicator.
➕ Add the cryptocurrency pairs you added to the bot on OKX to this design tool as well.
💾 Save and exit.
🚨 Set an alarm and paste the webhook URL link you got from OKX.
Congratulations, you can now send signals from Tradingview to the OKX exchange without needing any other platform.
Warnings:
⚠️ Works only for futures trades.
📈 Make your leverage settings through the exchange.
🛑 It is recommended to set take profit and stop loss through the exchange.
🚫 If too many alarms are triggered, Tradingview may stop your alarms.
💡 Ensure that the coins you add in the symbol section are from the OKX exchange.
🔍 For futures trades, make sure the symbols end with ".P".
🎉 Enjoy using it!

Limit Order + ATR Stop-Loss [TANHEF]This indicator enables interactive placement of limit or stop-limit orders with a trailing ATR stop-loss and optional profit target (with alerts). Refer to the images below for further clarification.
Why use a trailing stop-loss?
A trailing stop-loss serves as an exit strategy when price moves against you, while also allowing you to adjust the exit point further into profit when price moves favorably. The ATR (Average True Range), a reliable measure of volatility, acts as an effective risk management tool, functioning as a trailing stop-loss.
Indicator Explanation
Initial indicator placement: Select Long Limit or Long-Stop Limit order.
Change Entry Type: Switch between Long and Short within settings.
Modify entry price: Drag circle, adjust in settings, or re-add indicator to chart.
Optional Profit Target: Use Risk/Reward ratio or specify price.
Entry anticipation: Estimated ATR stop-loss and profit target as blue circles (fluctuates with volatility changes).
Entry triggered: Actual ATR stop-loss and profit target plotted.
Exit conditions: Stop-loss or profit target hit, exit entry.
Update Frequency: Continuously, Bar Open, or Bar Open on entry then continuously.
ATR Overlap: no entry occurs if the ATR overlaps with price (stop-loss 'hit' already on entry bar)
Table: Displays input settings selected.
Show Only On Ticker: Ability to hide indicator on other tickers.
Long Limit
Long Stop-Limit
Short Limit
Short Stop-Limit
Alerts
1. 'Check' alerts to use within indicator settings (entry, trailing stop hit, profit target hit, and failed entry).
2. Select 'Create Alert'
3. Set the condition to 'Limit Order + ATR Stop-Loss''
4. Select create.
Additional details can be added to the alert message using these words in between Curly (Brace) Brackets:
{{trail}} = ATR trailing stop-loss (price)
{{target}} = Price target (price)
{{type}} = Long or Short stop-loss (word)
{{traildistance}} = Trailing Distance (%)
{{targetdistance}} = Target Distance (%)
{{starttime}} = Start time of position (day:hr:min)
{{maxdrawdown}} = max loss
{{maxprofit}} = max profit
{{update}} = stoploss update frequency
{{entrysource}} = entry as 1st bar source (yes/no)
{{triggerentry}} = Wick/Close Trigger entry input
{{triggerexit}} = Wick/Close Trigger exit input
{{triggertarget}} = Wick/Close Trigger target input
{{atrlength}} = ATR length input
{{atrmultiplier}} = ATR multiplier input
{{atrtype}} = ATR type input
{{ticker}} = Ticker of chart (word)
{{exchange}} = Exchange of chart (word)
{{description}} = Description of ticker (words)
{{close}} = Bar close (price)
{{open}} = Bar open (price)
{{high}} = Bar high (price)
{{low}} = Bar low (price)
{{hl2}} = Bar HL2 (price)
{{volume}} = Bar volume (value)
{{time}} = Current time (day:hr:min)
{{interval}} = Chart timeframe
{{newline}} = New line for text
