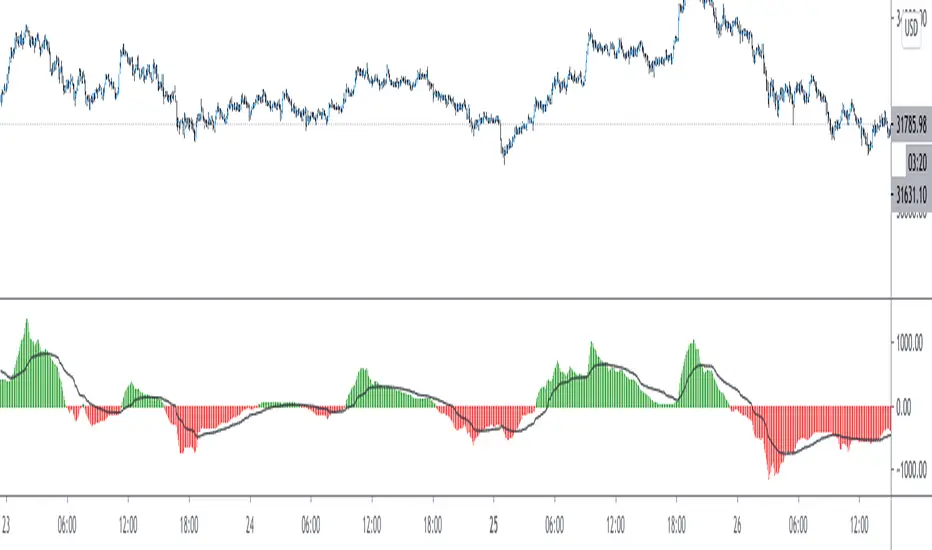
Flunki T-WAP minus MA Oscillator
Yo,
Possible the last of these for now, and mostly for the sake of completeness..
This is..
Another simple oscillator that show the difference in price between a selectable timeframe TWAP and a Moving Average of that TWAP
This is shown as a histogram.
Use numeric TWAP values for minutes (30, 60 ,720 whatever) and D, 3D, W, M for higher values
There is also a global timeframe which will set the timeframe for a global alternate timeframe (instead of current chart resolution)
On top of that is a Moving Average of the histogram value, shown as a blue / red line with an option to highlight this MA crossing zero, and an option to colour bars to this line.
The major difference between this Oscillator, and the other script (Flunki VWAP minus MA Oscillator)
(I treid to insert a link but it's invisible so it would seem, anyway.. )
is that VWAP is usually calculated daily, so there is a sharp move upon the daily close, as VWAP starts a new day. Using TWAP this does not occur, so gives smoother transitions ; also the timeframe for TWAP is selectable for additional wap fun.
Simple idea : Code open
Enjoy !
Tìm kiếm tập lệnh với "oscillator"

Forecast OscillatorThe Forecast Oscillator is a technical indicator that compares a security close price to its time series forecast. The time series forecast function name is "tsf" and it calculates the projection of the price trend for the next bar.
The Forecast Oscillator and therefore the time series forecast are based on linear regression. The time series forecast indicator is equal to the sum of two other indicators: the linear regression (LinearReg) and the linear regression slope (LinearReg_Slope).
If the Forecast Oscillator stays above the zero line for an extended period, then it signals that the price may rise in the future and if it stays below the zero line for an extended period, then it signals a coming fall in the security price.
The indicator name is "Forecast Oscillator" and it accepts two arguments. The first argument is the time series that is used in the next bar forecast (It is usually the close price) and the second one is the period that will be passed to the time series forecast function during calculation . The technical analysis indicator returns a value in percentage that corresponds to the close price minus the previous value of the time series forecast, multiplied by 100 and divided by the close price.
Author's Note:
Just look at the exaggerated movements of the oscillator especially in trend changes . Some examples can be experienced on the chart in rectangles.
Kıvanç Özbilgiç

Delta-RSI Oscillator StrategyDelta-RSI Oscillator Strategy:
This strategy illustrates the use of the recently published Delta-RSI Oscillator as a stand-alone indicator.
Delta-RSI represents a smoothed time derivative of the RSI, plotted as a histogram and serving as a momentum indicator.
There are three optional conditions to generate trading signals (set separately for Buy, Sell and Exit signals):
Zero-crossing : bullish when D-RSI crosses zero from negative to positive values (bearish otherwise)
Signal Line Crossing : bullish when D-RSI crosses from below to above the signal line (bearish otherwise)
Direction Change : bullish when D-RSI was negative and starts ascending (bearish otherwise)
Since D-RSI oscillator is based on polynomial fitting of the RSI curve, there is also an option to filter trade signal by means of the root mean-square error of the fit (normalized by the sample average).
My original D-RSI Oscillator script can be found here:

FRAMA Awesome Oscillator (FAO)FRAMA Awesome Oscillator (FAO) is an indicator that is non-limiting oscillator, providing insight into the weakness or the strength of a security. The Oscillator is used to measure market momentum and to affirm trends or to anticipate possible reversals. It does this by effectively comparing the recent market momentum, with the general momentum over a wider frame of reference.
FRAMA stands for
The Oscillator in the script is calculated using FRAMA of length 55
which is segmented by EVWMA of FRAMA
Calculations:
AO = (Difference of FRAMA and eVWMA basis of FRAMA) or diff
Represented by green and red columns
The black segmenting line is an eVWMA line of diff and is of length 21
This indicator may be useful in finding divergences and can be traded as we trade awesome oscillator in general
[blackcat] L2 Ehlers Decycler OscillatorLevel: 2
Background
John F. Ehlers introuced Decycler Oscillator in Sep, 2015.
Function
In “Decyclers” in Sep, 2015, John Ehlers described a method for constructing an oscillator that could help traders detect trend reversals with almost no lag, an oscillator that signals trend reversals with almost zero lag via digital signal processing techniques. A high-pass filter is subtracted from the input data and the high-frequency components are removed via cancellation of terms. Lower-frequency components are filtered from the output, so they are not canceled from the original data. Thus, the decycler displays them with close to zero lag. The fast line has a period of 100 a K value of 1.2 and the slow line has a period of 125 and a K value of 1.
This script demonstrates the timely response of the decycler oscillator to market action. It applies the idea of using a decycler oscillator pair with different parameters, as discussed in Ehlers’ article:
1. Enter long when the fast line crosses over the slow line;
2. Exit long when the fast line crosses under the slow line.
Key Signal
Fast_Val --> Ehlers Decycler Oscillator fast line
Slow_Val --> Ehlers Decycler Oscillator slow line
Pros and Cons
100% John F. Ehlers definition translation, even variable names are the same. This help readers who would like to use pine to read his book.
Remarks
The 85th script for Blackcat1402 John F. Ehlers Week publication.
Readme
In real life, I am a prolific inventor. I have successfully applied for more than 60 international and regional patents in the past 12 years. But in the past two years or so, I have tried to transfer my creativity to the development of trading strategies. Tradingview is the ideal platform for me. I am selecting and contributing some of the hundreds of scripts to publish in Tradingview community. Welcome everyone to interact with me to discuss these interesting pine scripts.
The scripts posted are categorized into 5 levels according to my efforts or manhours put into these works.
Level 1 : interesting script snippets or distinctive improvement from classic indicators or strategy. Level 1 scripts can usually appear in more complex indicators as a function module or element.
Level 2 : composite indicator/strategy. By selecting or combining several independent or dependent functions or sub indicators in proper way, the composite script exhibits a resonance phenomenon which can filter out noise or fake trading signal to enhance trading confidence level.
Level 3 : comprehensive indicator/strategy. They are simple trading systems based on my strategies. They are commonly containing several or all of entry signal, close signal, stop loss, take profit, re-entry, risk management, and position sizing techniques. Even some interesting fundamental and mass psychological aspects are incorporated.
Level 4 : script snippets or functions that do not disclose source code. Interesting element that can reveal market laws and work as raw material for indicators and strategies. If you find Level 1~2 scripts are helpful, Level 4 is a private version that took me far more efforts to develop.
Level 5 : indicator/strategy that do not disclose source code. private version of Level 3 script with my accumulated script processing skills or a large number of custom functions. I had a private function library built in past two years. Level 5 scripts use many of them to achieve private trading strategy.

Combo Backtest 123 Reversal & Gann Swing Oscillator This is combo strategies for get a cumulative signal.
First strategy
This System was created from the Book "How I Tripled My Money In The
Futures Market" by Ulf Jensen, Page 183. This is reverse type of strategies.
The strategy buys at market, if close price is higher than the previous close
during 2 days and the meaning of 9-days Stochastic Slow Oscillator is lower than 50.
The strategy sells at market, if close price is lower than the previous close price
during 2 days and the meaning of 9-days Stochastic Fast Oscillator is higher than 50.
Second strategy
The Gann Swing Oscillator has been adapted from Robert Krausz's book,
"A W.D. Gann Treasure Discovered". The Gann Swing Oscillator helps
define market swings.
WARNING:
- For purpose educate only
- This script to change bars colors.

Combo Strategy 123 Reversal & Gann Swing Oscillator This is combo strategies for get a cumulative signal.
First strategy
This System was created from the Book "How I Tripled My Money In The
Futures Market" by Ulf Jensen, Page 183. This is reverse type of strategies.
The strategy buys at market, if close price is higher than the previous close
during 2 days and the meaning of 9-days Stochastic Slow Oscillator is lower than 50.
The strategy sells at market, if close price is lower than the previous close price
during 2 days and the meaning of 9-days Stochastic Fast Oscillator is higher than 50.
Second strategy
The Gann Swing Oscillator has been adapted from Robert Krausz's book,
"A W.D. Gann Treasure Discovered". The Gann Swing Oscillator helps
define market swings.
WARNING:
- For purpose educate only
- This script to change bars colors.

[blackcat] L2 Swing Oscillator Swing MeterLevel: 2
Background
Swing trading is a type of trading aimed at making short to medium term profits from a trading pair over a period of a few days to several weeks. Swing traders mainly use technical analysis to look for trading opportunities. In addition to analyzing price trends and patterns, these traders can also use fundamental analysis.
Function
L2 Swing Oscillator Swing Meter is an oscillator based on breakouts. Another important feature of it is the swing meter, which confirms the top or bottom's confidence level with different color candles. The higher of the candles stack up, the higher confidence level is indicated.
Key Signal
absolutebot ---> absolute bottom with very high confidence level
ltbot ---> long term bottom with high confidence level
mtbot ---> middle term bottom with moderate confidence level
stbot ---> short term bottom with low confidence level
absolutetop ---> absolute top with very high confidence level
lttop ---> long term top with high confidence level
mttop ---> middle term top with moderate confidence level
sttop ---> short term top with low confidence level
fastline ---> oscillator fast line
slowline ---> oscillator slow line
Pros and Cons
Pros:
1. reconfigurable swing oscillator based on breakouts
2. swing meter can confirm/validate the bottom and top signal
Cons:
1. not appliable with trading pairs without volume information
2. small time frame may not trigger swing meter function
Remarks
This is a simple but very comprehensive technical indicator
Readme
In real life, I am a prolific inventor. I have successfully applied for more than 60 international and regional patents in the past 12 years. But in the past two years or so, I have tried to transfer my creativity to the development of trading strategies. Tradingview is the ideal platform for me. I am selecting and contributing some of the hundreds of scripts to publish in Tradingview community. Welcome everyone to interact with me to discuss these interesting pine scripts.
The scripts posted are categorized into 5 levels according to my efforts or manhours put into these works.
Level 1 : interesting script snippets or distinctive improvement from classic indicators or strategy. Level 1 scripts can usually appear in more complex indicators as a function module or element.
Level 2 : composite indicator/strategy. By selecting or combining several independent or dependent functions or sub indicators in proper way, the composite script exhibits a resonance phenomenon which can filter out noise or fake trading signal to enhance trading confidence level.
Level 3 : comprehensive indicator/strategy. They are simple trading systems based on my strategies. They are commonly containing several or all of entry signal, close signal, stop loss, take profit, re-entry, risk management, and position sizing techniques. Even some interesting fundamental and mass psychological aspects are incorporated.
Level 4 : script snippets or functions that do not disclose source code. Interesting element that can reveal market laws and work as raw material for indicators and strategies. If you find Level 1~2 scripts are helpful, Level 4 is a private version that took me far more efforts to develop.
Level 5 : indicator/strategy that do not disclose source code. private version of Level 3 script with my accumulated script processing skills or a large number of custom functions. I had a private function library built in past two years. Level 5 scripts use many of them to achieve private trading strategy.

Combo Backtest 123 Reversal & Fractal Chaos Oscillator This is combo strategies for get a cumulative signal.
First strategy
This System was created from the Book "How I Tripled My Money In The
Futures Market" by Ulf Jensen, Page 183. This is reverse type of strategies.
The strategy buys at market, if close price is higher than the previous close
during 2 days and the meaning of 9-days Stochastic Slow Oscillator is lower than 50.
The strategy sells at market, if close price is lower than the previous close price
during 2 days and the meaning of 9-days Stochastic Fast Oscillator is higher than 50.
Second strategy
The value of Fractal Chaos Oscillator is calculated as the difference between
the most subtle movements of the market. In general, its value moves between
-1.000 and 1.000. The higher the value of the Fractal Chaos Oscillator, the
more one can say that it follows a certain trend – an increase in prices trend,
or a decrease in prices trend.
Being an indicator expressed in a numeric value, traders say that this is an
indicator that puts a value on the trendiness of the markets. When the FCO reaches
a high value, they initiate the “buy” operation, contrarily when the FCO reaches a
low value, they signal the “sell” action. This is an excellent indicator to use in
intra-day trading.
WARNING:
- For purpose educate only
- This script to change bars colors.

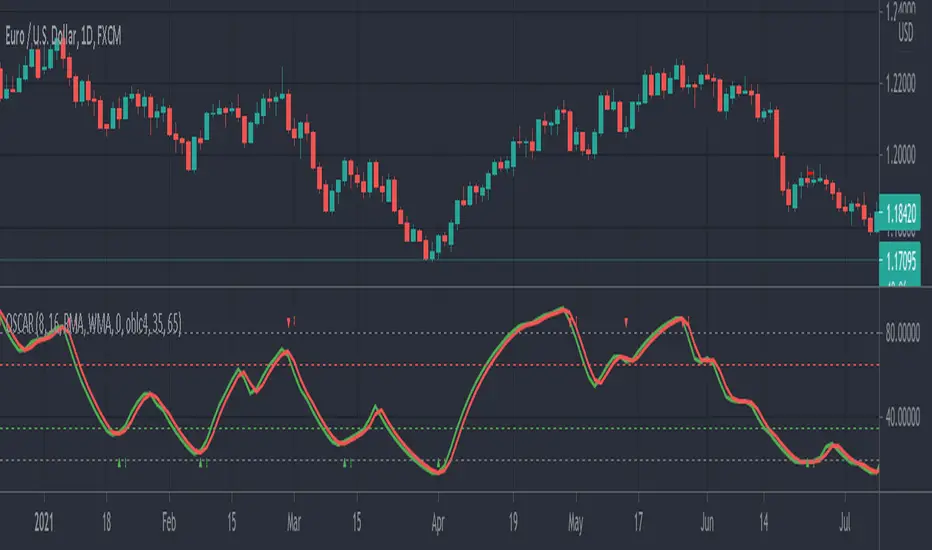
OSCAR Oscillator by GenZai - NNFXOSCAR Oscillator by GenZai
Green line is the Oscar Rough
Red line is the Oscar
By default based on the 8 last candles and smoothed using RMA
Purple line is the Slow Oscar
By default based on the 16 last candles and smoothed using WMA
HOW TO USE
Exit signaling
This indicator can be used as an exit indicator when line cross each other.
Entry signaling
When the green line crosses up, it indicates a long entry
When the red line crosses up, it indicates a short entry
Overbought/Oversold
When the indicator crosses the dashed grey lines it indicates Overbought Oversold
Slow Oscar Add-on
This is an Add-on to the orignal Oscar indicator
Can be hidden if you want the original experience of the Oscar indicator.
Can be used as a confirmation indicator by looking at the direction of the slope to verify is your are trending long or trending short.
Can be used as a baseline to confirm signals given by Oscar
Can be used to tweak your signals and test different settings.
Stock or Forex?
The program was originally written for stocks, but works equally well with the Forex market.
How this indicator is calculated ?
This is the formula we use to calculate the Oscar:
let A = the highest high of the last eight days (including today)
let B = the lowest low of the past eight days (including today)
let C = today's closing price
let X = yesterday's oscillator figure (Oscar)
Today's "rough" oscillator equals (C-B) divided by (A-B) times 100.
Next we "smooth" our rough number (let's call it Y) like this:
Final oscillator number = ((X divided by 3) times 2), plus (Y divided by 3).
SETTINGS:
You can choose between different smoothing options:
RMA: Moving average used in RSI. It is the Adjusted exponential moving averages (also known as Wilder's exponential moving average)
SMA : Simple moving average
EMA : Exponential moving average
WMA : Weighted moving average
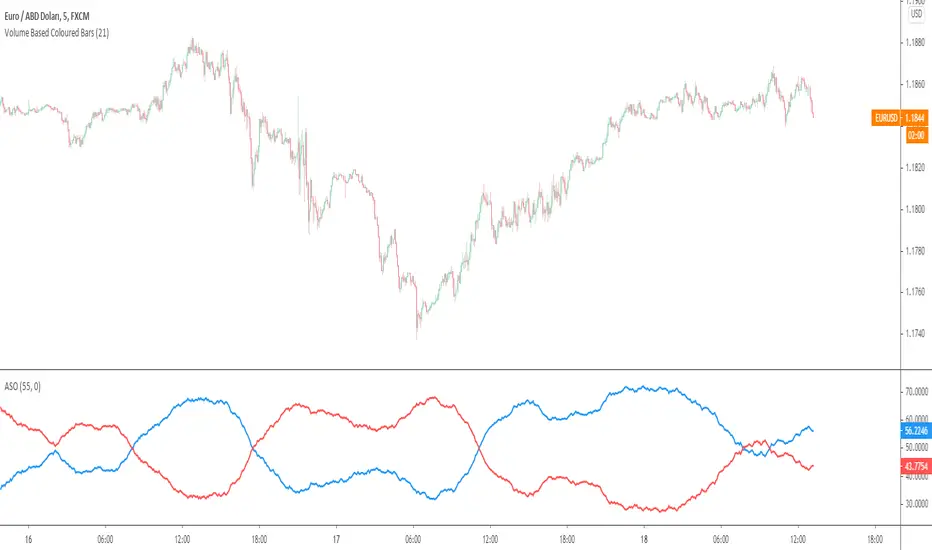
Average Sentiment OscillatorDescription of this indicator from its author:
Average Sentiment Oscillator
Momentum oscillator of averaged bull/bear percentages.
We suggest using it as a relatively accurate way to gauge the sentiment of a given period of candles, as a trend filter or for entry/exit signals.
It’s a combination of two algorithms, both essentially the same but applied in a different way. The first one analyzes the bullish/bearishness of each bar using OHLC prices then averages all percentages in the period group of bars (eg. 10) to give the final % value. The second one treats the period group of bars as one bar and then determines the sentiment percentage with the OHLC points of the group. The first one is noisy but more accurate in respect to intra-bar sentiment, whereas the second gives a smoother result and adds more weight to the range of price movement. They can be used separately as Mode 1 and Mode 2 in the indicator settings, or combined as Mode 0.
Original indicator idea from Benjamin Joshua Nash, converted from MT4 version
Usage:
The blue line is Bulls %, red line is Bears %. As they are both percentages of 100, they mirror each other. The higher line is the dominating sentiment. The lines crossing the 50% centreline mark the shift of power between bulls and bears, and this often provides a good entry or exit signal, i.e. if the blue line closes above 50% on the last bar, Buy or exit Sell, if the red line closes above 50% on the last bar, Sell or exit Buy. These entries are better when average volume is high.
It's also possible to see the relative strength of the swings/trend, i.e. a blue peak is higher than the preceding red one. A clear divergence can be seen in the picture as the second bullish peak registers as a lower strength on the oscillator but moved higher on the price chart. By setting up levels at the 70% and 30% mark the oscillator can also be used for trading overbought/oversold levels similar to a Stochastic or RSI. As is the rule with most indicators, a smaller period gives more leading signals and a larger period gives less false signals.
Directional Movement Oscillator (DMI)The DMI Oscillator is a technical indicator which uses values of DMI in order to predict miscellaneous sides of market behavior.
Two components of DMI are used in calculation: DI+ and DI-; the DMI oscillator calculates the difference between these components and represents it as both a line and a histogram.
According to the rules described by Barbara Star in her article "The DMI Stochastic", the following market conditions can be predicted:
When the oscillator is positive and decreasing, a consolidation or pullback might take place. When price is in uptrend and the oscillator is positive but makes lower highs, a bearish divergence might be identified.
Conversely, when price is in downtrend and the oscillator is negative but keeps moving up, a bullish divergence might take place.
Trend continuation might be identified when the oscillator moves to the zero line and then rebounds from it.
In quiet markets, oscillator values fluctuating near the zero line (approx. -10 to +10 range) might signify sideways or rangebound price action.

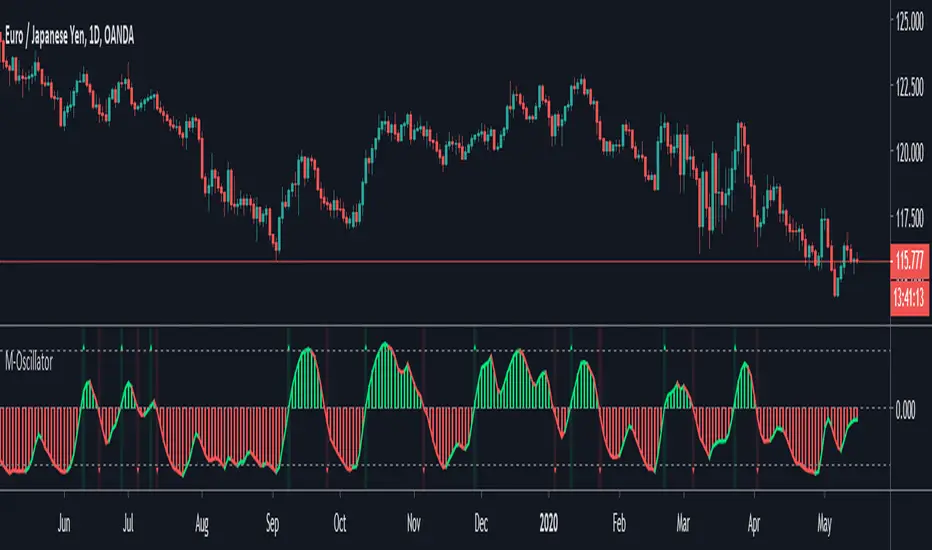
M-OscillatorM-Oscillator developed By Mohamed Fawzy, MFTA, CFTe
as Written in IFTA Journal 2018 Edition
more info : ifta.org
Interpretation
• M-Oscillator is a bounded oscillator that moves between (-14) and (+14),
• Movement above 10 is considered overbought, and movement below -10 is oversold.
Overbought/Oversold rule:
• Buy when the M-Oscillator violates the (-10) level to the downside and crosses back to the upside.
• Sell when the M-Oscillator crosses above the (+10) level and crosses back to the downside.
Crossover on Extreme Levels
• Sell signals are triggered when the M-Oscillator crosses its signal line above (13), which indicates an extreme market condition
• Buy signals are triggered when the M-Oscillator crosses its signal line below (- 13)
Combo Backtest 123 Reversal & Chande Forecast Oscillator This is combo strategies for get a cumulative signal.
First strategy
This System was created from the Book "How I Tripled My Money In The
Futures Market" by Ulf Jensen, Page 183. This is reverse type of strategies.
The strategy buys at market, if close price is higher than the previous close
during 2 days and the meaning of 9-days Stochastic Slow Oscillator is lower than 50.
The strategy sells at market, if close price is lower than the previous close price
during 2 days and the meaning of 9-days Stochastic Fast Oscillator is higher than 50.
Second strategy
The Chande Forecast Oscillator developed by Tushar Chande The Forecast
Oscillator plots the percentage difference between the closing price and
the n-period linear regression forecasted price. The oscillator is above
zero when the forecast price is greater than the closing price and less
than zero if it is below.
WARNING:
- For purpose educate only
- This script to change bars colors.
Combo Strategy 123 Reversal & Chande Forecast Oscillator This is combo strategies for get a cumulative signal.
First strategy
This System was created from the Book "How I Tripled My Money In The
Futures Market" by Ulf Jensen, Page 183. This is reverse type of strategies.
The strategy buys at market, if close price is higher than the previous close
during 2 days and the meaning of 9-days Stochastic Slow Oscillator is lower than 50.
The strategy sells at market, if close price is lower than the previous close price
during 2 days and the meaning of 9-days Stochastic Fast Oscillator is higher than 50.
Second strategy
The Chande Forecast Oscillator developed by Tushar Chande The Forecast
Oscillator plots the percentage difference between the closing price and
the n-period linear regression forecasted price. The oscillator is above
zero when the forecast price is greater than the closing price and less
than zero if it is below.
WARNING:
- For purpose educate only
- This script to change bars colors.

Normalized Accumulation/Distribution OscillatorThis is the oscillator version of the Accumulation/Distribution volume indicator. The oscillator is normalized by n-period volume moving sum. The value oscillates between 1 and -1. One way to use this oscillator is to identify the divergence between price and oscillator reading in trending market, and to spot potential reversal.

Combo Backtest 123 Reversal and Absolute Price Oscillator (APO) This is combo strategies for get
a cumulative signal. Result signal will return 1 if two strategies
is long, -1 if all strategies is short and 0 if signals of strategies is not equal.
First strategy
This System was created from the Book "How I Tripled My Money In The
Futures Market" by Ulf Jensen, Page 183. This is reverse type of strategies.
The strategy buys at market, if close price is higher than the previous close
during 2 days and the meaning of 9-days Stochastic Slow Oscillator is lower than 50.
The strategy sells at market, if close price is lower than the previous close price
during 2 days and the meaning of 9-days Stochastic Fast Oscillator is higher than 50.
Secon strategy
The Absolute Price Oscillator displays the difference between two exponential
moving averages of a security's price and is expressed as an absolute value.
How this indicator works
APO crossing above zero is considered bullish, while crossing below zero is bearish.
A positive indicator value indicates an upward movement, while negative readings
signal a downward trend.
Divergences form when a new high or low in price is not confirmed by the Absolute Price
Oscillator (APO). A bullish divergence forms when price make a lower low, but the APO
forms a higher low. This indicates less downward momentum that could foreshadow a bullish
reversal. A bearish divergence forms when price makes a higher high, but the APO forms a
lower high. This shows less upward momentum that could foreshadow a bearish reversal.
WARNING:
- For purpose educate only
- This script to change bars colors.

Combo Strategies 123 Reversal and Absolute Price Oscillator This is combo strategies for get
a cumulative signal. Result signal will return 1 if two strategies
is long, -1 if all strategies is short and 0 if signals of strategies is not equal.
First strategy
This System was created from the Book "How I Tripled My Money In The
Futures Market" by Ulf Jensen, Page 183. This is reverse type of strategies.
The strategy buys at market, if close price is higher than the previous close
during 2 days and the meaning of 9-days Stochastic Slow Oscillator is lower than 50.
The strategy sells at market, if close price is lower than the previous close price
during 2 days and the meaning of 9-days Stochastic Fast Oscillator is higher than 50.
Secon strategy
The Absolute Price Oscillator displays the difference between two exponential
moving averages of a security's price and is expressed as an absolute value.
How this indicator works
APO crossing above zero is considered bullish, while crossing below zero is bearish.
A positive indicator value indicates an upward movement, while negative readings
signal a downward trend.
Divergences form when a new high or low in price is not confirmed by the Absolute Price
Oscillator (APO). A bullish divergence forms when price make a lower low, but the APO
forms a higher low. This indicates less downward momentum that could foreshadow a bullish
reversal. A bearish divergence forms when price makes a higher high, but the APO forms a
lower high. This shows less upward momentum that could foreshadow a bearish reversal.
WARNING:
- This script to change bars colors.

Percentage Price OscillatorThe Percentage Price Oscillator (PPO) is a momentum oscillator that measures the difference between two moving averages as a percentage of the larger moving average. As with its cousin, MACD, the Percentage Price Oscillator is shown with a signal line, a histogram and a center line. Signals are generated with signal line crossovers, center line crossovers, and divergences. More info here and here .
The indicator allows you to change the type of all moving averages (Simple, Exponential, Weighted, Volume-weighted, Triple EMA or a moving average that uses RSI ). The indicator also allows you to volume weight it(turned on by default), which will turn it into an indicator very similar to the Volume-Weighted Moving Average Convergence Divergence (VW-MACD) first used by Buff Pelz Dormeier in 2002 and described in detail in his book "Investing with Volume Analysis: Identify, Follow, and Profit from Trends". If you want to weight the oscillator against the true range instead of volume this is also possible. By default, this will be done automatically for assets that do not support volume. By checking the box "MACD" you can also turn this indicator into a standard MACD indicator.
Percentage Price Oscillator (PPO)The Percentage Price Oscillator (PPO) is a momentum oscillator that measures the difference between two moving averages as a percentage of the larger moving average. As with its cousin, MACD, the Percentage Price Oscillator is shown with a signal line, a histogram and a centerline. Signals are generated with signal line crossovers, centerline crossovers, and divergences. First, PPO readings are not subject to the price level of the security. Second, PPO readings for different securities can be compared, even when there are large differences in the price.
Calculations
PPO: {(12-day EMA - 26-day EMA)/26-day EMA} x 100
Signal Line: 9-day EMA of PPO
PPO Histogram: PPO - Signal Line
While MACD measures the absolute difference between two moving averages, PPO makes this a relative value by dividing the difference by the slower moving average (26-day EMA). PPO is simply the MACD value divided by the longer moving average. The result is multiplied by 100 to move the decimal place two spots.
Interpretation
As with MACD, the PPO reflects the convergence and divergence of two moving averages. PPO is positive when the shorter moving average is above the longer moving average. The indicator moves further into positive territory as the shorter moving average distances itself from the longer moving average. This reflects strong upside momentum. The PPO is negative when the shorter moving average is below the longer moving average. Negative readings grow when the shorter moving average distances itself from the longer moving average (goes further negative). This reflects strong downside momentum. The histogram represents the difference between PPO and its 9-day EMA, the signal line. The histogram is positive when PPO is above its 9-day EMA and negative when PPO is below its 9-day EMA. The PPO-Histogram can be used to anticipate signal line crossovers in the PPO.
MACD, PPO and Price
MACD levels are affected by the price of a security. A high-priced security will have higher or lower MACD values than a low-priced security, even if volatility is basically equal. This is because MACD is based on the absolute difference in the two moving averages. Because MACD is based on absolute levels, large price changes can affect MACD levels over an extended period of time. If a stock advances from 20 to 100, its MACD levels will be considerably smaller around 20 than around 100. The PPO solves this problem by showing MACD values in percentage terms.
Conclusions
The Percentage Price Oscillator (PPO) generates the same signals as the MACD, but provides an added dimension as a percentage version of MACD. The PPO levels of the Dow Industrials (price > 20K) can be compared against the PPO levels of IBM (price < 200) because the PPO “levels” the playing field. In addition, PPO levels in one security can be compared over extended periods of time, even if the price has doubled or tripled. This is not the case for the MACD.
Limitations
Despite its advantages, the PPO is still not the best oscillator to identify overbought or oversold conditions because movements are unlimited (in theory). Levels for RSI and the Stochastic Oscillator are limited and this makes them better suited to identify overbought and oversold levels.
Source: Stockcharts

NG [Simple Harmonic Oscillator]The SHO is a bounded oscillator for the simple harmonic index that calculates the period of the market’s cycle.
The oscillator is used for short and intermediate terms and moves within a range of -100 to 100 percent.
The SHO has overbought and oversold levels at +40 and -40, respectively.
At extreme periods, the oscillator may reach the levels of +60 and -60.
The zero level demonstrates an equilibrium between the periods of bulls and bears.
The SHO oscillates between +40 and -40.
The crossover at those levels creates buy and sell signals.
In an uptrend, the SHO fluctuates between 0 and +40 where the bulls are controlling the market.
On the contrary, the SHO fluctuates between 0 and -40 during downtrends where the bears controlthe market.
Reaching the extreme level -60 in an uptrend is a sign of weakness.

Short-Term Capitulation Oscillator (STCO, Diodato 2019)Description:
This script is a faithful implementation of the Short-Term Capitulation Oscillator (STCO) from Chris Diodato's 2019 CMT paper, "Making The Most Of Panic". It's a tactical breadth and volume oscillator designed to "fish for market bottoms" by identifying short-term investor capitulation.
What It Is
The STCO combines the 10-day moving averages of NYSE up-volume and advancing issues. It measures the ratio of advancing momentum (in both volume and number of issues) relative to the total traded momentum. The result is a raw, un-normalized oscillator that typically ranges from 0 to 200.
How to Interpret
The STCO is a tactical tool for identifying near-term oversold conditions and potential bounces.
Low Readings: Indicate that sellers have likely exhausted themselves in the short term, creating a potential entry point for a bounce. The paper found that readings below 90, 85, and 80 were often followed by strong market performance over the next 5-20 days.
Overbought/Oversold Lines: Use the customizable overbought/oversold lines to define your own capitulation zones and potential entry areas.
Settings
Data Sources: Allows toggling the use of "Unchanged" issues/volume data.
Thresholds: You can set the overbought and oversold levels based on the paper's research or your own testing.

Long-Term Capitulation Oscillator (LTCO, Diodato 2019)Description:
This script is a faithful implementation of the Long-Term Capitulation Oscillator (LTCO) from Chris Diodato's award-winning 2019 CMT paper, "Making The Most Of Panic". It is a strategic, market-wide breadth and volume oscillator designed to identify major, long-term market bottoms.
What It Is
The LTCO combines long-term moving averages (34, 55, 89, 144, and 233-day) of NYSE advancing/declining issues and up/down volume. It uses a unique "average of averages" method to create a responsive yet strategic long-term indicator. This script plots the raw, un-normalized value as described in the paper, which typically oscillates in the 700-1100 range.
How to Interpret
The LTCO is a strategic tool for identifying potentially significant market turning points.
Extremely Low Readings: Suggest that a long-term period of selling has reached a point of exhaustion, potentially marking a major bear market low or a generational buying opportunity. The paper backtested various thresholds, with values below 950, 925, and especially 875 showing historically strong forward returns over the next 6-24 months.
Overbought/Oversold Lines: The script includes customizable overbought/oversold lines to help you visually identify these critical zones.
Settings
Data Sources: Allows toggling the use of "Unchanged" issues/volume data for the calculation.
Thresholds: You can set the overbought and oversold levels to your preference, based on the paper's findings or your own research.
