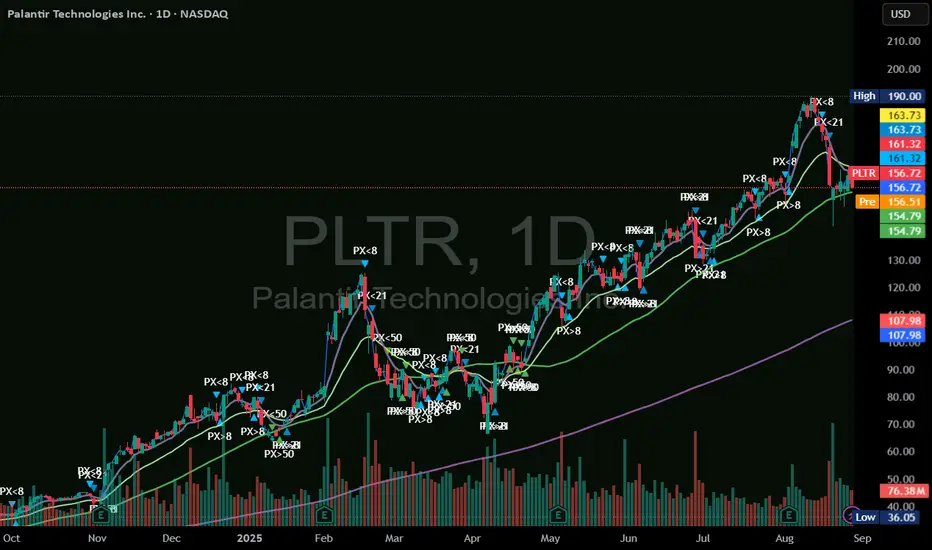
Pullback Entry Alert (8ema/21ema/50ma/200ma)8ema, 21ema, 50MA, and 200MA alert for pullback buy entries
Tìm kiếm tập lệnh với "pullback"
Pullback Historical DataIndicator Description: Dados-historico-Pullback
This indicator identifies pivot points (local support and resistance levels) on the chart based on a user-defined period. It calculates the difference between the last found resistance and support levels, displaying this current difference as well as its historical maximum and minimum values.
How to use:
Pivot Period:
Adjust the "Pivot Period" parameter to define how many bars before and after the indicator should look for a pivot point (high or low).
A higher value makes the pivot more conservative, finding stronger and more spaced pivots.
A lower value detects more frequent pivots, sensitive to quick market moves.
Label and Text Color:
You can customize the background color of the label and the text color for better visibility on the chart.
Label Size:
The indicator offers four label sizes:
XS (Extra Small): small label to save space.
S (Small): compact and readable size.
M (Medium): default size, a balance between readability and space.
L (Large): bigger label for more emphasis.
If you choose an invalid value, the default M (Medium) size will be used automatically.
Example to adjust the Pivot Period:
Setting the Pivot Period to 3 means the indicator will look for pivots within 3 bars before and after each point. This produces many pivots, including smaller ones and noise. It’s useful for fast trades or scalping.
Setting it to 10 means the indicator looks for pivots farther apart, producing fewer signals but more significant ones, suitable for more conservative analysis.
I recommend starting with a middle value like 5 and testing how the indicator behaves on your chart. Then adjust up or down depending on your trading style and timeframe.

Pullback SP-Strategy#9This is my interpretation of Steven Primo's pull back strategy indicator # 9. Seems to work on any time frame or combination high and low. I prefer to use it with the regular fractals and a 20 or 50 SMA and 5 period RSI. I would prefer to have it only paint up arrows when bars close above the SMA and vise versa with down arrows. If someone can help me correct that please contact me.
Thanks, 1776er.

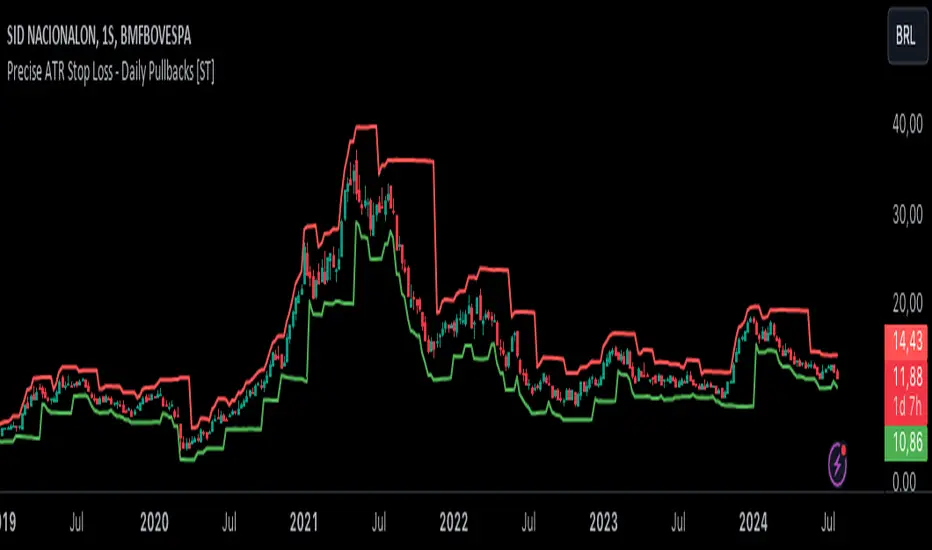
Precise ATR Stop Loss - Daily Pullbacks [ST]Precise ATR Stop Loss - Daily Pullbacks
This indicator uses ATR (Average True Range) combined with the identification of pullback lows and highs on daily charts to calculate more precise stop loss levels.
How it works:
Identification of Pullbacks:
Pullback Lows: Identifies significant low points on daily charts that can serve as support.
Pullback Highs: Identifies significant high points on daily charts that can serve as resistance.
ATR (Average True Range):
Measures market volatility and is used to adjust stop loss levels according to market conditions.
Dynamic Stop Loss:
Stop Loss for Uptrend:
When a pullback low is identified on a daily chart, the stop loss is set slightly below this point, adjusted by the ATR.
This level is shown by a green line on the chart.
Stop Loss for Downtrend:
When a pullback high is identified on a daily chart, the stop loss is set slightly above this point, adjusted by the ATR.
This level is shown by a red line on the chart.
Indicator Benefits:
Improved Precision: Uses significant pullback points on daily charts to set stops more accurately.
Dynamic Stop Loss:
Automatically adjusts stop loss levels according to market volatility, providing more effective risk management.
Título: Precise ATR Stop Loss - Daily Pullbacks
Descrição em Português:
Este indicador utiliza o ATR (Average True Range) combinado com a identificação de fundos e topos de pullback em gráficos diários para calcular níveis de stop loss mais precisos.
Como funciona:
Identificação de Pullbacks:
Fundos de Pullback: Identifica pontos de mínima significativos em gráficos diários que podem servir como suporte.
Topos de Pullback: Identifica pontos de máxima significativos em gráficos diários que podem servir como resistência.
ATR (Average True Range):
Mede a volatilidade do mercado e é utilizado para ajustar os níveis de stop loss de acordo com as condições do mercado.
Stop Loss Dinâmico:
Stop Loss para Tendência de Alta: Quando um fundo de pullback é identificado em um gráfico diário, o stop loss é colocado um pouco abaixo desse ponto, ajustado pelo ATR. Este nível é mostrado por uma linha verde no gráfico.
Stop Loss para Tendência de Baixa: Quando um topo de pullback é identificado em um gráfico diário, o stop loss é colocado um pouco acima desse ponto, ajustado pelo ATR. Este nível é mostrado por uma linha vermelha no gráfico.
Benefícios do Indicador:
Precisão Melhorada: Utiliza pontos de pullback significativos em gráficos diários para posicionar stops de forma mais precisa.
Stop Loss Dinâmico: Ajusta automaticamente os níveis de stop loss de acordo com a volatilidade do mercado, proporcionando uma gestão de risco mais eficaz.
Market Crashes/Chart Timeframes HighlightThis extremely helpful indicator allows you to highlight 7 custom date-based timeframes on your charts.
The default dates selected are what I consider to be the most significant 7 most recent market declines, including and since the 87 flash crash.
Note: The default dates are approximate but good enough to highlight the key timeframes of these pullbacks/crashes/corrections.
It's simple to use and does exactly what it should.
I created this indicator to make it easier when looking at the overall story of a chart. I found it helpful to highlight these areas to see how a market or equity has responded during these significant market pullbacks.
The highlight alone I’ve found helpful, and it becomes more powerful if you combine it with your own trusted trade system.
Also, to get the most out of using the default dates it’s important to understand the narrative behind each pullback/crash. Here’s the list of what I consider significant pullbacks:
Black Monday - Oct 87
1990s Recession - Jul 90 to Mar 91
Dot Com Bubble - 2000 to 2002 or so
Real Estate 2008 Crisis - I choose 2007-2009 to cover full insider knowledge and aftermath
2016 - 2018 - This isn't seen as a pullback, but I have it as significant because in many markets and equities, this was an almost equal percentage pullback as 2008. See Notes below
2020 Crash - Covid-19 and related shenanigans pullback
April 2021 to August 2022 - I believe we are in a current SHORT cycle so I've highlighted April 2021 as the start of what might be the start of a major decline testing Dot Com or lower levels.
A few notes on the above.
You'll find on most of the pullbacks listed above most equities and related markets behave similarly or have similar patterns.
The 2016-18 pullback is the most difficult to track. For instance, GE in this timeframe had a -80% decline, whereas BA depending on how you want to measure it had a 50-110% gain.

Complete Trend Trading System [Fhenry0331]This system was designed for the beginner trader to make money swing trading. Your losses will be small and your gains will be mostly large. You will show consistent profit. Period.
The system works on any security you like to trade. I used GBPUSD as an example because of the up swing and down swing it had recently. I tried to put as much information of how the system works in the chart. Hope it helps and is not to cluttered.
I will reiterate how the system works here: Everything is based off of closed price.
Legend
Uptrend: Buy
Green bar: initial start of an uptrend or uptrend continuing. Place order above that bar. If the initial bar does not stray too far from the MVWAP , I will place orders above subsequent bars if no filled occurred.
If initial start of the trend is missed, I will wait for the pullback. A pullback is a close below the MVWAP, and a close above the EMA (Low), RSI is above 50. Orders are placed above the pullback bars with plotted char "B" and also plotted green triangle up. Again orders are placed above those bars. the bars do not notate automatic buys. Don't chase anything. You will miss the initial bar on something because of news or earnings and it rocket up. Just wait, it will pullback. If it doesn't, to hell with it, on to the next.
Take profits: In the indicator you will see "T." That notates to take some profits. It is a suggestion. I was always told to take profits into spikes, as well as you can never lose money if you take profits. Up to you if you want to scale out and take the suggested profits or not.
Exit Completely: In an uptrend, close your entire position on bars colored yellow or red. (Again, closed bars)
In uptrend bars colored orange and black, do nothing, they are just pullback bars. Look for the buy pullback signal, then follow pullback buy rules for an uptrend.
Downtrend: Short
Red bar: initial start of a downtrend or downtrend continuing. Place order below the bar. If the initial bar does not stray too far fro the MVWAP, place orders below subsequent bars.
If initial start on the downtrend is missed, wait for the pullback. A pullback is a close above the MVWAP, and close below the EMA(Low). RSI is below 50. Orders are placed below the pullback bars with the plotted char "S" and also plotted red triangle. Again those bars are not automatic shorts, orders are placed below them. Don't chase anything. Wait for price to come into your plan. The idea FOMO is the stupidest thing ever, how can you miss out on something when it is always there. The market is always there and something will come into your zone. Chill.
"T": same as in uptrend, suggestion to take some profits.
Exit Completely: In a downtrend, close your entire position on bars colored orange or green.
In downtrend you will see bars colored yellow and black, do nothing, they are pullback bars. Look for the pullback short signal and follow pullback short rules.
If you have any questions get at me. Take a look at it on what you trade. Flip it through different securities.
Best of luck in all you do.
P.S. You should not take a trade right before earnings. You should also exit a trade right before earnings.

Micro Pullback Entry SystemMicro Pullback Entry System - Quick Reference
The Pattern
▲ ENTRY (first green to break high)
│
┌──┴───┐
│ 1-3 │ ← PULLBACK (red candles)
│ red │ Stop = Low of this zone
└──────┘
│
┌──┴───┐
│ 3+ │ ← THE MOVE (green candles)
│green │ Strong momentum
└──────┘
Pattern Checklist
Requirement: Why It Matters
3+ green candlesConfirms momentum
1-3 red pullback Brief = momentum intact< 50% retracementShallow = buyers in controlVolume on entryConfirms breakout Above EMA Trend support
Status Flow
Scanning... → 📈 TRENDING → 👀 WATCHING → ⏳ FORMING → 🎯 ENTRY!
StatusMeaningActionScanningLooking for setupWait📈 TRENDINGGreen streak buildingMonitor👀 WATCHINGPullback startedPrepare⏳ FORMINGValid pullback readyGet ready!🎯 ENTRY!Signal triggeredExecute
Entry/Stop/Target
LevelLine ColorHow to SetEntryLime solidClose of signal candleStopRed dashedLow of pullbackTarget 1Aqua dottedEntry + (2 × Risk)Target 2Yellow dottedEntry + (3 × Risk)
Example
Entry: $5.00
Stop: $4.80
Risk: $0.20
Target 1 (2R): $5.00 + $0.40 = $5.40
Target 2 (3R): $5.00 + $0.60 = $5.60
Quality Grades
GradeScoreActionA+5/5 ✓Best setup - full sizeA4/5 ✓Good setup - standard sizeB3/5 ✓Average - reduced sizeC2/5 ✓Weak - skip or tiny size
Scoring Factors
✓ Green streak met minimum
✓ Pullback length valid (1-3)
✓ Retracement shallow (<50%)
✓ Volume confirmed
✓ Above EMA
Trade Execution
Entry
Wait for "⏳ FORMING" status
Watch for green candle forming
Entry triggers when green candle closes above pullback high
Enter at market or small limit above current price
Stop Loss
Set at pullback low (red dashed line)
Non-negotiable - this is your max risk
Trade Management
If no immediate follow-through → exit early
Take 50% off at Target 1 (aqua line)
Move stop to breakeven
Let remainder run to Target 2
Settings Guide
Default (Recommended)
Min Green Candles: 3
Min Pullback: 1
Max Pullback: 3
Max Retracement: 50%
Volume Multiplier: 1.2x
EMA Filter: ON (20)
Conservative (Fewer, Better)
Min Green Candles: 4
Min Pullback: 2
Max Pullback: 3
Max Retracement: 40%
Volume Multiplier: 1.5x
EMA Filter: ON (20)
Aggressive (More Signals)
Min Green Candles: 2
Min Pullback: 1
Max Pullback: 4
Max Retracement: 60%
Volume Multiplier: 1.0x
EMA Filter: OFF
Common Mistakes
❌ Entering before signal
Wait for green triangle
"FORMING" ≠ "ENTRY"
❌ Wide stop
Stop must be at pullback low
If too wide, skip the trade
❌ Ignoring volume
Low volume entries fail more often
Look for ✓ in volume row
❌ Fighting trend
Check EMA status
Should show "Above ✓"
❌ Chasing after entry
If you miss entry by 3+ candles, wait for next setup
Don't chase extended moves
Best Setups
A+ Quality Setup ✓
4-5 green candles (strong move)
2 candle pullback (brief)
25-35% retracement (shallow)
2x+ volume on entry
Well above EMA
Stock already up 5%+ on day
Avoid These ✗
Only 2 green candles
4+ candle pullback (losing momentum)
50%+ retracement (too deep)
Below average volume
Below or at EMA
Against market direction
Timeframe Guide
TFSignalsQualityBest For1mMostLowerScalping5mBalancedGoodDay trading15mFewestHigherSwing entries
Quick Decision Tree
1. Status showing "FORMING"?
NO → Wait
YES → Continue
2. Quality grade A or better?
NO → Skip or small size
YES → Continue
3. Volume confirmed (✓)?
NO → Caution, reduce size
YES → Continue
4. Above EMA (✓)?
NO → Skip
YES → Continue
5. Risk acceptable? (Stop not too wide)
NO → Skip
YES → TAKE THE TRADE
Alert Setup
Essential Alert
"Micro Pullback Entry" - Main signal
How to Set
Right-click chart → Add Alert
Condition: Micro Pullback Entry System
Select "Micro Pullback Entry"
Set notification preferences
Combining with Other Indicators
IndicatorHow to Use5 PillarsFind stocks meeting criteria firstGap & GoLook for micro pullbacks after gap breakoutsR2G TrackerConfirm stock is green before enteringFloat RotationHigh rotation + micro pullback = best setupsBull FlagMicro pullback is a "mini" bull flag
Example Trade
Stock: XYZ
Pre-market: Gapped up 15%
9:35 - 9:38: 4 green candles (move from $4.50 to $5.00)
9:39 - 9:40: 2 red candles (pullback to $4.85)
9:41: Green candle breaks $4.90 (pullback high)
ENTRY: $4.92
STOP: $4.82 (pullback low)
RISK: $0.10
TARGET 1: $5.12 (+$0.20 = 2R)
TARGET 2: $5.22 (+$0.30 = 3R)
Result: Hit Target 2 by 9:55 → +$0.30 per share
Key Takeaways
Micro = 1-3 candles - Brief pullback
Entry = First green to break high - Specific trigger
Stop = Pullback low - Tight risk
Quality matters - Focus on A/A+ setups
Breakout or bailout - Exit if no follow-through

Simple TrenderOriginates from:
I was reading some Impulse Trading literature by A. Elder.. In it, someone named Kerry Lovvorn proposed "An End of Day Trend Following System" for someone lazy.
Originally it is just price closing above an 8 ema (low) for long. Exit when price closes below an 8 ema (low). The opposite for a short position.
Conditions: Buy when price closed below ema (low) for two bars or more, then closes above. Opposite for a short position. I do not follow this condition. Though it may help with whipsaw.
My condition is when price closes above the 26 ema (low) (works the best for me) I place orders above the initial crossing bars high. Opposite for lows.
I look for stocks that are low in price to go long on. I want the run from 2's to 15's
I look for stocks that are mid-teens/20's in price to go short on. I want the run from 20's to 2's
I look for stock with news and earnings that are already running (up or down) to play the pullback.
These conditions can easily be scanned for on thinkorswim
From first glance, the system looks like CMsling shotsystem. Although, I plagiarized some parts of the codes, because I am inept when it comes to that shit, it differs as it is not a moving average crossover system.
It is a price crossing over concept. A moving average VWAP is used for best entries on pullbacks.
Purpose:
--To catch the majority of a trend/wave/run.
--To identify pullback areas to go long or short while in midst of trend. To catch pullbacks off news and earning runners.
--To catch the initial start of trend with clear rules to enter
--Clear rules to exit
Issues
--possibilities of getting ninja sliced the fuck up. Can be mitigated by entering stocks with decent average volume. And also only going long above 200 ema and short below it. ADX won't work, at the initial start of the trend it will show not trending. Can look at blow off volume at the bottom followed by increase in buying for long and vice versa for short.
--Can give some huge gains away through gap ups or gap downs from news or earnings during trend. However, can get huge gain on gaps from news or earning. Nature of the game.
--Need some brass balls and a supply of pepto to stomach through some of the pullbacks. Gut wrenching seeing big gains dwindle. But they all even out at the end, you hope. (see NBEV and IGC, and CRON and others. shit don't go in straight lines, homie)
Pros
--It's simple and easy. Overall, you profit
--works with any security
Cons
--It can be stressful.
--does not work well on lower time frames. Do not recommend going below 15 minutes
--Possibility of working on 5 minutes with a time frame breakout strategy (15,30 min).
Couple it with LazyBear "Weis Wave Volume" indicator. Works well for pullback entries.
Enjoy. Ride some waves.

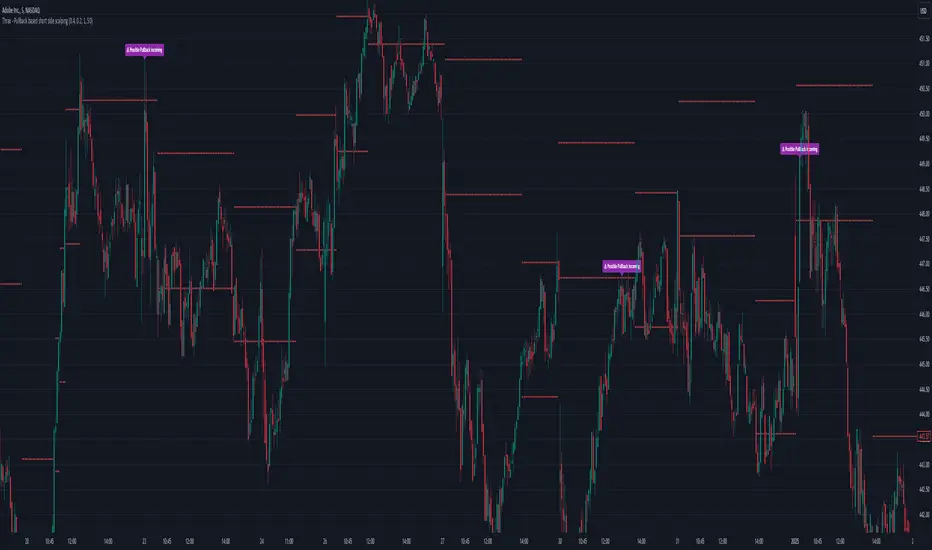
Thrax - Pullback based short side scalping⯁ This indicator is built for short trades only.
⤞ Pullback based scalping is a strategy where a trader anticipates a pullback and makes a quick scalp in this pullback. This strategy usually works in a ranging market as probability of pullbacks occurrence in ranging market is quite high.
⤞ The strategy is built by first determining a possible candidate price levels having high chance of pullbacks. This is determined by finding out multiple rejection point and creating a zone around this price. A rejection is considered to be valid only if it comes to this zone after going down by a minimum pullback percentage. Once the price has gone down by this minimum pullback percentage multiple times and reaches the zone again chances of pullback goes high and an indication on chart for the same is given.
⯁ Inputs
⤞ Zone-Top : This input parameter determines the upper range for the price zone.
⤞ Zone bottom : This input parameter determines the lower range for price zone.
⤞ Minimum Pullback : This input parameter determines the minimum pullback percentage required for valid rejection. Below is the recommended settings
⤞ Lookback : lookback period before resetting all the variables
⬦Below is the recommended settings across timeframes
⤞ 15-min : lookback – 24, Pullback – 2, Zone Top Size %– 0.4, Zone Bottom Size % – 0.2
⤞ 5-min : lookback – 50, pullback – 1% - 1.5%, Zone Top Size %– 0.4, Zone Bottom Size % – 0.2
⤞ 1-min : lookback – 100, pullback – 1%, Zone Top Size %– 0.4, Zone Bottom Size % – 0.2
⤞ Anything > 30-min : lookback – 11, pullback – 3%, Zone Top Size %– 0.4, Zone Bottom Size % – 0.2
✵ This indicator gives early pullback detection which can be used in below ways
1. To take short trades in the pullback.
2. To use this to exit an existing position in the next few candles as pullback may be incoming.
📌 Kindly note, it’s not necessary that pullback will happen at the exact point given on the chart. Instead, the indictor gives you early signals for the pullback
⯁ Trade Steup
1. Wait for pullback signal to occur on the chart.
2. Once the pullback warning has been displayed on the chart, you can either straight away enter the short position or wait for next 2-4 candles for initial sign of actual pullback to occurrence.
3. Once you have initiated short trade, since this is pullback-based strategy, a quick scalp should be made and closed as price may resume it’s original direction. If you have risk appetite you can stay in the trade longer and trial the stops if price keeps pulling back.
4. You can zone top as your stop, usually zone top + some% should be used as stop where ‘some %’ is based on your risk appetite.
5. It’s important to note that this indicator gives early sings of pullback so you may actually wait for 2-3 candles post ‘Pullback warning’ occurs on the chart before entering short trade.
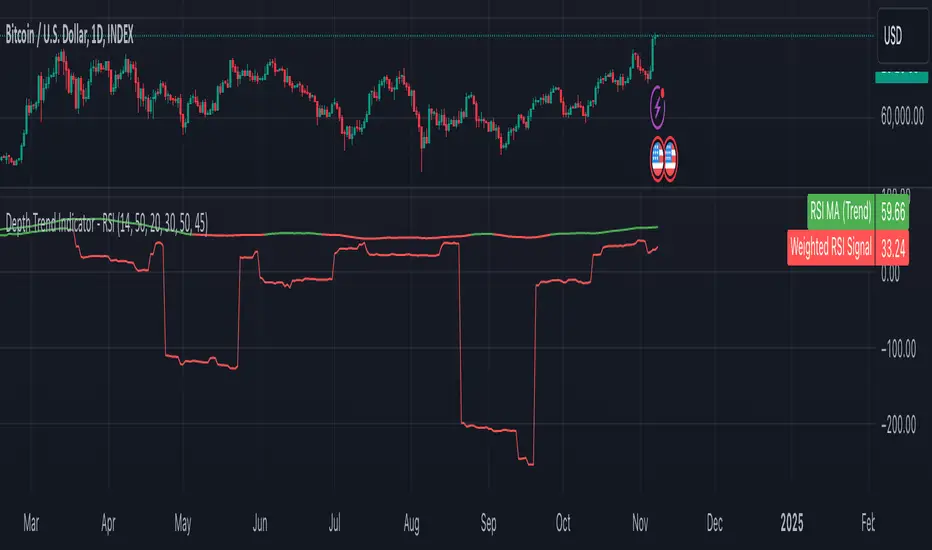
Depth Trend Indicator - RSIDepth Trend Indicator - RSI
This indicator is designed to identify trends and gauge pullback strength by combining the power of RSI and moving averages with a depth-weighted calculation. The script was created by me, Nathan Farmer and is based on a multi-step process to determine trend strength and direction, adjusted by a "depth" factor for more accurate signal analysis.
How It Works
Trend Definition Using RSI: The RSI Moving Average ( rsiMa ) is calculated to assess the current trend, using customizable parameters for the RSI Period and MA Period .
Trends are defined as follows:
Uptrend : RSI MA > Critical RSI Value
Downtrend : RSI MA < Critical RSI Value
Pullback Depth Calculation: To measure pullback strength relative to the current trend, the indicator calculates a Depth Percentage . This is defined as the portion of the gap between the moving average and the price covered by a pullback.
Depth-Weighted RSI Calculation: The Depth Percentage is then applied as a weighting factor on the RSI Moving Average , giving us a Weighted RSI line that adjusts to the depth of pullbacks. This line is rather noisy, and as such we take a moving average to smooth out some of the noise.
Key Parameters
RSI Period : The period for RSI calculation.
MA Period : The moving average period applied to RSI.
Price MA Period : Determines the SMA period for price, used to calculate pullback depth.
Smoothing Length : Length of smoothing applied to the weighted RSI, creating a more stable signal.
RSI Critical Value : The critical value (level) used in determining whether we're in an uptrend or a downtrend.
Depth Critical Value : The critical value (level) used in determining whether or not the depth weighted value confirms the state of a trend.
Notes:
As always, backtest this indicator and modify the parameters as needed for your specific asset, over your specific timeframe. I chose these defaults as they worked well on the assets I look at, but it is likely you tend to look at a different group of assets over a different timeframe than what I do.
Large pullbacks can create large downward spikes in the weighted line. This isn't graphically pleasing, but I have tested it with various methods of normalization and smoothing and found the simple smoothing used in the indicator to be best despite this.
Push Up Pullback BuyThe Push Up Pullback Buy (PUPB) indicator is designed to identify trend continuation opportunities by detecting key market movements:
Push-Ups: Rapid upward price movements exceeding a customizable minimum change.
Pullbacks: Temporary price corrections following a push-up.
Trend Confirmation: Validates higher highs and higher lows during pullbacks to ensure trend continuation.
Multi-Timeframe Analysis: Incorporates lower timeframe breakout confirmation for enhanced precision.
This indicator provides visual cues (arrows and signals) directly on your chart, making it intuitive for traders to spot potential buy opportunities. Ideal for trend-following strategies and traders looking to capitalize on pullback entries in bullish markets.
Customizable parameters allow you to adapt the indicator to your preferred trading style and instruments.

Multi Fibonacci Supertrend with Signals【FIbonacciFlux】Multi Fibonacci Supertrend with Signals (MFSS)
Overview
The Multi Fibonacci Supertrend with Signals (MFSS) is an advanced technical analysis tool that combines multiple Supertrend indicators using Fibonacci ratios to identify trend directions and potential trading opportunities.
Key Features
1. Fibonacci-Based Supertrend Levels
* Factor 1 (Weak) : 0.618 - The golden ratio
* Factor 2 (Medium) : 1.618 - The Fibonacci ratio
* Factor 3 (Strong) : 2.618 - The extension ratio
2. Visual Components
* Multi-layered Trend Lines
* Different line weights for easy identification
* Progressive transparency from Factor 1 to Factor 3
* Color-coded trend directions (Green for bullish, Red for bearish)
* Dynamic Fill Areas
* Gradient fills between price and trend lines
* Visual representation of trend strength
* Automatic color adjustment based on trend direction
* Signal Indicators
* Clear BUY/SELL labels on chart
* Position-adaptive signal placement
* High-visibility color scheme
3. Signal Generation Logic
The system generates signals based on two key conditions:
* Primary Condition :
* BUY : Price crossunder Supertrend2 (Factor 1.618)
* SELL : Price crossover Supertrend2 (Factor 1.618)
* Confirmation Filter :
* Signals only trigger when Supertrend3 confirms the trend direction
* Reduces false signals in volatile markets
Technical Details
Input Parameters
* ATR Period : 10 (default)
* Customizable for different market conditions
* Affects sensitivity of all Supertrend levels
* Factor Settings :
* All factors are customizable
* Default values based on Fibonacci sequence
* Minimum value: 0.01
* Step size: 0.01
Alert System
* Built-in alert conditions
* Customizable alert messages
* Real-time notification support
Use Cases
* Trend Trading
* Identify strong trend directions
* Filter out weak signals
* Confirm trend continuations
* Risk Management
* Multiple trend levels for stop-loss placement
* Clear entry and exit signals
* Trend strength visualization
* Market Analysis
* Multi-timeframe analysis capability
* Trend strength assessment
* Market structure identification
Benefits
* Reliability
* Based on proven Supertrend algorithm
* Enhanced with Fibonacci mathematics
* Multiple confirmation levels
* Clarity
* Clear visual signals
* Easy-to-interpret interface
* Reduced noise in signal generation
* Flexibility
* Customizable parameters
* Adaptable to different markets
* Suitable for various trading styles
Performance Considerations
* Optimized code structure
* Efficient calculation methods
* Minimal resource usage
Installation and Usage
Setup
* Add indicator to chart
* Adjust parameters if needed
* Enable alerts as required
Best Practices
* Use with other confirmation tools
* Adjust factors based on market volatility
* Consider timeframe appropriateness
Backtesting Results and Strategy Performance
This indicator is specifically designed for pullback trading with optimized risk-reward ratios in trend-following strategies. Below are the detailed backtesting results from our proprietary strategy implementation:
BTCUSDT Performance (Binance)
* Test Period: Approximately 7 years
* Risk-Reward Ratio: 2:1
* Take Profit: 8%
* Stop Loss: 4%
Key Metrics (BTCUSDT):
* Net Profit: +2,579%
* Total Trades: 551
* Win Rate: 44.8%
* Profit Factor: 1.278
* Maximum Drawdown: 42.86%
ETHUSD Performance (Binance)
* Risk-Reward Ratio: 4.33:1
* Take Profit: 13%
* Stop Loss: 3%
Key Metrics (ETHUSD):
* Net Profit: +8,563%
* Total Trades: 581
* Win Rate: 32%
* Profit Factor: 1.32
* Maximum Drawdown: 55%
Strategy Highlights:
* Optimized for pullback trading in strong trends
* Focus on high risk-reward ratios
* Proven effectiveness in major cryptocurrency pairs
* Consistent performance across different market conditions
* Robust profit factor despite moderate win rates
Note: These results are from our proprietary strategy implementation and should be used as reference only. Individual results may vary based on market conditions and implementation.
Important Considerations:
* The strategy demonstrates strong profitability despite lower win rates, emphasizing the importance of proper risk-reward ratios
* Higher drawdowns are compensated by significant overall returns
* The system shows adaptability across different cryptocurrencies with consistent profit factors
* Results suggest optimal performance in volatile crypto markets
Real Trading Examples
BTCUSDT 4-Hour Chart Analysis
Example of pullback strategy implementation on Bitcoin, showing clear trend definition and entry points
ETHUSDT 4-Hour Chart Analysis
Ethereum chart demonstrating effective signal generation during strong trends
BTCUSDT Detailed Signal Example (15-Minute Scalping)
Close-up view of signal generation and trend confirmation process on 15-minute timeframe, demonstrating the indicator's effectiveness for scalping operations
Chart Analysis Notes:
* Green and red zones clearly indicate trend direction
* Multiple timeframe confirmation visible through different Supertrend levels
* Clear entry signals during pullbacks in established trends
* Precise stop-loss placement opportunities below support levels
Implementation Guidelines:
* Wait for main trend confirmation from Factor 3 (2.618)
* Enter trades on pullbacks to Factor 2 (1.618)
* Use Factor 1 (0.618) for fine-tuning entry points
* Place stops below the relevant Supertrend level
Footnotes:
* Charts provided are from Binance exchange, using both 4-hour and 15-minute timeframes
* Trading view screenshots captured during actual market conditions
* Indicators shown: Multi Fibonacci Supertrend with all three factors
* Time period: Recent market activity showing various market conditions
Important Notice:
These charts are for educational purposes only. Past performance does not guarantee future results. Always conduct your own analysis and risk management.
Disclaimer
This indicator is for informational purposes only. Past performance is not indicative of future results. Always conduct proper risk management and due diligence.
License
Open source under MIT License
Author's Note
Contributions and suggestions for improvement are welcome. Please feel free to fork and enhance.

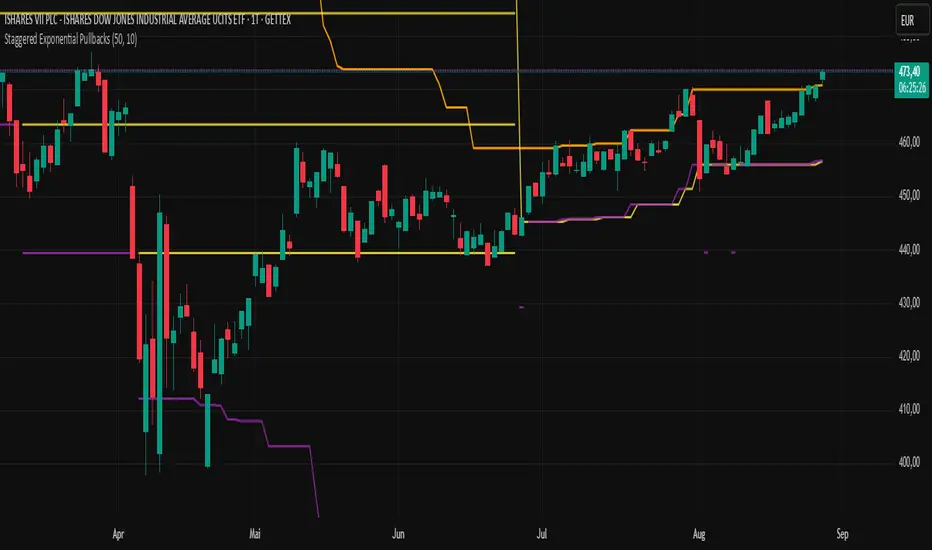
Staggered Exponential PullbacksIndicator Description: Staggered Exponential Pullbacks (Final)
Core Concept
This indicator is designed to dynamically track and visualize price pullbacks from a recent high. It serves as an intelligent alert system and a tool for visualizing potential support levels that follow a predefined, non-linear logic.
Instead of a fixed percentage interval, the indicator calculates the levels based on a fixed, exponentially increasing sequence of percentages. The distance between the levels increases as the price falls further. This models a strategy where larger price movements are tolerated as a pullback deepens before the next signal level is reached. The basis for this calculation is always the highest close of the last x candles.
Key Features
This indicator goes far beyond a simple calculation, offering a range of intelligent features for professional use:
Cascading, Fixed Levels: The levels are based on a fixed sequence of percentage distances (3.0%, 3.6%, 4.3%, etc.), where each new level is calculated from the previous level.
Persistent Support Levels ("Floors"): Once an alert level is breached, it transforms into a fixed support line ("floor"). This line will never move down, even if the market high subsequently drops.
Automatic Upward Adjustment: Established floors are automatically pulled upwards when the market shows new strength and makes higher highs. A once-reached -3% floor will therefore rise with the market.
Intelligent, Self-Cleaning Reset Logic: The indicator recognizes when a pullback sequence has ended and a new one has begun. "Ghost lines" from old, irrelevant price movements are automatically removed from the chart to ensure maximum clarity.
Cascade-Proof Alerts: Even during extremely fast sell-offs that break through multiple levels in a single candle, the indicator correctly captures every single level breach.
Customizable Visualization: All key parameters, such as the lookback period and the colors of the lines, can be easily adjusted in the settings.
Visual Elements on the Chart
The Orange Line (Highest Close): This is the reference line. It always shows the highest closing price within the defined lookback period and has a step-line shape.
The 'Floor' Lines (Default: Yellow): These are solid lines that indicate which percentage levels have already been breached in the current sequence. They function as established support levels.
The 'Next Due' Line (Default: Purple): This is a step-line that displays the next expected alert level. It moves dynamically with the calculation. As soon as the price crosses this line, an alert is triggered, and it transforms into a yellow "Floor" line.
Settings (Inputs)
Number of Candles (Lookback): Defines how many past candles are used to determine the highest closing price.
Displayed Alert Levels (Max 10): Determines the maximum number of levels the indicator will calculate and display.
Color of Floors: Allows you to freely choose the color for the solid, established support lines.
Color of Next Due Line: Allows you to freely choose the color for the next, untriggered alert line.
Setting Up Alerts (Important!)
Since the indicator uses dynamic alert messages, the alert must be set up as follows:
Add the indicator to the chart.
Click the clock icon ("Alert") in the top toolbar.
In the "Condition" field, select the name of this indicator: Staggered Exponential Pullbacks.
In the second dropdown menu, you must select the option "Any alert() function call".
Message: The message box can be left empty. The indicator automatically generates a detailed message (e.g., "Price Alert: Level 2 (3.6%) reached!").
Click "Create".
You only need one single alert to cover all 10 levels.
Important Disclaimer: Not Financial Advice
This indicator is purely a technical analysis tool for visualizing price movements. The displayed lines and triggered alerts do not constitute buy or sell recommendations and are not a form of financial or investment advice. They serve for informational and analytical purposes only.
Trading decisions based on the information from this indicator are made solely at your own risk and responsibility. The author and developer of this script assume no liability for any trading losses. Always conduct your own comprehensive analysis and, if necessary, consult a qualified financial advisor before making any trading decisions.
Khusan Pullback & Mean-Reversion (Manual ADX, Clean)Description
The indicator combines two logics in one tool:
Trend Pullback: Entries in the direction of the dominant trend after a short-term pullback to the EMA.
Return to the mean (Mean-Reversal): countertrend trades from external Bollinger bands with an RSI filter.
Key Features
Manual ADX (Wilder calculation): more precisely, it controls the strength of the trend without hidden smoothing.
There is a clear separation of market modes: the background of the chart highlights the condition: trend up/down or sideways (range).
Signal tags: Long TPB / Short TPB for pullbacks in the trend, Long MR / Short MR for a return to the average.
A minimum of “noise": neat colors, clear captions, without unnecessary graphics.
How to read signals
Trend Pullback
Long TPB — ADX ≥ threshold, price returns above fast EMA, RSI > 45.
Short TPB — ADX ≥ threshold, price goes below fast EMA, RSI < 55.
Mean-Reversion
Long MR — sideways (ADX < threshold), price below lower BB, RSI < 30, confirmation of reversal.
Short MR — sideways (ADX < threshold), price above upper BB, RSI > 70, reversal confirmation.
Parameters (Inputs)
EMA fast / EMA slow — fast and slow EMA (default 20/50).
ADX length / threshold — period and trend strength threshold.
BB length / mult — period and Bollinger Bands multiplier.
RSI length — RSI period.
Show labels/background — enable mode signatures and highlighting.
Recommendations for use
Timeframes: from M15 to H4. On lower TF, add a filter by the higher trend (e.g. H1/H4 EMA).
Instruments: XAUUSD, FX majors, indices, liquid futures and crypto pairs.
Risk management: for TPB, use SL behind the local swing extremum/below the EMA zone; for MR, use SL behind the external BB.
Filters: avoid entering against strong news; prioritize MR when volatility is low, and TPB when volatility is high.
Alerts
Create standard alerts based on the appearance of Long/Short TPB and Long/Short MR labels — the indicator provides clear conditions for auto-entry/notifications.
Important
The indicator is not

Trend Impulse Channels (Zeiierman)█ Overview
Trend Impulse Channels (Zeiierman) is a precision-engineered trend-following system that visualizes discrete trend progression using volatility-scaled step logic. It replaces traditional slope-based tracking with clearly defined “trend steps,” capturing directional momentum only when price action decisively confirms a shift through an ATR-based trigger.
This tool is ideal for traders who prefer structured, stair-step progression over fluid curves, and value the clarity of momentum-based bands that reveal breakout conviction, pullback retests, and consolidation zones. The channel width adapts automatically to market volatility, while the step logic filters out noise and false flips.
⚪ The Structural Assumption
This indicator is built on a core market structure observation:
After each strong trend impulse, the market typically enters a “cooling-off” phase as profit-taking occurs and counter-trend participants enter. This often results in a shallow pullback or stall, creating a slight negative slope in an uptrend (or a positive slope in a downtrend).
These “cooling-off” phases don’t reverse the trend — they signal temporary pressure before the next leg continues. By tracking trend steps discretely and filtering for this behavior, Trend Impulse Channels helps traders align with the rhythm of impulse → pause → impulse.
█ How It Works
⚪ Step-Based Trend Engine
At the heart of this tool is a dynamic step engine that progresses only when price crosses a predefined ATR-scaled trigger level:
Trigger Threshold (× ATR) – Defines how far price must break beyond the current trend state to register a new trend step.
Step Size (Volatility-Guided) – Each trend continuation moves the trend line in discrete units, scaling with ATR and trend persistence.
Trend Direction State – Maintains a +1/-1 internal bias to support directional filters and step tracking.
⚪ Volatility-Adaptive Channel
Each step is wrapped inside a dynamic envelope scaled to current volatility:
Upper and Lower Bands – Derived from ATR and band multipliers to expand/contract as volatility changes.
⚪ Retest Signal System
Optional signal markers show when price re-tests the upper or lower band:
Upper Retest → Pullback into resistance during a bearish trend.
Lower Retest → Pullback into support during a bullish trend.
⚪ Trend Step Signals
Circular markers can be shown to mark each time the trend steps forward, making it easy to identify structurally significant moments of continuation within a larger trend.
█ How to Use
⚪ Trend Alignment
Use the Trend Line and Step Markers to visually confirm the direction of momentum. If multiple trend steps occur in sequence without reversal, this typically signals strong conviction and trend persistence.
⚪ Retest-Based Entries
Wait for pullbacks into the channel and monitor for triangle retest signals. When used in confluence with trend direction, these offer high-quality continuation setups.
⚪ Breakouts
Look for breakouts beyond the upper or lower band after a longer period of pause. For higher likelihood of success, look for breakouts in the direction of the trend.
█ Settings
Trigger Threshold (× ATR) - Defines how far price must move to register a new trend step. Controls sensitivity to trend flips.
Max Step Size (× ATR) - Caps how far each trend step can extend. Prevents runaway step expansion in high volatility.
Band Multiplier (× ATR) - Expands the upper and lower channels. Controls how much breathing room the bands allow.
Trend Hold (bars) - Minimum number of bars the trend must remain active before allowing a flip. Helps reduce noise.
Filter by Trend - Restrict retest signals to those aligned with the current trend direction.
-----------------
Disclaimer
The content provided in my scripts, indicators, ideas, algorithms, and systems is for educational and informational purposes only. It does not constitute financial advice, investment recommendations, or a solicitation to buy or sell any financial instruments. I will not accept liability for any loss or damage, including without limitation any loss of profit, which may arise directly or indirectly from the use of or reliance on such information.
All investments involve risk, and the past performance of a security, industry, sector, market, financial product, trading strategy, backtest, or individual's trading does not guarantee future results or returns. Investors are fully responsible for any investment decisions they make. Such decisions should be based solely on an evaluation of their financial circumstances, investment objectives, risk tolerance, and liquidity needs.

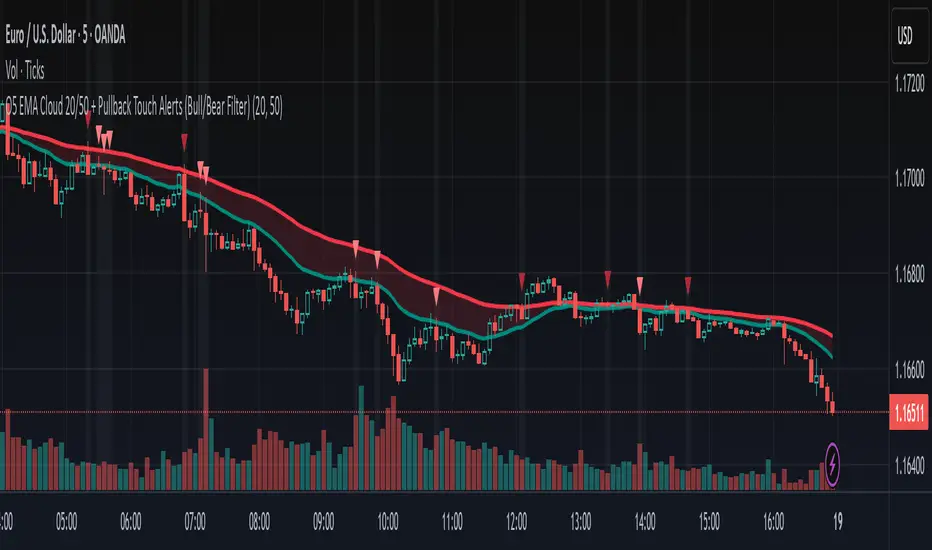
O5 EMA Cloud 20/50 + Pullback Touch Alerts (Bull/Bear Filter)This indicator shows an EMA cloud that is set to Fast=20 and Slow=50 by default, but can be changed.
It features suggested entry signals when price pulls back to either EMA level in both uptrends and downtrends.
Buy signals print only when price pulls back to one of the EMA levels and closes up.
Bearish signals only print when price pulls back to one of the EMA levels and closes down.
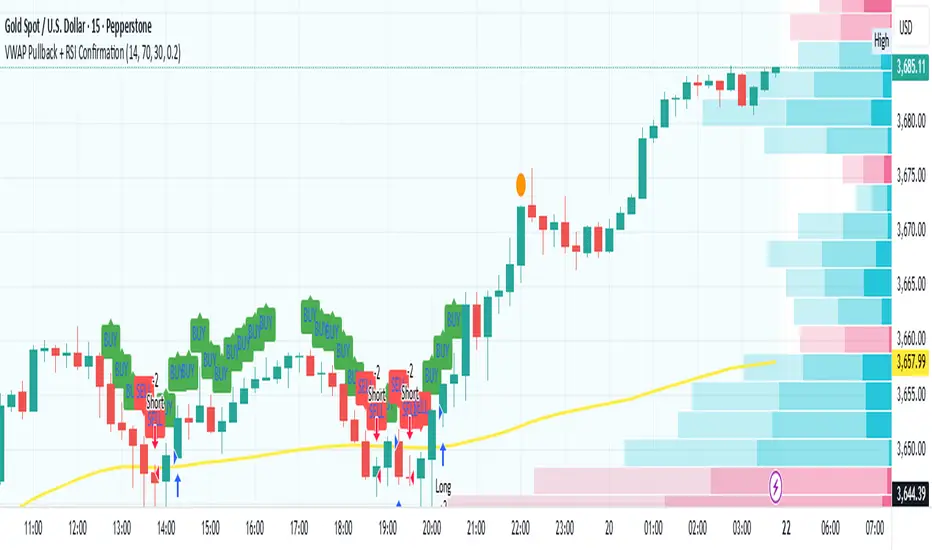
VWAP Pullback + RSI ConfirmationThis strategy focuses on trend continuation entries. Instead of betting on reversions, it looks for opportunities when price pulls back to VWAP but the dominant trend remains intact.
Trend Bias:
Price above VWAP = bullish environment → look for BUY pullbacks.
Price below VWAP = bearish environment → look for SELL pullbacks.
Entry Logic:
BUY: Price pulls back near VWAP, RSI stays above oversold (momentum intact).
SELL: Price pulls back near VWAP, RSI stays below overbought (momentum intact).
Exit Rule:
Stop-loss just below/above VWAP.
Take-profit at 1.5–2x risk (default script uses ~2%).
Best Timeframes:
15m–1H → good for intraday trend-following setups.
Daily → captures stronger, longer trends.
⚡ This strategy is powerful in trending markets because VWAP acts as a "magnet" for pullbacks, while RSI prevents overbought/oversold traps.
Valid Pullbacks and Trend by kpt. GonzoThis script helps identify valid pullbacks. Based on the marked pullbacks, it can draw both internal and external structure trendlines.
A pullback is marked with a small triangle above or below the candle that created the local high or low.
A new local high is marked with a red triangle above the candle if at least one subsequent candle has a low lower than the low of the candle that created the new local high.
A new local low is marked with a green triangle below the candle if at least one subsequent candle has a high higher than the high of the candle that created the new local low.
Based on the marked local highs and lows, the internal structure trendline is created by simply connecting all highs and lows with a line.
The external structure is drawn in a similar way, but only highs and lows that have broken the previous structure are connected. This helps focus on important pivots and better understand the market structure.
Setting-Less Trend-Step FilteringIntroduction
Indicators settings have been a major concern in trading strategies, in order to provide the best results each indicators involved in the strategy must have its settings optimized, when using only 1 indicator this task can easily be achieved, but an increasing number of indicators involve more slower computations, lot of softwares will use brute force for indicators settings optimization, this involve testing each indicator settings and see which setting/combination maximize the equity, in order to fasten this process softwares can use a user defined range for the indicator settings. Nonetheless the combination that maximize the equity at time t might be different at time t+1...n .
Therefore i propose an indicator without any numerical setting that aim to filter small price variations using the architecture of the T-step lsma, such indicator can provide robust filtering and can therefore be used as input for other indicators.
Robustness Vs Non Robustness
Robustness is often defined as the ability of certain statistical tools to be less affected by outliers, outliers are defined as huge variations in a data-set, high volatility movements and large gaps might be considered as outliers. However here we define robustness as the ability of an indicator to be non affected by price variations that are not correlated with the main trend, which can be defined in technical analysis as pullbacks.
Some small pullbacks in INTEL, the indicator is not affected by them, which allow the indicator to filter the price in a "smart" way.
This effect is made possible by using exponential averaging in the indicator, exponential averaging is defined as y = sc*x + (1-sc)*y , with 1 > sc > 0 . Here sc is calculated in a similar way as the kalman gain, which is in the form of a/(a + b) , in our case this is done with :
sc = abs(input - nz(b ))/(abs(input - nz(b )) + nz(a ))
Non Robust Version Of The Indicator
The user is allowed to use the non robust version of the indicator by unchecking "robust" in the setting panel, this allow a better fit with the price at the cost of less filtering.
robust checked
robust unchecked
Conclusion
I proposed a technical indicator that aim to filter short frequencies without the use of parameters, the indicator proven to be robust to various pullbacks and therefore was able to follow the main trend, although using the term trend for such small price variations might be wrong. Removing high frequencies is always beneficial in trading, noisy series are harder to manipulate, this is why you'll see a lot of indicators using median price often defined as hl2 instead of the closing price.
Like previous settings-less indicators i published this one can behave differently depending on the time frame selected by the user, lower time frames will make the indicator filter more. I'll try to make more setting-less indicators that will correct this effect.
Acknowledgements
The support and interest of the community is only thing that allowed me to be where i'am today, i'am thankful. Special thanks to the tv staff, LucF, and my family who may not have believed in this project but are still proud of their son.

EMA Pullback System 1:5 RRR [SL]EMA Trend Pullback System (1:5 RRR)
Summary:
This indicator is designed to identify high-probability pullback opportunities along the main trend, providing trade signals that target a high 1:5 Risk/Reward Ratio. It is a trend-following strategy built for patient traders who wait for optimal setups.
Strategy Logic:
The system is based on three Exponential Moving Averages (EMAs): 21, 50, and 200.
BUY Signal:
Trend (Uptrend): The price must be above the 200 EMA.
Pullback: The price must pull back into the "Dynamic Support Zone" between the 21 EMA and 50 EMA.
Confirmation: A strong Bullish Confirmation Candle (e.g., Bullish Engulfing) must form within this zone.
SELL Signal:
Trend (Downtrend): The price must be below the 200 EMA.
Pullback: The price must rally back into the "Dynamic Resistance Zone" between the 21 EMA and 50 EMA.
Confirmation: A strong Bearish Confirmation Candle (e.g., Bearish Engulfing) must form within this zone.
Key Features:
Clearly plots the 21, 50, and 200 EMAs on the chart.
Displays BUY and SELL labels when the rules are met.
Automatically calculates and plots Stop Loss (SL) and Take Profit (TP) levels for each signal.
The Risk/Reward Ratio for the Take Profit level is customizable in the settings (Default: 1:5).
How to Use:
Best suited for higher timeframes like H1 and H4.
It is crucial to wait for the signal candle to close before considering an entry.
While this is an automated tool, for best results, combine its signals with your own analysis of Price Action and Market Structure.
Disclaimer:
This is an educational tool and not financial advice. Trading involves substantial risk. Always use proper risk management. It is essential to backtest any strategy before deploying it with real capital.

[SHORT ONLY] 10 Bar Low Pullback█ STRATEGY DESCRIPTION
The "10 Bar Low Pullback" strategy is a contrarian short trading system designed to capture pullbacks after a new 10‐bar low is made. it identifies a potential short opportunity when the current bar’s low breaks below the lowest low of the previous 10 bars, provided that the bar exhibits strong internal momentum as measured by its IBS value. An optional trend filter further refines entries by requiring that the close is below a 200-period EMA.
█ WHAT IS INTERNAL BAR STRENGTH (IBS)?
Internal Bar Strength (IBS) measures where the closing price falls within the high-low range of a bar. It is calculated as:
ibs = (close - low) / (high - low)
- Low IBS (≤ 0.2): Indicates the close is near the bar's low, suggesting oversold conditions.
- High IBS (≥ 0.8): Indicates the close is near the bar's high, suggesting overbought conditions.
█ SIGNAL GENERATION
1. SHORT ENTRY
A Short Signal is triggered when:
The current bar’s low is below the lowest low of the past X bars (default: 10).
The bar’s IBS is greater than the specified threshold (default: 0.85).
The signal occurs within the defined trading window (between Start Time and End Time).
If the EMA Filter is enabled, the close must be below the 200-period EMA.
2. EXIT CONDITION
An exit Signal is generated when the current close falls below the previous bar’s low (close < low ), indicating a potential bearish reversal and prompting the strategy to close its short position.
█ ADDITIONAL SETTINGS
Lookback Period: Defines the number of bars (default is 10) over which the lowest low is calculated.
IBS Threshold: Sets the minimum required IBS value (default is 0.85) to qualify as a pullback.
Trading Window: Trades are only executed between the user-defined Start Time and End Time.
EMA Filter (Optional): When enabled, short entries are only considered if the current close is below the 200-period EMA, with the EMA period being adjustable (default is 200).
█ PERFORMANCE OVERVIEW
Designed for shorting opportunities, this strategy aims to capture pullbacks following an aggressive 10-bar low break.
It leverages a combination of a lookback low and IBS measurement to identify overextended bullish moves that may revert.
The optional EMA filter helps confirm a bearish market environment by ensuring the price remains under the trend line.
Suitable for use on various assets, including stocks and ETFs, on daily or similar timeframes.
Backtesting and parameter optimization are recommended to tailor the strategy to specific market conditions.

Bias + VWAP Pullback — v4 (PA + BOS/CHOCH)Simple idea: I identify the trend (bias) from the larger timeframe, and only trade pullbacks to the VWAP/EMA during liquidity (London/New York). When the trend is clear, gold moves strongly, and its pullbacks to the balance lines provide clear opportunities.
Timeframe and Sessions (Cairo Time)
Analysis: H1 to determine the trend.
Implementation: 5m (or 1m if professional).
Trading window:
London Opening: 10:00–12:30
New York Opening: 16:30–19:00
(avoid the rest of the day unless there is exceptional traffic).
Direction determination (BIAS)
On H1:
If the price is above the 200 EMA and the daily VWAP is bullish and the price is above it → uptrend (long-only).
If the price is below the 200 EMA and the daily VWAP is bearish and the price is below it → bearish trend (short-only).
Determine your levels: yesterday's high/low (PDH/PDL) + approximate Asia range (03:00–09:30).
Entry Rules (Setup A: Trend Continuation)
Asia range breakout towards Bias during liquidity window.
Wait for a withdrawal to:
Daily VWAP, or
EMA50 on 5m frame (best if both cross).
Confirmation: Confirmation low/high on 5m (HL buy/LH sell) + clear impulse candle (Body is greater than average of last 10 candles).
Entry:
Buy: When the price returns above VWAP/EMA50 with a confirmation candle close.
Sell: The exact opposite.
Stop Loss (SL): Below/above the last confirmation low/high or ATR(14, 5m) x 1.5 (largest).
Objectives:
TP1 = 1R (Close 50% and move the rest Break-even).
TP2 = 2.5R to 3R or at an important HTF level (PDH/PDL/Bid/Demand Zone).
Entry Rules (Setup B: Reversion to VWAP – “Mean Reversion”)
Use with extreme caution, once daily maximum:
Price deviation from VWAP by more than ~1.5 x ATR(14, 5m) with rejection candles appearing near PDH/PDL.
Reverse entry towards the return of VWAP.
SL small behind rejection top/bottom.
Main target: VWAP. (Don't get greedy — this scenario is for extended periods only.)
News Filtering and Risk Management
Avoid trading 15–30 minutes before/after strong US news (CPI, NFP, FOMC).
Maximum daily loss: 1.5–2% of account balance.
Risk per trade: 0.25–0.5% (if you are learning) or 0.5–1% (if you are experienced).
Do not exceed two consecutive losing trades per day.
Don't chase the market after the opportunity has passed — wait for the next pullback.
Smart Deal Management
After TP1: Move stop to entry point + trail the rest with EMA20 on 5m or ATR Trailing = ATR(14)×1.0.
If the price touches a strong daily level (PDH/PDL) and fails to break, consider taking additional profit.
If VWAP starts to flatten and breaks against the trend on H1, stop trading for the day.
Quick Checklist (Before Entry)
H1 trend is clear and consistent with 200EMA + VWAP.
Penetrating the Asia range towards Bias.
Clean pull to VWAP/EMA50 on 5m.
Confirmation candle and real push.
SL is logical (behind swing/ATR×1.5) and R :R ≥ 1:2.
No red news coming soon.
Example of "ready-made" settings
EMA: 20, 50, 200 on 5m, 200 only on H1.
VWAP: Daily (reset daily).
ATR: 14 on 5m.
Levels: PDH/PDL + Asia Band (03:00–09:30 Cairo).
Gold Notes
Gold is fast and sharp at the open; don't get in early — wait for the draw.
Fakeouts are common before news: it is best to call with the trend after the price returns above/below VWAP.
Don't expect 80% consistent wins every day — the advantage comes from discipline, filtering out bad days, and only withdrawing when you're on the right track.
تعتبر شركة الماسة الألمانية أحد المؤسسات العاملة بالمملكة العربية السعودية ولها تاريخ طويل من الخدمات الكثيرة والمتنوعة التى مازالت تقدمها للكثير من العملاء داخل جميع مدن وأحياء المملكة حيث نقدم أفضل ما لدينا من خلال مجموعة الشركات التالية والتي من خلالها ستتلقي كل ما تحتاج إلية في كل المجال المختلفة فنحن نعمل منذ عام 2015 ولنا سابقات اعمال فى مختلف المجالات الحيوية التى نخدم من خلالها عملائنا ونوفر لهم أرخص الأسعار وبأعلى جودة من الممكن توفرها فى المجالات التالية :-
خدمات تنظيف المنازل والفلل والشقق
خدمات عزل الخزانات تنظيف غسيل صيانة اصلاح
خدمات جلي البلاط والرخام والسيراميك
خدمات نقل العفش عمالة فلبينية مدربة
خدمات مكافحة الحشرات بجدة
كل هذة الخدمات وأكثر نوفرها لكل المتعاقدين بأفضل الطرق مع توفير خطط وبرامج متنوعة لأتمام العمل المسنود إلينا بأفضل وأحدث الطرق الحديثة والعصرية سواء فى شركات النظافة بجدة ومكة المكرمة أو شركات نقل العفش بجدة عمالة فلبينية وباقى الخدمات مثل جلي وتلميع الرخام بمكة وجدة ولا ننسي شركة مكافحة حشرات بجدة التى ساعدت آلاف المواطنين على تنظيف منازلهم من الحشرات بأفضل مبيدات حشرية.

Flux AI PullBack System (Hybrid Pro)Flux AI PullBack System (Hybrid Pro)
//Session-Aware | Adaptive Confluence | Grace Confirm Logic//
Overview:
The Flux AI PullBack System (Hybrid Pro v5) is an adaptive, session-aware pullback indicator designed to identify high-probability continuation setups within trending markets. It automatically adjusts between “Classic” and “Enhanced” logic modes based on volatility, volume, and ATR slope, allowing it to perform seamlessly across different market sessions (Asian, London, and New York).
Core Features:
Hybrid Auto Mode — Dynamically switches between Classic (fast-moving) and Enhanced (strict) modes.
Session-Aware Context — Optimized for intraday trading in ES, NQ, and SPY.
Grace Confirmation Logic — Validates pullbacks with a follow-through condition to reduce noise.
Adaptive EMA Zone (38/62) — Highlights pullback areas with dynamic aqua fill and transparency linked to trend strength.
Noise Suppression Filter — Prevents false pullbacks during EMA crossovers or unstable transitions.
Weighted Confluence Model — Combines trend, ATR, volume, and swing structure for confirmation strength.
Pine v6 Compliant Alerts — Constant-string safe, ready for webhooks and automation.
Visual Elements:
Aqua EMA Zone: Displays the “breathing” pullback band (tightens during volatility spikes).
PB↑ / PB↓ Markers: Confirmed pullbacks with subtle transparency and fixed label size.
Bar Highlights: Yellow for pullbacks; ice-blue for confirmed continuation.
Use Cases
Perfect for:
Intraday trend traders
0DTE SPX / ES scalpers
Futures traders (NQ, MNQ, MES)
Algorithmic strategy builders using webhooks
Recommended Timeframes:
1–15 minute charts (scalping / intraday)
Higher timeframes for swing confirmations.
Attribution:
This open-source script was inspired by Chris Moody’s “CM Slingshot System” and JustUncleL’s Pullback Tools, but it was built from scratch using AI-assisted code refinement (ChatGPT).
All logic and enhancements are original, not derived from proprietary software.
License: MIT (Open Source)
© 2025 Ken Anderson — You may modify, use, or redistribute with credit.
Keywords:
Pullback, Reversal, AI Trading, EMA Zone, Session Aware, Futures Trading, SPX, ES, NQ, ATR Filter, Volume Confirmation, Flux System, Pine Script v6, Non-Repainting, Adaptive Trading Indicator.
