Fractal Pullback Market StructureFractal Pullback Market Structure
Author: The_Forex_Steward
License: Mozilla Public License 2.0
The Fractal Pullback Market Structure indicator is a sophisticated price action tool designed to visualize internal structure shifts and break-of-structure (BoS) events with high accuracy. It leverages fractal pullback logic to identify market swing points and confirm whether a directional change has occurred.
This indicator detects swing highs and lows based on fractal behavior, drawing zigzag lines to connect these key pivot points. It classifies and labels each structural point as either a Higher High (HH), Higher Low (HL), Lower High (LH), or Lower Low (LL). Internal shifts are marked using triangle symbols on the chart, distinguishing bullish from bearish developments.
Break of Structure events are confirmed when price closes beyond the most recent swing high or low, and a horizontal line is drawn at the breakout level. This helps traders validate when a structural trend change is underway.
Users can configure the lookback period that defines the sensitivity of the pullback detection, as well as a timeframe multiplier to align the logic with higher timeframes such as 4H or Daily. There are visual customization settings for the zigzag lines and BoS markers, including color, width, and style (solid, dotted, or dashed).
Alerts are available for each key structural label—HH, HL, LH, LL—as well as for BoS events. These alerts are filtered through a selectable alert mode that separates signals by timeframe category: Low Timeframe (LTF), Medium Timeframe (MTF), and High Timeframe (HTF). Each mode allows the user to receive alerts only when relevant to their strategy.
This indicator excels in trend confirmation and reversal detection. Traders can use it to identify developing structure, validate internal shifts, and anticipate breakout continuation or rejection. It is particularly useful for Smart Money Concept (SMC) traders, swing traders, and those looking to refine entries and exits based on price structure rather than lagging indicators.
Visual clarity, adaptable timeframe logic, and precise structural event detection make this tool a valuable addition to any price action trader’s toolkit.
Tìm kiếm tập lệnh với "pullback"

Advanced VWAP_Pullback Strategy_Trend-Template QualifierGeneral Description and Unique Features of this Script
Introducing the Advanced VWAP Momentum-Pullback Strategy (long-only) that offers several unique features:
1. Our script/strategy utilizes Mark Minervini's Trend-Template as a qualifier for identifying stocks and other financial securities in confirmed uptrends. Mark Minervini, a 2x US Investment Champion, developed the Trend-Template, which covers eight different and independent characteristics that can be adjusted and optimized in this trend-following strategy to ensure the best results. The strategy will only trigger buy-signals in case the optimized qualifiers are being met.
2. Our strategy is based on the supply/demand balance in the market, making it timeless and effective across all timeframes. Whether you are day trading using 1- or 5-min charts or swing-trading using daily charts, this strategy can be applied and works very well.
3. We have also integrated technical indicators such as the RSI and the MA / VWAP crossover into this strategy to identify low-risk pullback entries in the context of confirmed uptrends. By doing so, the risk profile of this strategy and drawdowns are being reduced to an absolute minimum.
Minervini’s Trend-Template and the ‘Stage-Analysis’ of the Markets
This strategy is a so-called 'long-only' strategy. This means that we only take long positions, short positions are not considered.
The best market environment for such strategies are periods of stable upward trends in the so-called stage 2 - uptrend.
In stable upward trends, we increase our market exposure and risk.
In sideways markets and downward trends or bear markets, we reduce our exposure very quickly or go 100% to cash and wait for the markets to recover and improve. This allows us to avoid major losses and drawdowns.
This simple rule gives us a significant advantage over most undisciplined traders and amateurs!
'The Trend is your Friend'. This is a very old but true quote.
What's behind it???
• 98% of stocks made their biggest gains in a Phase 2 upward trend.
• If a stock is in a stable uptrend, this is evidence that larger institutions are buying the stock sustainably.
• By focusing on stocks that are in a stable uptrend, the chances of profit are significantly increased.
• In a stable uptrend, investors know exactly what to expect from further price developments. This makes it possible to locate low-risk entry points.
The goal is not to buy at the lowest price – the goal is to buy at the right price!
Each stock goes through the same maturity cycle – it starts at stage 1 and ends at stage 4
Stage 1 – Neglect Phase – Consolidation
Stage 2 – Progressive Phase – Accumulation
Stage 3 – Topping Phase – Distribution
Stage 4 – Downtrend – Capitulation
This strategy focuses on identifying stocks in confirmed stage 2 uptrends. This in itself gives us an advantage over long-term investors and less professional traders.
By focusing on stocks in a stage 2 uptrend, we avoid losses in downtrends (stage 4) or less profitable consolidation phases (stages 1 and 3). We are fully invested and put our money to work for us, and we are fully invested when stocks are in their stage 2 uptrends.
But how can we use technical chart analysis to find stocks that are in a stable stage 2 uptrend?
Mark Minervini has developed the so-called 'trend template' for this purpose. This is an essential part of our JS-TechTrading pullback strategy. For our watchlists, only those individual values that meet the tough requirements of Minervini's trend template are eligible.
The Trend Template
• 200d MA increasing over a period of at least 1 month, better 4-5 months or longer
• 150d MA above 200d MA
• 50d MA above 150d MA and 200d MA
• Course above 50d MA, 150d MA and 200d MA
• Ideally, the 50d MA is increasing over at least 1 month
• Price at least 25% above the 52w low
• Price within 25% of 52w high
• High relative strength according to IBD.
NOTE: In this basic version of the script, the Trend-Template has to be used as a separate indicator on TradingView (Public Trend-Template indicators are available in TradingView – community scripts). It is recommended to only execute buy signals in case the stock or financial security is in a stage 2 uptrend, which means that the criteria of the trend-template are fulfilled.
This strategy can be applied to all timeframes from 5 min to daily.
The VWAP Momentum-Pullback Strategy
For the JS-TechTrading VWAP Momentum-Pullback Strategy, only stocks and other financial instruments that meet the selected criteria of Mark Minervini's trend template are recommended for algorithmic trading with this startegy.
A further prerequisite for generating a buy signals is that the individual value is in a short-term oversold state (RSI).
When the selling pressure is over and the continuation of the uptrend can be confirmed by the MA / VWAP crossover after reaching a price low, a buy signal is issued by this strategy.
Stop-loss limits and profit targets can be set variably. You also have the option to make use of the trailing stop exit strategy.
Relative Strength Index (RSI)
The Relative Strength Index (RSI) is a technical indicator developed by Welles Wilder in 1978. The RSI is used to perform a market value analysis and identify the strength of a trend as well as overbought and oversold conditions. The indicator is calculated on a scale from 0 to 100 and shows how much an asset has risen or fallen relative to its own price in recent periods.
The RSI is calculated as the ratio of average profits to average losses over a certain period of time. A high value of the RSI indicates an overbought situation, while a low value indicates an oversold situation. Typically, a value > 70 is considered an overbought threshold and a value < 30 is considered an oversold threshold. A value above 70 signals that a single value may be overvalued and a decrease in price is likely , while a value below 30 signals that a single value may be undervalued and an increase in price is likely.
For example, let's say you're watching a stock XYZ. After a prolonged falling movement, the RSI value of this stock has fallen to 26. This means that the stock is oversold and that it is time for a potential recovery. Therefore, a trader might decide to buy this stock in the hope that it will rise again soon.
The MA / VWAP Crossover Trading Strategy
This strategy combines two popular technical indicators: the Moving Average (MA) and the Volume Weighted Average Price (VWAP). The MA VWAP crossover strategy is used to identify potential trend reversals and entry/exit points in the market.
The VWAP is calculated by taking the average price of an asset for a given period, weighted by the volume traded at each price level. The MA, on the other hand, is calculated by taking the average price of an asset over a specified number of periods. When the MA crosses above the VWAP, it suggests that buying pressure is increasing, and it may be a good time to enter a long position. When the MA crosses below the VWAP, it suggests that selling pressure is increasing, and it may be a good time to exit a long position or enter a short position.
Traders typically use the MA VWAP crossover strategy in conjunction with other technical indicators and fundamental analysis to make more informed trading decisions. As with any trading strategy, it is important to carefully consider the risks and potential rewards before making any trades.
This strategy is applicable to all timeframes and the relevant parameters for the underlying indicators (RSI and MA/VWAP) can be adjusted and optimized as needed.
Backtesting
Backtesting gives outstanding results on all timeframes and drawdowns can be reduced to a minimum level. In this example, the hourly chart for MCFT has been used.
Settings for backtesting are:
- Period from Jan 2020 until March 2023
- Starting capital 100k USD
- Position size = 25% of equity
- 0.01% commission = USD 2.50.- per Trade
- Slippage = 2 ticks
Other comments
- This strategy has been designed to identify the most promising, highest probability entries and trades for each stock or other financial security.
- The combination of the Trend-Template and the RSI qualifiers results in a highly selective strategy which only considers the most promising swing-trading entries. As a result, you will normally only find a low number of trades for each stock or other financial security per year in case you apply this strategy for the daily charts. Shorter timeframes will result in a higher number of trades / year.
- Consequently, traders need to apply this strategy for a full watchlist rather than just one financial security.

Bollinger Band+ Multi EMA, SMAHello Everyone.
I make Bollinger band , 3 ema and 3 sma combined.
I think this indicator can use all timeframe.
--------------------------------------------------------------
Indicator will show you
1. Trend follow
2. Pullback catch
2. Market bounce.
1. Trend Follow
- Trend Follow for I used 3 terms. They are short, Mid and Long Trend.
2. Pullback Catch
- EMA for Save, take care, alert Zones.
- Mid Term Trend can be catch also.
3. Market Bounce
- Bollinger Band will show you market re-bounce point.
Final Notes
Indicator will show Trend, Pullback, Market bounce and some support and resistant level.

HA Trend Reclaim Daily Structure Pullback🔹 HA Trend Reclaim — Daily Structure Pullback System
HA Trend Reclaim is a professional-grade trend continuation indicator designed to highlight high-probability LONG and SHORT setups using a combination of:
Heikin Ashi candle structure
EMA trend alignment (9 & 50 EMA)
Daily High / Low market structure
Pullback → momentum reclaim logic
This indicator is built for traders who want clarity, discipline, and structure, not noise or over-signaling.
It focuses on trading with the dominant trend, entering only after price pulls back and confirms strength via momentum reclaim.
🔑 What Makes This Different
✔ No counter-trend signals
✔ No breakout chasing
✔ Built-in structure awareness
✔ Clear visual entries & risk levels
✔ Works across stocks, crypto, and futures
This script is ideal for traders who prefer fewer, higher-quality trades rather than constant signals.
2️⃣ HOW TO USE (FEATURED-FRIENDLY VERSION)
🟢 LONG Conditions
A LONG signal appears when:
EMA 9 is above EMA 50
Price is above EMA 50
Price pulls back into the EMA zone
Price reclaims EMA 9 upward
Heikin Ashi candle closes bullish (not a doji)
🔴 SHORT Conditions
A SHORT signal appears when:
EMA 9 is below EMA 50
Price is below EMA 50
Price pulls back into the EMA zone
Price reclaims EMA 9 downward
Heikin Ashi candle closes bearish (not a doji)
📦 Daily Structure Boxes
The indicator highlights the daily high–low range:
Green box → bullish daily bias
Red box → bearish daily bias
These boxes help traders avoid:
Mid-range chop
Late entries
Trading against daily momentum
3️⃣ BEST SETTINGS (VERY IMPORTANT FOR USERS)
Recommended Timeframes
Stocks: 5m, 15m, 1H
Crypto: 15m, 1H, 4H
Futures: 5m, 15m
Recommended Inputs
Setting Value
EMA Fast 9
EMA Slow 50
Swing Lookback 15
Runner RR 2.0
Heikin Ashi Enabled
Show Daily Boxes Enabled
Notes
Higher timeframes = fewer, stronger signals
Avoid low-liquidity instruments
Best used during active sessions (London / NY)

Trend & Pullback Cycle How to use.
Trend Identification:
Green Columns: The cycle is above 50. Look for Longs.
Red Columns: The cycle is below 50. Look for Shorts.
Pullback Detection:
I added a Colour Change feature. If the Green bars turn Dark Green, it means momentum is fading (a pullback is happening). This is your signal to get ready to enter or add to a position once it turns Bright Green again.
The Yellow Line:
This is your trigger. In the screenshot, you see the bars cross the yellow line.
Entry Signal: When the Histogram crosses above the Yellow line (while generally green) or crosses below it (while generally red).

9/15 EMA Scalper 9/15 EMA Scalper — by uzairbaloch
This script is a price-action based scalping system built around the 9 EMA and 15 EMA trend structure.
It identifies short-term reversal points where the market pulls back into the EMAs and confirms direction with a strong candle signal.
The strategy looks for:
• A clear EMA trend (9 above 15 for buys, 9 below 15 for sells)
• Pullback into EMA9/EMA15 with candle bodies touching the fast EMA
• Strong confirmation candle (engulfing / strong momentum / controlled wick)
• Optional slope filter to avoid flat, choppy sessions
• Automatic trade labels showing Entry, SL and TP (based on R:R)
The script is designed for scalping on gold, indices, and high-volatility FX pairs.
It resets trade logic immediately after SL or TP is hit, so it can catch the next valid signal without delay.
This tool is meant as an indicator — not a full strategy — and can be used to visually mark high-probability EMA pullback setups with precise levels.
Author: uzairbaloch

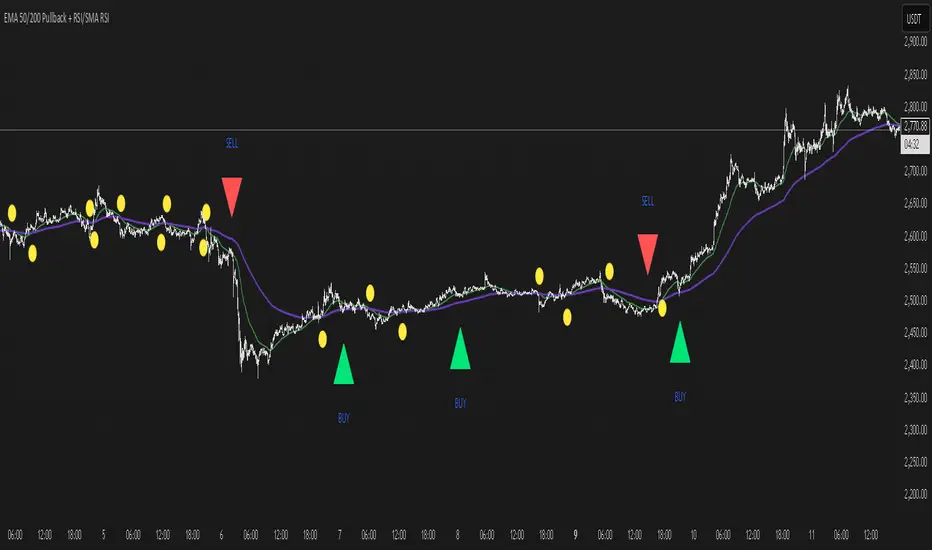
EMA 50/200 Pullback + RSI (BTC/USDT 15m - 2 Bar Logic)I recognize that combining indicators requires clear justification on how the components interact Therefore the new scripts description will explicitly detail the strategys operational logic
Objective The strategy is a Trend Following Pullback System designed for high frequency time frames 15m
Synergy The EMA50 EMA200 defines the primary Trend Direction Trend Filter It then utilizes a 2 Bar Pullback Logic to find an entry point where the price has momentarily reversed against the trendline and the RSI 14 serves as a Momentum Filter RSI greater than 50 for Long RSI less than 50 for Short to minimize false signals

Advanced Trading System - [WOLONG X DBG]Advanced Multi-Timeframe Trading System
Overview
This technical analysis indicator combines multiple established methodologies to provide traders with market insights across various timeframes. The system integrates SuperTrend analysis, moving average clouds, MACD-based candle coloring, RSI analysis, and multi-timeframe trend detection to suggest potential entry and exit opportunities for both swing and day trading approaches.
Methodology
The indicator employs a multi-layered analytical approach based on established technical analysis principles:
Core Signal Generation
SuperTrend Engine: Utilizes adaptive SuperTrend calculations with customizable sensitivity (1-20) combined with SMA confirmation filters to identify potential trend changes and continuations
Braid Filter System: Implements moving average filtering using multiple MA types (McGinley Dynamic, EMA, DEMA, TEMA, Hull, Jurik, FRAMA) with percentage-based strength filtering to help reduce false signals
Multi-Timeframe Analysis: Analyzes trend conditions across 10 different timeframes (1-minute to Daily) using EMA-based trend detection for broader market context
Advanced Features
MACD Candle Coloring: Applies dynamic 4-level candle coloring system based on MACD histogram momentum and signal line relationships for visual trend strength assessment
RSI Analysis: Identifies potential reversal areas using RSI oversold/overbought conditions with SuperTrend confirmation
Take Profit Analysis: Features dual-mode TP detection using statistical slope analysis and Parabolic SAR integration for exit timing analysis
Key Components
Signal Types
Primary Signals: Green ▲ for potential long entries, Red ▼ for potential short entries with trend and SMA alignment
Reversal Signals: Small circular indicators for RSI-based counter-trend possibilities
Take Profit Markers: X-cross symbols indicating statistical TP analysis zones
Pullback Signals: Purple arrows for potential trend continuation entries using Parabolic SAR
Visual Elements
8-Layer MA Cloud: Customizable moving average cloud system with 3 color themes for trend visualization
Real-Time Dashboard: Multi-timeframe trend analysis table showing bullish/bearish status across all timeframes
Dynamic Candle Colors: 4-intensity MACD-based coloring system (ranging from light to strong trend colors)
Entry/SL/TP Labels: Automatic calculation and display of suggested entry points, stop losses, and multiple take profit levels
Usage Instructions
Basic Configuration
Sensitivity Setting: Start with default value 6
Increase (7-15) for more frequent signals in volatile markets
Decrease (3-5) for higher quality signals in trending markets
MA Filter Type: McGinley Dynamic recommended for smoother signals
Filter Strength: Set to 80% for balanced filtering, adjust based on market conditions
Signal Interpretation
Long Entry: Green ▲ suggests when price crosses above SuperTrend with bullish SMA alignment
Short Entry: Red ▼ suggests when price crosses below SuperTrend with bearish SMA alignment
Reversal Opportunities: Small circles indicate RSI-based counter-trend analysis
Take Profit Zones: X-crosses mark statistical TP areas based on slope analysis
Dashboard Analysis
Green Cells: Bullish trend detected on that timeframe
Red Cells: Bearish trend detected on that timeframe
Multi-Timeframe Confluence: Look for alignment across multiple timeframes for stronger signal confirmation
Risk Management Features
Automatic Calculations
ATR-Based Stop Loss: Dynamic stop loss calculation using ATR multiplier (default 1.9x)
Multiple Take Profit Levels: Three TP targets with 1:1, 1:2, and 1:3 risk-reward ratios
Position Sizing Guidance: Entry labels display suggested price levels for order placement
Confirmation Requirements
Trend Alignment: Requires SuperTrend and SMA confirmation before signal generation
Filter Validation: Braid filter must show sufficient strength before signals activate
Multi-Timeframe Context: Dashboard provides broader market context for decision making
Optimal Settings
Timeframe Recommendations
Scalping: 1M-5M charts with sensitivity 8-12
Day Trading: 15M-1H charts with sensitivity 6-8
Swing Trading: 4H-Daily charts with sensitivity 4-6
Market Conditions
Trending Markets: Reduce sensitivity, increase filter strength
Ranging Markets: Increase sensitivity, enable reversal signals
High Volatility: Adjust ATR risk factor to 2.0-2.5
Advanced Features
Customization Options
MA Cloud Periods: 8 customizable periods for cloud layers (default: 2,6,11,18,21,24,28,34)
Color Themes: Three professional color schemes plus transparent option
Dashboard Position: 9 positioning options with 4 size settings
Signal Filtering: Individual toggle controls for each signal type
Technical Specifications
Moving Average Types: 21 different MA calculations including advanced types (Jurik, FRAMA, VIDA, CMA)
Pullback Detection: Parabolic SAR with customizable start, increment, and maximum values
Statistical Analysis: Linear regression slope calculation for trend-based TP analysis
Important Limitations
Lagging Nature: Some signals may appear after potential entry points due to confirmation requirements
Ranging Markets: May produce false signals during extended sideways price action
High Volatility: Requires parameter adjustment during news events or unusual market conditions
Computational Load: Multiple timeframe analysis may impact performance on slower devices
No Guarantee: All signals are suggestions based on technical analysis and may be incorrect
Educational Disclaimers
This indicator is designed for educational and analytical purposes only. It represents a technical analysis tool based on mathematical calculations of historical price data and should not be considered as financial advice or trading recommendations.
Risk Warning: Trading involves substantial risk of loss and is not suitable for all investors. Past performance of any trading system or methodology is not necessarily indicative of future results. The high degree of leverage can work against you as well as for you.
Important Notes:
Always conduct your own analysis before making trading decisions
Use appropriate position sizing and risk management strategies
Never risk more than you can afford to lose
Consider your investment objectives, experience level, and risk tolerance
Seek advice from qualified financial professionals when needed
Performance Disclaimer: Backtesting results do not guarantee future performance. Market conditions change constantly, and what worked in the past may not work in the future. Always paper trade new strategies before risking real capital.

Anrazzi - EMAs/ATR - 1.0.2The Anrazzi – EMAs/ATR indicator is a multi-purpose overlay designed to help traders track trend direction and market volatility in a single clean tool.
It plots up to six customizable moving averages (MAs) and an Average True Range (ATR) value directly on your chart, allowing you to quickly identify market bias, dynamic support/resistance, and volatility levels without switching indicators.
This script is ideal for traders who want a simple, configurable, and efficient way to combine trend-following signals with volatility-based position sizing.
📌 Key Features
Six Moving Averages (MA1 → MA6)
Toggle each MA on/off individually
Choose between EMA or SMA for each
Customize length and color
Perfect for spotting trend direction and pullback zones
ATR Display
Uses Wilder’s ATR formula (ta.rma(ta.tr(true), 14))
Can be calculated on current or higher timeframe
Adjustable multiplier for position sizing (e.g., 1.5× ATR stops)
Displays cleanly in the bottom-right corner
Custom Watermark
Displays symbol + timeframe in top-right
Adjustable color and size for streamers, screenshots, or clear charting
Compact UI
Organized with group and inline inputs for quick configuration
Lightweight and optimized for real-time performance
⚙️ How It Works
MAs: The script uses either ta.ema() or ta.sma() to compute each moving average based on the user-selected type and length.
ATR: The ATR is calculated using ta.rma(ta.tr(true), 14) (Wilder’s smoothing), and optionally scaled by a multiplier for easier use in risk management.
Tables: ATR value and watermark are displayed using table.new() so they stay anchored to the screen regardless of zoom level.
📈 How to Use
Enable the MAs you want to track and adjust their lengths, type, and colors.
Enable ATR if you want to see volatility — optionally select a higher timeframe for broader context.
Use MAs to:
Identify overall trend direction (e.g. price above MA20 = bullish)
Spot pullback zones for entries
See when multiple MAs cluster together as support/resistance zones
Use ATR value to:
Size your stop-loss dynamically (e.g. stop = entry − 1.5×ATR)
Detect volatility breakouts (ATR spikes = market expansion)
🎯 Recommended For
Day traders & swing traders
Trend-following & momentum strategies
Volatility-based risk management
Traders who want a clean, all-in-one dashboard

EMA 50/200 Pullback + RSI/SMA RSI
Strategy Description: EMA 50/200 Pullback + RSI/SMA RSI
1. Trend Identification with EMA:
Uses two Exponential Moving Averages (EMA): a fast EMA (default 50) and a slow EMA (default 200).
When the fast EMA crosses above the slow EMA (bullish crossover), an uptrend is identified.
When the fast EMA crosses below the slow EMA (bearish crossover), a downtrend is identified.
The lengths of both EMAs are fully customizable.
2. EMA Distance Condition:
Signals are only valid when the absolute percentage distance between the two EMAs is within a user-defined range (default: 0.4% to 1%).
This helps filter out weak signals when the EMAs are too close or too far apart.
3. Pullback Condition:
After a new trend is detected (EMA crossover), the strategy waits for the price to pull back to touch or cross the fast EMA (EMA 50).
This ensures entries are not taken immediately at the crossover, but after a retracement to a dynamic support/resistance area.
4. RSI Confirmation:
Uses the RSI indicator (default 14) and its Simple Moving Average (SMA RSI, default 14).
Buy signal: RSI crosses above its SMA.
Sell signal: RSI crosses below its SMA.
Both RSI and SMA RSI lengths are fully customizable.
5. Entry Rules:
The indicator only gives the first buy/sell signal after each EMA crossover (start of a new trend), and will not repeat signals until the next EMA crossover.
Buy signal:
Fast EMA crosses above slow EMA
EMA distance is within the valid range
Price pulls back to the fast EMA
RSI crosses above its SMA
Sell signal:
Fast EMA crosses below slow EMA
EMA distance is within the valid range
Price pulls back to the fast EMA
RSI crosses below its SMA
6. Customization:
All parameters (EMA lengths, RSI length, SMA RSI length, EMA distance range) can be adjusted in the indicator’s settings.
Note:
This is a signal indicator, not a complete trading strategy. For real trading, always combine with risk management and additional confirmations.
MFS-3 Bars Pattern Strategy3 Bar Pattern Strategy
Detects an Ignite Candle followed by a Pullback Candle followed by a Confirmation Candle.
A Box will be drawn around the setup and three arrows will identify I, P, C (Ignite, Pullback, Confirmation) the setup.
The strategy will calculate a Stop Loss below the Low Price of the Ignite candle and a Take Profit at 2 times the Stop Loss giving a Risk to Reward Ratio of 1:2.
Extra conditions are included to reduce false triggers:
- A down trend must be detected using 3 SMA (Long, Medium, Short) that should be aligned from Long to Short one above the other.
- The Ignite Candle's body must be BELOW the Short SMA
An input form is available to adjust some strategy parameters.
Performance Note
----------------------
Trading conditions are very strict, so most of the time, no signals will be detected in the Strategy window.
This strategy should only be one of many strategies used for trade setups.
Hope you enjoy it.

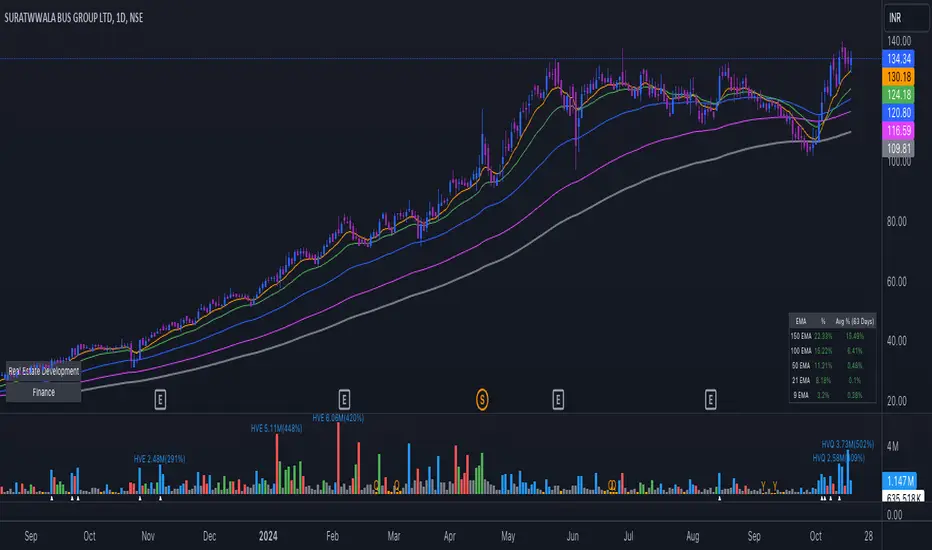
EMA Distance & Sector InfoThis indicator provides insights into price trends relative to Exponential Moving Averages (EMAs) and displays sector/industry information about the asset. Below is a detailed explanation of its purpose and what it is designed to achieve:
Purpose of the Code
The indicator offers two key functionalities:
1. Analyzing Price Distance from Multiple EMAs:
• Helps traders understand how far the current price is from key EMAs, expressed as a percentage.
• Calculates average percentage distances over a specified period (default: 63 days) to spot consistent trends or mean reversion opportunities.
• Useful for trend-following strategies, allowing the trader to see when the price is above or below important EMAs (e.g., 9, 21, 50, 100, and 150-period EMAs).
2. Displaying Asset Sector and Industry Information:
• Displays the sector and industry of the asset being analyzed (e.g., Technology, Consumer Goods).
• Provides additional context when evaluating performance across a specific sector or comparing an asset to its peers.
Who Would Use This Indicator?
This indicator is particularly helpful for:
1. Swing Traders and Positional Traders:
• They can use it to track whether the price is trading significantly above or below critical EMAs, which often signals overbought/oversold conditions or trend strength.
• The average percentage distances help to identify momentum shifts or pullback opportunities.
2. Sector/Industry-Focused Investors:
• Understanding an asset’s sector and industry helps investors gauge how the asset fits into the broader market context.
• This is valuable for sector rotation strategies, where investors shift funds between sectors based on performance trends.
How It Helps in Trading Decisions
1. Entry and Exit Points:
• If the price is far above an EMA (e.g., 21 EMA), it might indicate an overbought condition or a strong trend, while a negative percentage could signal a pullback or reversal opportunity.
• The average percentage distances smooth the fluctuations and reveal longer-term trends.
2. Contextual Information:
• Knowing the sector and industry is useful when analyzing trends. For example, if Technology stocks are doing well, and this asset belongs to that sector, it could indicate sector-wide momentum.
Summary of the Indicator’s Purpose
This code provides:
• EMA trend monitoring: Visualizes the price position relative to multiple EMAs and averages those distances for smoother insights.
• Sector and industry information: Adds valuable context for asset performance analysis.
• Decision-making support: Helps traders identify overbought/oversold levels and assess the asset within the broader market landscape.
In essence, this indicator is a multi-purpose tool that combines technical analysis (through EMA distances) with fundamental context (via sector/industry info), making it valuable for traders and investors aiming to time entries/exits or understand market behavior better.
Channel SurfingThis is my Channel Surfing indicator. It fires Buy and Sell signals based on multiple conditions. You can use EMAs or LSMAs. You will have to check the box of which moving averages to use once you add it to the chart. It plots EMAs or LSMAs using the different sources Close, Low, and High as the channel to surf. It fires a Buy signal if price crosses the channel up and if there is a pullback into the channel followed by a breakout to the upside. It fires a Sell signal if price crosses the channel down and if there is a pullback into the channel followed buy a breakdown to the down side. I find it works great on the 5 minute SPY chart and the 1 minute chart of ES with the default settings when scalping. You are able to switch between 2 different channels using LSMAs or EMAs. The EMAs has an optional LSMA slope filter for getting rid of some false signals. Let me know if you guys find any other settings or ways to use this and as always I hope it helps.

IsPullbackPivotRetested experimentThe indicator counts how often a pullback that starts outside the Keltner Channel resolves or fails.
Resolves: the pullback high or low is retested.
Fails: price goes outside the oppositie side of the Keltner Channel.

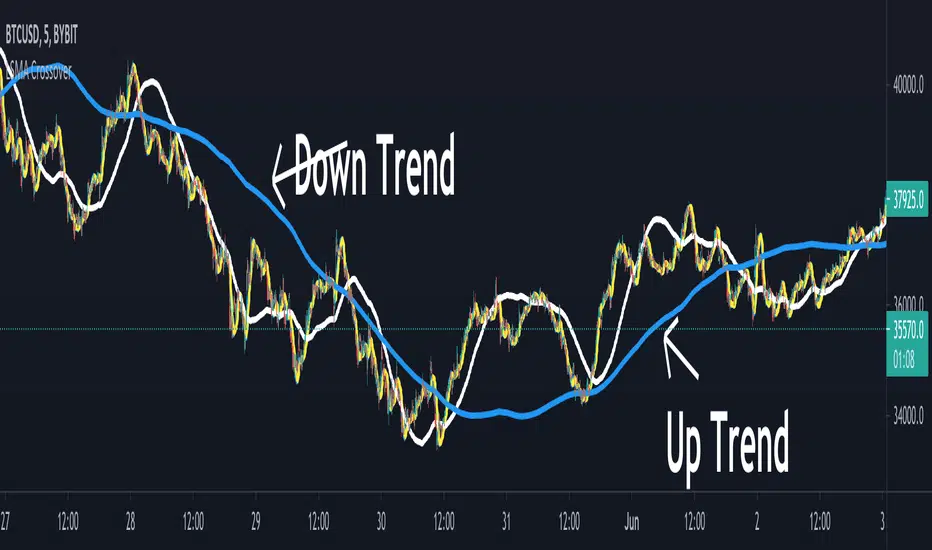
LSMA CrossoverThis is a simple script designed to help filter out bad trades. LSMA is a trend king and by using the 21,200 and 1000 length lines traders can get a clear view of where price action is travelling. This indicator is the perfect companion to the LSMA Wave Rider indicator. Once a pullback is discovered (price action crosses under blue or white line) Traders can use LSMA Wave Rider to locate perfect entry point.
Least Squares Moving Average follows these rules:
When price crosses over it signals a bull trend.
When price crosses under it signals bear trend.
When price stays close or on the line sideways action is to be expected.
The direction of the line shows the direction of the trend.
Here is an example of finding good trades. Price action pulls below white or blue line.
Another example of what a pullback looks like.
This example shows how to find trend using crossovers.
Another example how trend can be found but by using line direction.
LSMA Wave Rider can be found here:
Everyday 0003 _ MAC Pullback I recently posted a Moving Averge Crossover strategy for my Everyday project - a project I've given myself where I try to create one strategy everyday in between 15 minutes and 2 hours.
In the comments of my last published idea, user SignalTradersUK was very kind and suggested I try the following in my next study:
"i think your next study should be, to workout what to do after the Moving Average cross! If you look just on the chart you have posted, Price would appear to always come back to the levels where the 2 MA's cross and then go back in the direction of the crossing of the MA's. It's a great pull back strategy."
I'm really just beginning to learn about coding strategies so I'm not 100% sure I correctly understood his suggestion.
I admit I had difficulties wrapping my head around how to do this.
Anyway, the result is a strategy which runs alongside the main Moving Average Crossover.
'The Algorithm'
When the fast and slow MA cross the strategy traces back 40 days to find a swing low.
This swing low and the price at the MA cross is used to calculate a fib 1.272 extension.
The price at this 1.272 extension is used to place a Pullback short order.
Since we're shorting a bull trend, a tight stop is used.
If the pullback reaches down to the fib 0.618 we take profit (close the short).
Like I said, I don't know if I correctly understood SignalTradersUK feedback, but I really appreciate the
feedback and advice!
As always I'm hoping to learn from the community, so all feedback, corrections and advice is very welcome!
Thanks!
/pbergden

Swift-like Algo (V1) Trend Pullback ATR Risk AlimojanidThis indicator is a simple, rule-based trend-following system designed to help identify potential LONG and SHORT opportunities using market structure, momentum, and volatility.
It is inspired by professional “algo-style” tools, but built from scratch for learning, transparency, and flexibility.
🔹 How it works
1️⃣ Trend Detection
Uses Fast EMA vs Slow EMA
Only looks for:
LONGs in bullish trends
SHORTs in bearish trends
2️⃣ Entry Logic
Waits for a pullback toward the fast EMA
Confirms direction using price behavior
Optional RSI filter to avoid weak momentum trades
3️⃣ Risk Management
Stop Loss (SL) and Take Profit (TP) levels are calculated using ATR
Risk is defined in R-multiples (TP1, TP2)
Designed to adapt to market volatility
4️⃣ Visual & Alerts
Clear LONG / SHORT arrows
Automatic SL / TP level plotting
Built-in alert conditions for trade notifications
⚙️ Settings You Can Adjust
EMA lengths (trend sensitivity)
RSI confirmation (on/off)
ATR stop size
Risk-reward targets
Cooldown bars to avoid over-trading
⚠️ Disclaimer
This indicator is NOT a guaranteed trading system and should not be used as financial advice.
Always:
Backtest on your own market and timeframe
Use proper risk management
Paper trade before using real funds
The author is not responsible for any trading losses.
💡 Notes
Best used on trending markets
Works on Forex, Crypto, Indices, and Commodities
Timeframes: 15m and higher recommended

Sensex / Nifty Trend + Pullback (High Probability)Below is a Sensex / Nifty–optimized, error-proof, copy-paste ready Pine Script (v5) using a Trend + Pullback strategy.
This is designed for index trading, avoids repainting, and works cleanly on 15m / 30m / 60m charts.

Quality-Controlled Trend Strategy v2 (Expectancy Focused)This script focuses on quality control rather than curve-fitting.
No repainting, no intrabar tricks, no fake equity curves.
It uses confirmed-bar entries, ATR-based risk, and clean trend logic so backtests reflect what could actually be traded live.
If you publish scripts, this is the minimum structure worth sharing.
Why this script exists
TradingView’s public scripts are flooded with:
repainting indicators
no stop-loss logic
curve-fit entries that collapse live
strategies that look good only in hindsight
This script is intentionally boring but honest.
No repainting.
No intrabar tricks.
No fake equity curves
The goal is quality control, not hype.
What this strategy enforces
✔ Confirmed bars only
✔ Single source of truth for indicators
✔ Fixed risk structure
✔ No signal repainting
✔ Clean exits with unique IDs
✔ Works on any liquid market
Trading Logic (simple & auditable)
Trend filter
EMA 50 vs EMA 200
Entry
Pullback to EMA 50
RSI confirms momentum (not oversold/overbought)
Risk
ATR-based stop
Fixed R:R
One position at a time
This is the minimum bar for a strategy to be considered publish-worthy.
Why this helps TradingView quality
Most low-value scripts fail because they:
hide repainting logic
skip exits entirely
use inconsistent calculations
rely on hindsight candles
This strategy forces discipline:
every signal is confirmed
every trade has defined risk
behavior is repeatable across symbols & timeframes
If more scripts followed this baseline, TradingView’s public library would be far more usable.

S&D Trend Pullback StrategyThis is simple indicator for myself to alert me when in trend pullback and entry.
Use in M5 chart.
SL put 30-50pips
TP can set 30-90pips

Golden Zone Structure [Kodexius]Golden Zone Structure is a ZigZag based market structure and Fibonacci tool designed to make swing context easier to read directly on the price chart. It detects meaningful pivot highs and lows, labels the evolving structure (HH, HL, LH, LL, including equal highs and lows), and automatically projects a Fibonacci map across the most recent completed swing.
Instead of forcing you to manually anchor Fib tools after every new leg, the script rebuilds levels each time a fresh pivot is confirmed. This makes it well suited for traders who focus on swing continuation, pullback depth, and reaction zones where liquidity and orderflow often concentrate.
A key emphasis is the Golden Zone highlight. The indicator shades the zone that is most relevant to the current swing context so you can quickly spot where a retracement is approaching a higher probability reaction area, without cluttering the chart with too many permanent objects.
The tool is intentionally visual and configurable. You can choose pivot source (High/Low or Close), adjust swing sensitivity via ZigZag period, switch color themes, and decide how much detail you want on screen (levels, zigzag lines, labels).
Optional trading markers can be enabled for users who want a lightweight “zone interaction” prompt. These markers are not intended as a standalone trading system. They are meant to complement your own confirmation rules (structure alignment, volume, higher timeframe bias, or price action triggers).
🔹Features
🔸 ZigZag Swing Engine
- Uses a configurable ZigZag period to filter noise and confirm swing points only when the lookback logic validates the move.
Supports different pivot sources (High/Low or Close) so you can choose between cleaner structure or more reactive behavior depending on the instrument.
Optional ZigZag leg drawing to visualize swing flow without clutter.
🔸 Market Structure Labels (HH, HL, LH, LL + Equals)
- Automatically labels each confirmed pivot based on how it compares to the prior pivot of the same type.
High side classification: H, HH, LH, EH.
Low side classification: L, HL, LL, EL.
Equal highs and lows help reveal potential liquidity pools and “magnet” areas where price often reacts or breaks with intent.
🔸 Auto Fibonacci Map on the Active Swing
- Rebuilds Fibonacci levels every time a new pivot is confirmed, keeping the projection aligned with the most recent completed leg.
Core retracement levels: 0.236, 0.382, 0.500, 0.618, 0.786.
Extension levels: 1.272 and 1.618 for expansion targeting and continuation mapping.
Optional price labels on each level, formatted to tick size so levels remain readable across markets.
🔸 Golden Zone Highlighting (Context Aware)
- Highlights the most relevant retracement band with a soft fill so you can spot “zone approach” moments at a glance.
The zone selection adapts to swing context, focusing on a different retracement region depending on whether the last confirmed pivot is a peak or a trough.
Adjustable transparency keeps the chart clean while preserving the key reaction area.
🔸 Visual Customization + Themes
- Multiple color themes (Neon, Ocean, Sunset, Monochrome) so the tool fits different chart styles and backgrounds.
Independent toggles for Fib levels, Golden Zone shading, ZigZag lines, and price labels.
Line width controls for better scaling across timeframes.
🔸 Optional Trading Markers + Alerts
- Optional BUY and SELL labels based on zone interaction logic with candle confirmation filters.
ATR based placement offset scaled by sensitivity so labels stay visually separated during volatility.
Built in alert conditions for new pivot highs and new pivot lows so you can monitor structure changes without watching every bar.
▶ Practical Usage Tip
• Use structure labels to define bias (HH + HL for bullish structure, LH + LL for bearish structure).
• Use the Golden Zone as a location filter, then wait for your own trigger (break of minor structure, rejection candle, volume shift, etc.).
• Treat extensions as “map points” not guaranteed targets. They work best when structure supports continuation.

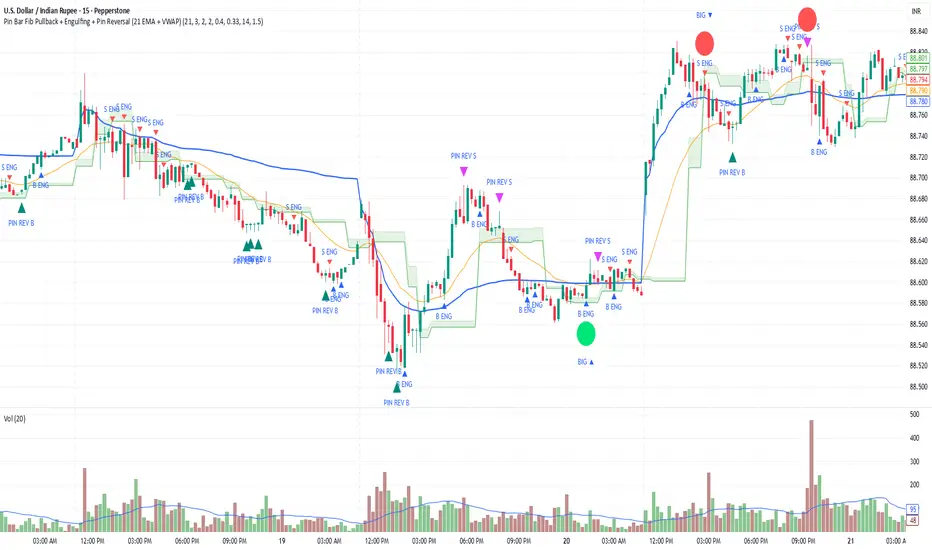
Pin Bar Fib Pullback + Engulfing + Pin Reversal (21 EMA + VWAP)Dear Traders
Pin bar fib pullback continuation (in 0.50–0.618 zone)
Bullish/Bearish engulfing
Pin bar reversals (bottom/top)
Then we ask: did the next candle move at least atrMult × ATR away from the signal close in the right direction?
For a long signal: next high ≥ signal close + ATR * atrMult
For a short signal: next low ≤ signal close − ATR * atrMult
If yes, that signal gets a big circle with text:
BIG ▲ for long
BIG ▼ for short
drawn on the original signal bar (using offset = -1 trick).
You can tune how “big” you want:
Increase ATR length for smoother ATR
Increase ATR * (e.g., from 1.5 → 2.0) to only mark really strong moves.
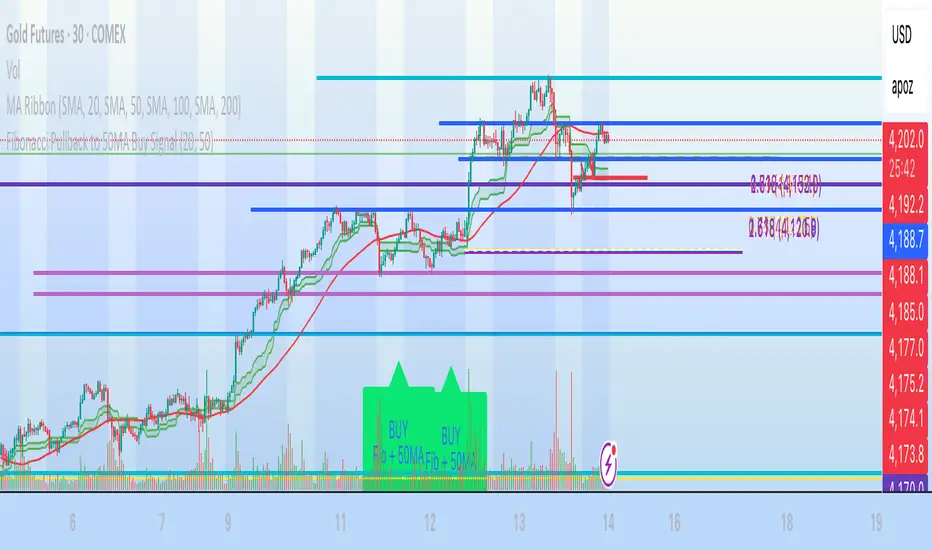
Fibonacci Pullback to 50MA Buy Signal// === CONDITIONS FOR BUY SIGNAL ===
// 1. Price must be inside the fib pullback zone
inFibZone = low <= fib50 and low >= fib618
// 2. Price must touch or approach the 50MA
touchMA = low <= ma50 * 1.002 and low >= ma50 * 0.998 // within 0.2%
// 3. Optional confirmation – bullish candle
reversalCandle = close > open
// FINAL BUY SIGNAL CONDITION
buySignal = inFibZone and touchMA and reversalCandle
// === MARK BUY SIGNAL ===
plotshape(buySignal, style=shape.labelup, color=color.lime, size=size.large,
location=location.belowbar, text="BUY\nFib + 50MA")