Forex Session TrackerForex Session Tracker - Professional Trading Session Indicator
The Forex Session Tracker is a comprehensive and visually intuitive indicator designed specifically for forex traders who need precise tracking of major global trading sessions. This powerful tool helps traders identify active market sessions, monitor session-specific price ranges, and capitalize on volatility patterns unique to each trading period.
Understanding when major financial centers are active is crucial for forex trading success. This indicator provides real-time visualization of the Tokyo, London, New York, and Sydney trading sessions, allowing traders to align their strategies with peak liquidity periods and avoid low-volatility trading windows.
---
Key Features
📊 Four Major Global Trading Sessions
The indicator tracks all four primary forex trading sessions with precision:
- Tokyo Session (Asian Market) - Captures the Asian trading hours, ideal for JPY, AUD, and NZD pairs
- London Session (European Market) - Monitors the most liquid trading period, perfect for EUR, GBP pairs
- New York Session (American Market) - Tracks US market hours, essential for USD-based currency pairs
- Sydney Session (Pacific Market) - Identifies the opening of the trading week and AUD/NZD activity
Each session is fully customizable with individual color schemes, making it easy to distinguish between different market periods at a glance.
🎯 Session Range Visualization
For each active trading session, the indicator automatically:
- Draws rectangular boxes that highlight the session's time period
- Tracks and displays session HIGH and LOW price levels in real-time
- Creates horizontal lines at session extremes for easy reference
- Positions session labels at the center of each trading period
- Updates dynamically as new highs or lows are formed within the session
This visual approach helps traders quickly identify:
- Session breakout opportunities
- Support and resistance zones formed during specific sessions
- Range-bound vs. trending session behavior
- Key price levels that institutional traders are watching
📱 Live Information Dashboard
A sleek, professional information panel displays:
- Real-time session status - Instantly see which sessions are currently active
- Color-coded indicators - Green dots for active sessions, gray for closed sessions
- Timezone information - Confirms your current timezone settings
- Customizable positioning - Place the dashboard anywhere on your chart (Top Left, Top Right, Bottom Left, Bottom Right)
- Adjustable size - Choose from Tiny, Small, Normal, or Large text sizes for optimal visibility
The dashboard provides at-a-glance awareness of market conditions without cluttering your chart analysis.
⚙️ Extensive Customization Options
Every aspect of the indicator can be tailored to your trading preferences:
Session-Specific Controls:
- Enable/disable individual sessions
- Customize colors for each trading period
- Adjust session times to match your broker's server time
- Toggle background highlighting on/off
- Show/hide session high/low lines independently
General Settings:
- UTC Offset Control - Adjust timezone from UTC-12 to UTC+14
- Exchange Timezone Option - Automatically use your chart's exchange timezone
- Background Transparency - Fine-tune the opacity of session highlighting (0-100%)
- Session Labels - Show or hide session name labels
- Information Panel - Toggle the live status dashboard on/off
Style Settings:
- Turn session backgrounds ON/OFF directly from the Style tab
- Maintain clean charts while keeping all analytical features active
🔔 Built-in Alert System
Stay informed about session openings with customizable alerts:
- Tokyo Session Started
- London Session Started
- New York Session Started
- Sydney Session Started
Set up notifications to never miss important market opening periods, even when you're away from your charts.
---
How to Use This Indicator
For Day Traders:
1. Identify High-Volatility Periods - Focus your trading during London and New York session overlaps for maximum liquidity
2. Monitor Session Breakouts - Watch for price breaks above/below session highs and lows
3. Avoid Low-Volume Periods - Recognize when major sessions are closed to avoid false signals
For Swing Traders:
1. Mark Key Levels - Use session highs and lows as support/resistance zones
2. Track Multi-Session Patterns - Observe how price behaves across different trading sessions
3. Plan Entry/Exit Points - Time your trades around session openings for better execution
For Currency-Specific Traders:
1. JPY Pairs - Focus on Tokyo session movements
2. EUR/GBP Pairs - Monitor London session activity
3. USD Pairs - Track New York session volatility
4. AUD/NZD Pairs - Watch Sydney and Tokyo sessions
---
Technical Specifications
- Pine Script Version: 5
- Overlay Indicator: Yes (displays directly on price chart)
- Maximum Bars Back: 500
- Drawing Objects: Up to 500 lines, boxes, and labels
- Performance: Optimized for real-time data processing
- Compatibility: Works on all timeframes (recommended: 5m to 1H for session tracking)
---
Installation & Setup
1. Add to Chart - Click "Add to Chart" after copying the script to Pine Editor
2. Configure Timezone - Set your UTC offset or enable "Use Exchange Timezone"
3. Customize Colors - Choose your preferred color scheme for each session
4. Adjust Display - Enable/disable features based on your trading style
5. Set Alerts - Create alert notifications for session starts
---
Best Practices
✅ Combine with Price Action - Use session ranges alongside candlestick patterns for confirmation
✅ Watch Session Overlaps - The London-New York overlap (1300-1600 UTC) typically shows highest volatility
✅ Respect Session Highs/Lows - These levels often act as intraday support and resistance
✅ Adjust for Your Broker - Verify session times match your broker's server clock
✅ Use Multiple Timeframes - View sessions on both lower (15m) and higher (1H) timeframes for context
---
Why Choose Forex Session Tracker Pro?
✨ Professional Grade Tool - Built with clean, efficient code following TradingView best practices
✨ Beginner Friendly - Intuitive design with clear visual cues
✨ Highly Customizable - Adapt every feature to match your trading style
✨ Performance Optimized - Lightweight code that won't slow down your charts
✨ Actively Maintained - Regular updates and improvements
✨ No Repainting - All visual elements are fixed once the session completes
---
Support & Updates
This indicator is designed to provide reliable, accurate session tracking for forex traders of all experience levels. Whether you're a scalper looking for high-volatility windows or a position trader marking key institutional levels, the Forex Session Tracker Pro delivers the insights you need to make informed trading decisions.
Happy Trading! 📈
---
Disclaimer
This indicator is a tool for technical analysis and should be used as part of a comprehensive trading strategy. Past performance does not guarantee future results. Always practice proper risk management and never risk more than you can afford to lose. Trading forex carries a high level of risk and may not be suitable for all investors.
Tìm kiếm tập lệnh với "range"

ADR - Average Daily Range [KasTrades]This is an Average Daily Range (ADR) indicator.
There are two settings for ADR:
Two Look back period ADR range (e.g. 7 and 14 days)
One Look back period ADR (e.g. 5 days only)
Two day ADR ranges are typically used in equities and index futures whereas one day ADR is typically used in forex.
The opening time by default is 17:00 New York (Eastern) time. The ranges are always calculated from the opening price of the first bar on the respected timeframe.

Monday's Range Superpowerkyu🔔 Settings
You can customize the colors and toggle ON/OFF in the indicator settings.
Works on daily, hourly, and minute charts.
Easily visualize Monday’s high, low, and mid-line range.
📌 1. Support & Resistance with Monday’s Range
Monday High: Acts as the first resistance of the week.
◽ Example: If price breaks above Monday’s high after Tuesday, it signals potential bullish continuation → long setup.
Monday Low: Acts as the first support of the week.
◽ Example: If price breaks below Monday’s low, it signals bearish continuation → short setup.
📌 2. Mid-Line Trend Confirmation
Monday Mid-Line = average price of Monday.
Price above mid-line → bullish bias.
Price below mid-line → bearish bias.
Use mid-line breaks as entry confirmation for long/short positions.
📌 3. Breakout Strategy
Break of Monday’s High = bullish breakout → long entry.
Break of Monday’s Low = bearish breakout → short entry.
Place stop-loss inside Monday’s range for a conservative approach.
📌 4. False Breakout Strategy
If price breaks Monday’s high/low but then falls back inside Monday’s range, it is a False Breakout.
Strategy: Trade in the opposite direction.
◽ False Breakout at High → short.
◽ False Breakout at Low → long.
Stop-loss at the wick (extreme point) of the failed breakout.
📌 5. Range-Based Scalping
Use Monday’s high and low as a trading range.
Sell near Monday’s High, buy near Monday’s Low, repeat until breakout occurs.
📌 6. Weekly Volatility Forecast
Narrow Monday range → higher chance of strong trend later in the week.
Wide Monday range → lower volatility expected during the week.
📌 7. Pattern & Trend Analysis within Monday Range
Look for candlestick patterns around Monday’s High/Low/Mid-Line.
◽ Example: Double Top near Monday’s High = short setup.
◽ Repeated bounce at Mid-Line = strong long opportunity.
✅ Summary
The Monday’s Range (Superpowerkyu) Indicator helps traders:
Identify weekly support & resistance
Confirm trend direction with Mid-Line
Trade breakouts & false breakouts
Apply range scalping strategies
Forecast weekly volatility
⚡ Especially, the False Breakout strategy is powerful as it captures failed moves and sudden sentiment reversals.

Objective Doji Highlight (Range-Relative)This indicator highlights Doji candles using an objective, mathematics-based rule: a bar is Doji when the absolute difference between its open and close is less than or equal to a user-defined fraction (x) of that bar’s high–low range.
How it works:
Compute body size as the absolute difference between open and close.
Compute the bar’s range as high minus low.
Classify as Doji when body size ≤ x × range.
Only Doji candles are colored; non-Doji bars remain unchanged.
Inputs
Doji threshold (x of range): tolerance (0–1) controlling how small the body must be relative to the range.
Doji Candle Color: visual color for detected Doji candles.
Example:
If x = 0.10 and a candle has high = 100 and low = 90 (range = 10), the maximum allowed body is 1.
If the difference between open and close is ≤ 1, the candle is marked as Doji.
Why it can be useful
Doji candles are often studied as signs of market indecision. This tool provides a clear, parameter-based way to identify them consistently across any timeframe, without discretionary interpretation.
Notes & limitations
Works with standard candlesticks (not Heikin Ashi, Renko, or other synthetic bar types).
Visualization and research only: it does not produce buy/sell signals and makes no performance claims.
No repainting from future data; the logic uses only the current bar’s prices.

Opening Range BreakoutOpen Range Breakout (ORB) – Trading Strategy Documentation
Definition:
The Open Range Breakout (ORB) is a short-term trading strategy that identifies the price range established during the initial period of market opening (typically the first 15 to 60 minutes) and uses the high and low of that range as key reference levels for potential breakout entries.
Components:
Open Range High: The highest price traded during the defined opening period.
Open Range Low: The lowest price traded during the same period.
Breakout Trigger: A price move above the Open Range High or below the Open Range Low, signaling potential continuation momentum.
How It Works:
Define the Opening Period: Select a time window (e.g., 30 minutes) at market open to establish the initial range.
Identify Range Boundaries: Record the high and low prices during this period.
Monitor for Breakout: Watch for price to break and close above the Open Range High (bullish breakout) or below the Open Range Low (bearish breakout).
Enter Trade: Enter long on a confirmed break above the Open Range High, or short on a break below the Open Range Low. Entry may be triggered on a retest of the broken level or with volume confirmation.
Set Stop-Loss and Target:
Stop-loss: Placed just inside the open range (e.g., below the high for long, above the low for short).
Profit target: Based on volatility (e.g., ATR multiple) or support/resistance levels.
Key Assumptions:
Early price action reflects initial market sentiment.
A breakout from this range indicates strong directional momentum likely to continue.
Best Conditions:
High liquidity markets (e.g., major indices, large-cap stocks).
Volatile or news-driven trading sessions.
Used primarily in intraday trading.
Limitations:
Prone to false breakouts during low-volume or choppy markets.
Requires strict risk management due to reliance on timing and confirmation.
Conclusion:
The ORB strategy capitalizes on early market momentum by trading breakouts from the initial price range. Its effectiveness depends on precise range definition, timely execution, and disciplined risk control.

Open Range Breakout Strategy With Multi TakeProfitHello everyone,
For a while, I’ve been wanting to develop new scripts, but I couldn’t decide what to create. Eventually, I came up with the idea of coding traditional and well-known trading strategies—while adding modern features such as multi–take profit options. For the first strategy in this series, I chose the Open Range Strategy .
For those unfamiliar with it, the Open Range Strategy is a trading approach where you define a specific time period at the beginning of a trading session—such as the first 15 minutes, 30 minutes, or 1 hour—and mark the highest and lowest prices within that range. These levels then act as reference points for potential breakouts: if the price breaks above the range, it may signal a long entry; if it breaks below, it may indicate a short entry. This method is popular among day traders for capturing early momentum in the market.
Since this strategy is generally used as an intraday strategy , I added a Trade Session feature. This allows you to define the exact time window during which trades can be opened. Once the session ends, all positions are automatically closed, ensuring trades remain within your chosen intraday period.
Even though it’s a relatively simple concept, I’ve come across many different variations of it. That’s why I created a highly customizable project. Under the Session Settings, you can select the time window you want to define as your range. Whether it’s the first 15-minute candle or the entire first hour, the choice is entirely yours.
For stop-loss placement, there are two different options:
Middle of the Range – The stop loss is placed at the midpoint between the high and low of the defined range, offering a balanced buffer for both bullish and bearish setups.
Top/Bottom of the Range – The stop loss is placed just beyond the range’s high for short trades or just below the range’s low for long trades, providing a more conservative risk approach.
I’ve always been a big fan of the multi take-profit feature, so I added two different take-profit targets to this project. Take profits are calculated based on a Risk-to-Reward Ratio, which you can adjust in the settings. You can also set different position sizes for each target, allowing you to scale out of trades in a way that suits your strategy.
The result is a flexible, user-friendly strategy script that brings together a classic approach with modern risk management tools—ready to be tailored to your trading style

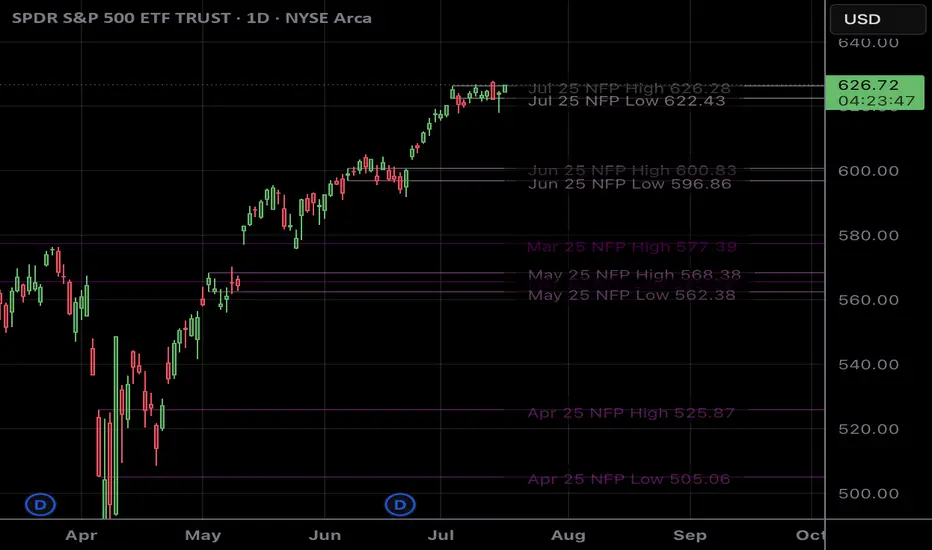
NFP RangesPlots the NFP daily ranges for NFP days. Includes extended hours ranges when the time frame is sub 1D, otherwise, only the daily range is taken.
NFP Dates are pre-populated through 2029 and historically through 2022. Will update script to include farther-out dates before they become necessary.
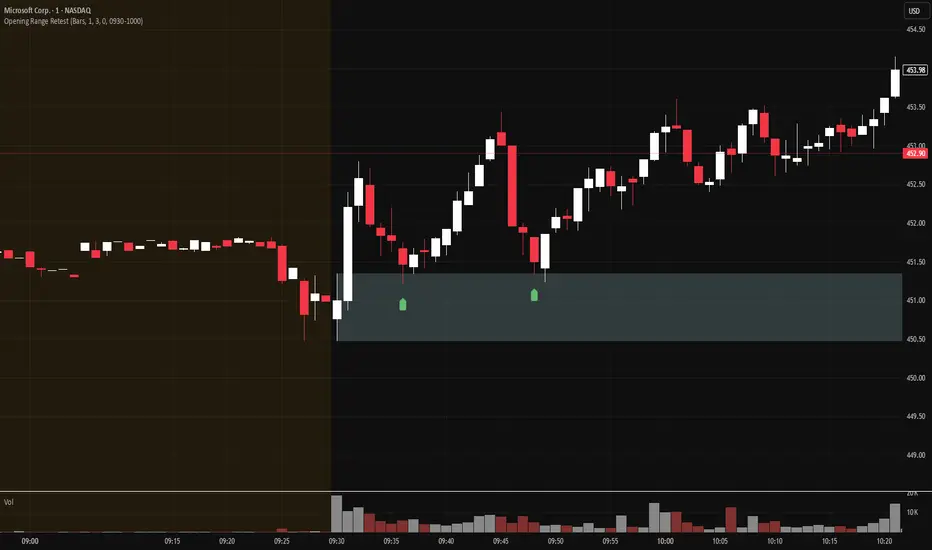
Opening Range Retest█ OVERVIEW
This indicator shows the opening range as a box. It also draws markers and triggers alerts when the opening range is retested. The opening range time is configurable, as is the period of time that must elapse before each return to the opening range is considered a retest.
█ FEATURES
Opening range time configurable in bars or minutes
Configurable "resting" period between the end of the opening range or since the last retest before a new retest is considered valid
Configurable tolerance so that a retest can trigger sooner
Active time range can be used to filter alerts and markers to a specific time window
Visual box showing the opening range, which can be optionally limited to the above-mentioned active time window
Well-documented, high-quality, open-source code for those interested
█ CONCEPTS
This indicator can be used for an opening range retest trading strategy, where long or short positions are taken on the retest of the opening range.
The opening range can be user-configured, so it is suitable for use with any opening range time period (e.g., 1-min, 5-min, 15-min, etc.).
The markers and alerts are equivalent, in the sense that whenever a marker appears, an alert will also trigger (assuming the user has set an alert up).
The alert active time range is simply used as a filter for markers and alerts, meaning that these will not draw or trigger outside of the specified time range.
█ LIMITATIONS
The indicator is intended for equities that have a highly active regular market open. For other security types, it will draw the opening range box from whenever TradingView specifies the market open time.
Gold ORB Strategy (15-min Range, 5-min Entry)The Gold ORB (Opening Range Breakout) Strategy is designed for day traders looking to capitalize on the price action in the early part of the trading day, specifically using a 15-minute range for identifying the opening range and a 5-minute timeframe for breakout entries. The strategy trades the Gold market (XAU/USD) during the New York session.
Opening Range: The strategy defines the Opening Range (ORB) between 9:30 AM EST and 9:45 AM EST using the highest and lowest points during this 15-minute window.
Breakout Entries: The strategy enters trades when the price breaks above the ORB high for a long position or below the ORB low for a short position. It waits for a 5-minute candle close outside the range before entering a trade.
Stop Loss and Take Profit: The stop loss is placed at 50% of the ORB range, and the take profit is set at twice the ORB range (1:2 risk-reward ratio).
Time Window: The strategy only executes trades before 12:00 PM EST, avoiding late-day market fluctuations and consolidations.

True Range & ATRDescription : This indicator plots both the True Range (TR) and the Average True Range (ATR) in a separate pane below the main chart.
- TR represents the absolute price movement range within each candle.
- ATR is a smoothed version of TR over a user-defined period (default: 14), providing insight into market volatility.
- TR is displayed as a histogram for a clearer view of individual candle ranges.
- ATR is plotted as a line to show the smoothed trend of volatility.
This indicator helps traders assess market volatility and potential price movements.

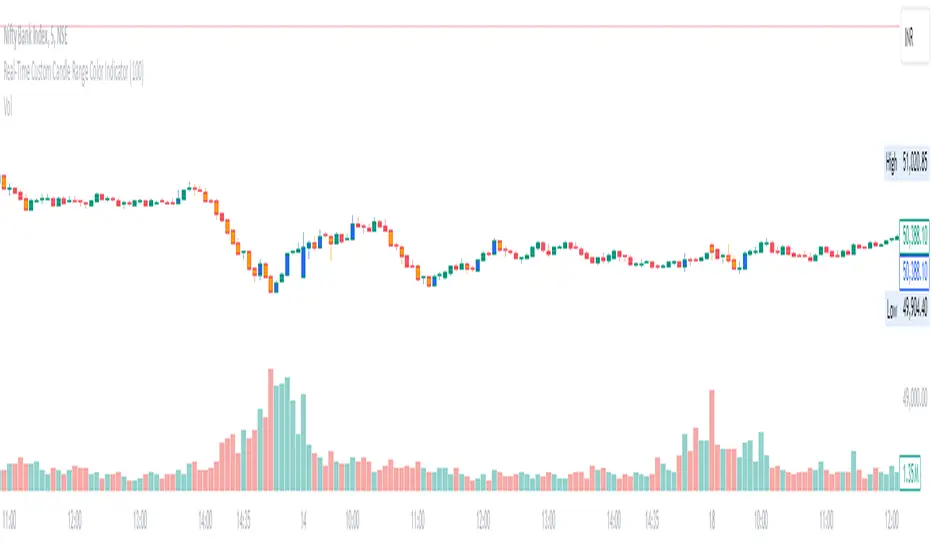
Real-Time Custom Candle Range Color Indicator
The script allows the user to input a custom range value (default set to 100 points) through the userDefinedRange variable. This value determines the minimum range required for a candle to change color.
Calculating Candle Range:
The script calculates the range of each candle by subtracting the low from the high price.
Determining Bullish or Bearish Candles:
It checks whether the close price is higher than the open price to determine if a candle is bullish (isBullish variable).
Coloring Candles:
Based on the custom range input, the script changes the color of the candles:
If the candle's range is greater than or equal to the custom range and it is bullish, the candle color is set to blue (bullishColor).
If the range condition is met and the candle is bearish, the color is set to orange (bearishColor).
If the range condition is not met, the color is set to na (not applicable).
Plotting Colored Candles:
The plotcandle function is used to plot candles with colors based on the custom range and bullish/bearish conditions. The candles will have a higher z-order to be displayed in front of default candles.
Displaying High and Low Price Points:
Triangular shapes are plotted at the high and low price levels using the plotshape function, with colors representing bullish (blue) and bearish (orange) conditions.
In trading, this indicator can help traders visually identify candles that meet a specific range criteria, potentially signaling strength or weakness in price movements. By customizing the range parameter, traders can adapt the indicator to different market conditions and trading strategies. It can be used in conjunction with other technical analysis tools to make informed trading decisions based on candlestick patterns and price movements.
Market Open Range Breakaway v1.2Script Name: Market Open Range Breakaway 1.2
This TradingView script, "Market Open Range Breakaway," highlights the market's opening range for a user-selected day of the week. It calculates the high and low prices during a specified period after the market opens, plots these levels, and tracks the opening price. The script dynamically adjusts for time zones and only displays data during market hours on the chosen day, with optional background shading for the defined range period.
Purpose: Identifies and highlights the market's opening range for a selected day of the week.
Features: Calculates and plots the high, low, and open price during the market's opening range.
Configurable range duration (e.g., 15, 30, or 60 minutes).
Automatically adjusts for different time zones.
Displays levels only during market hours on the target day.
Optional background shading for the opening range.
Inputs: Target day of the week.
Opening range duration.
Use Case: Ideal for traders looking to analyze breakout levels or price movements around the opening range.

Custom Time Range HighlighterCustom Time Range Highlighter
This versatile indicator allows traders to highlight specific time ranges on their charts, accommodating users worldwide by supporting customizable UTC offsets. Traders can define two distinct time ranges, setting start and end hours in their local time zone.
A toggle option enables the display of highlights for today only , ensuring focus on current trading conditions.
Ideal for day traders and those following specific market sessions, this tool enhances visibility of active trading periods and aids in effective trade management.

Austin's Range Filter with Trade SignalsAustin’s Range Filter with Trade Signals
Description:
Austin’s Range Filter with Trade Signals is a versatile indicator that combines a custom range filter with dynamic buy and sell signals based on EMA crossovers. This indicator is designed to help traders easily identify trend reversals and optimal trade entry/exit points.
Key Features:
• Range Filter Calculation: The indicator calculates the highest and lowest price over a user-defined period, then multiplies the difference by a customizable multiplier to establish a dynamic range. A combined middle band (average of the upper and lower bounds) is plotted for a clearer visual representation of the price trend.
• Exponential Moving Average (EMA): A user-configurable EMA is added, which acts as the primary signal line. You can adjust the length of the EMA to suit your trading style.
• Buy and Sell Signals:
• Buy Signal: Triggered when the price crosses above the EMA, indicating a potential upward trend.
• Sell Signal: Triggered when the price crosses below the EMA, indicating a potential downward trend.
• Alerts: Custom alert conditions for buy and sell signals allow you to set up real-time notifications when the signal changes, so you never miss an opportunity.
• Customizable Display: You can toggle the visibility of the combined band (purple) and the EMA (blue) for a cleaner chart.
How It Works:
• Buy when the price crosses above the EMA.
• Sell when the price crosses below the EMA.
• Background colors indicate whether the current price is above or below the calculated range, helping you visually identify bullish and bearish conditions.
Customization Options:
• Range Filter Length: The lookback period for the highest/lowest price calculation.
• Range Multiplier: Adjusts the size of the range.
• EMA Length: Set the length of the EMA to fine-tune the signal sensitivity.
• Toggle Lines: Show or hide the combined band and EMA for more flexibility.
This indicator is suitable for a variety of markets including stocks, forex, and crypto, and can be applied to any timeframe. Use it as part of your technical analysis to spot market trends and improve your decision-making process.
How to Use:
1. Apply the indicator to your chart and adjust the settings to suit your strategy.
2. Set up alerts for buy and sell signals to receive real-time notifications.
3. Monitor the price relative to the range and EMA to better time your trades.
This indicator is perfect for traders looking for an intuitive yet powerful tool to enhance their trading strategies with automatic signals and alerts.

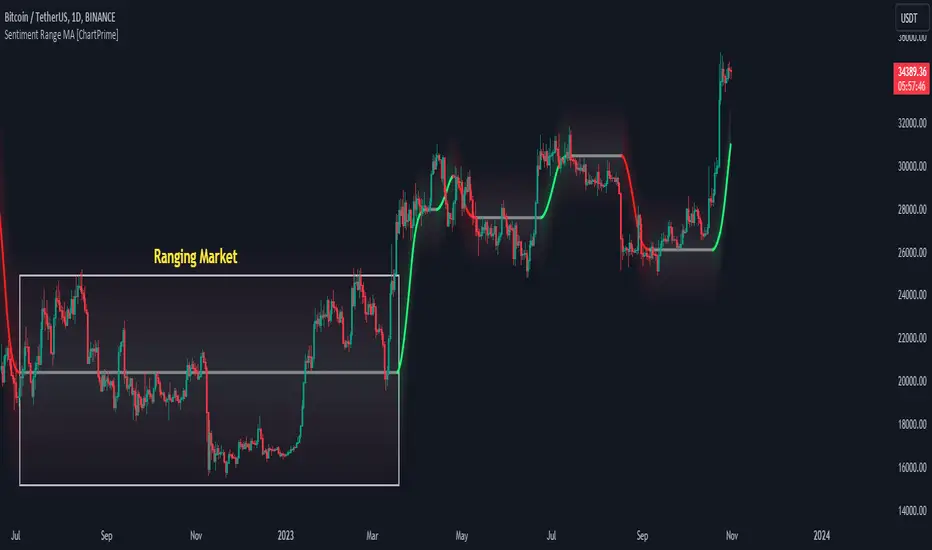
Sentiment Range MA [ChartPrime]The "Sentiment Range MA" provides traders with a dynamic perspective on market activity, emphasizing both stability in chop zones and quick adaptability outside of them.
Key Features:
Chop Zone Stability: In choppy markets, this indicator remains consistent, filtering out the noise to provide a clear view.
Quick Adaptability: Should the price break out of these zones, the indicator recalibrates promptly.
Dynamic Support and Resistance: Adapts based on the latest price action, serving as an evolving reference point.
Emphasis on Recent Levels: The tool factors in the latest notable market levels to stay relevant and timely.
Configurations:
Data Source: Choose your desired metric, though many default to the closing price.
Output Smoothing: Adjust the SR MA's response to market movements.
Trigger Smoothing: Refine boundary definitions based on your market insights.
ATR Period: Set the period for the ATR, influencing the surrounding boundary's width.
Range Multiplier: Control the ATR's effect on the range.
Range Switch: Flip between high-low and open-close values for range determination.
Visuals
Sentiment Range MA Line:
- This is the flowing line that transitions between green and red.
- When it's green, it indicates bullish momentum in the market. This suggests a prevailing upward trend and can be an entry cue for traders who trade with the trend.
- When it turns red, bearish sentiments dominate. It indicates the potential beginning of a downtrend or a continued downtrend. Traders might interpret this as a signal to be cautious, to short the market, or to exit long positions.
The Chop Zone:
- This is the space between the price candles and the Sentiment Range MA line. It represents a region where the price is considered to be moving sideways or without a clear direction. Price movements within the chop zone might not be substantial enough to warrant a trading decision. Only when the price breaks out of this zone do we see the Sentiment Range MA line change color, signaling a potential trading opportunity.
By interpreting these visuals, traders can make more informed decisions based on the prevailing market sentiment and trend. The chart becomes a tool, providing both an overview of the market condition and potential entry or exit points based on the Sentiment Range MA indicator's readings.
Detailed Settings Overview
Understanding the settings of the Sentiment Range MA Indicator can greatly enhance its utility in your trading strategy. Let's dive deeper into each:
Output Smoothing:
Purpose: It refines the SR MA to provide a clearer trend perspective.
Functionality:
- At `0`, it ensures the indicator responds immediately to price deviations from the chop zone.
- At higher values, it transforms the indicator into a volatility-adjusted moving average.
Filtering Modes:
- Single Filtering: Prioritizes speed.
- Double Filtering: Emphasizes stability.
Trigger Smoothing:
Purpose: Used for the range break detection.
Functionality: It dampens the indicator's sensitivity to sudden market volatility, preventing unnecessary triggers.
ATR Length:
Purpose: Governs the retrospective period for the chop zone.
Functionality:
- Higher values offer a more consistent and broad range size, capturing more historical data.
- Lower values allow for a more adaptive and responsive range.
Range Multiplier:
Purpose: Modifies the breadth of the range around the SR MA.
Functionality: Increasing the multiplier will extend the range, giving more leeway before triggering, while decreasing it will narrow the range, making the indicator more responsive to price changes.
Range Style:
Purpose: Decides which candlestick data is factored into the true range calculations.
Options:
- Body: Uses the open and close values.
- Wick: Accounts for the high and low values.
Functionality: Switching between styles lets you prioritize either the overall volatility (Wick) or just the concluded price action for a period (Body).
By fine-tuning these settings, traders can tailor the Sentiment Range MA Indicator to various market conditions and personal trading styles, ensuring optimal decision-making.
Quick Start
Based on the provided chart, here's a brief explanation of the default settings for the Sentiment Range MA Indicator:
Length: Set at ` 20 `.
- This determines the base moving average period. A standard setting, it calculates the average price over the last 20 periods, providing traders with a clear perspective of short-term trends.
ATR Length: Set at ` 200 `.
- This adjusts the lookback period for the Average True Range (ATR), which in turn influences the chop zone calculation. At a setting of 200, it offers a comprehensive view, considering a longer stretch of historical data.
Range Multiplier: Set at ` 6 `.
- This multiplies the ATR value, widening or narrowing the band around the SR MA. A setting of 6 means the range around the SR MA is determined by multiplying the ATR by 6, offering a broader fluctuation zone.
On the chart, the green line represents the bullish sentiment and the red represents the bearish sentiment. Price movements above and below these lines can be used as potential buy or sell signals respectively. Fine-tuning these settings can cater the Sentiment Range MA Indicator to your specific trading strategy and market condition preferences.
Alternative Settings
For traders looking to adapt to faster market conditions or prefer a more agile analysis, here's a brief description of the alternative settings for the Sentiment Range MA Indicator:
Length: Set at ` 3 `.
- This highly responsive setting calculates the average price over the last 3 periods. Ideal for quick market movements, it offers traders insights into very short-term price trends and potentially swift trade opportunities.
ATR Length: Set at ` 50 `.
- This shorter lookback period for the Average True Range (ATR) focuses on more recent market volatility, providing a tighter and more current chop zone calculation. It's suitable for those wanting to respond to recent market shifts.
Range Multiplier: Set at ` 4 `.
- Multiplying the ATR by 4 narrows down the buffer around the SR MA. This creates a tighter sentiment range, possibly resulting in more frequent crossovers and trading signals.
In the provided chart, the green line still denotes bullish momentum while the red symbolizes bearish sentiment. These alternative settings might generate more frequent signals, so traders should ensure their strategy is aligned with this heightened sensitivity.
Wrapping Up
The Sentiment Range MA melds stability and agility, making it a valuable tool in your trading toolkit. As always, before integrating new indicators, take the time to understand its nuances and potential impacts on your strategy.
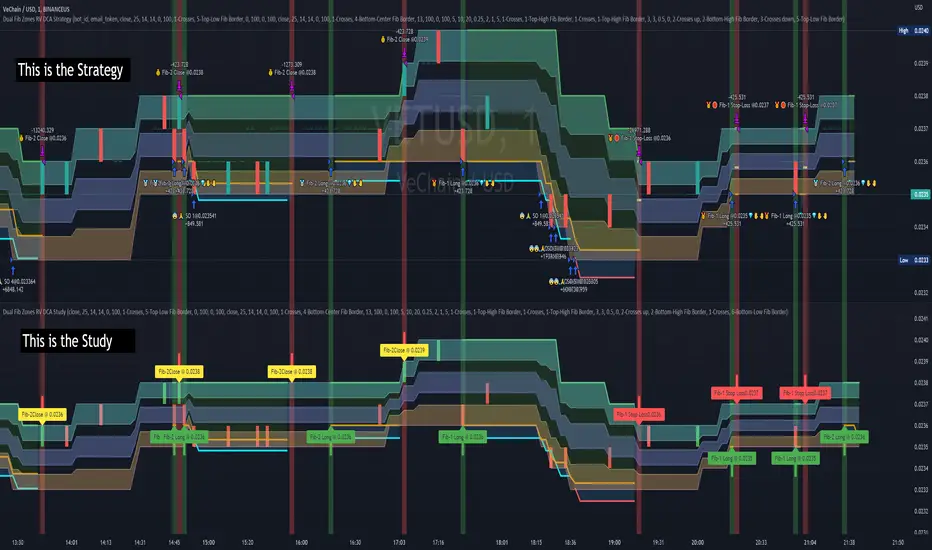
Dual Fibonacci Zones & Ranged Vol DCA Study - R3c0nTraderWhat does this do?
This signal script (aka Study) was created so it could be used with the corresponding strategy "Dual Fibonacci Zone & Ranged Vol DCA Strategy - R3c0nTrader" to create the buy and sell signals for 3Commas bots.
How to Use
Configure the study to match your settings you have set in the strategy. This script comes with an buy and sell alert conditions built-in. Just click to add alert and select Buy or Sell and paste in your bot messages.
Credits:
Thank you "EvoCrypto" for granting me permission to use "Ranged Volume" to create this study
Thank you "eykpunter" for granting me permission to use "Fibonacci Zones" to create this study
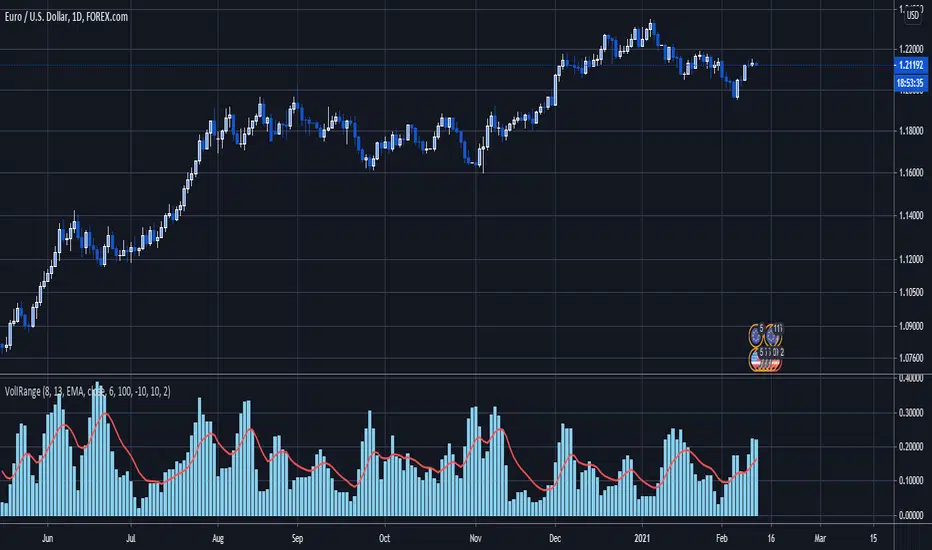
SVDThis indicator aims to compare between two charts if trader isn't sure which one is more active and powerful, it does NOT show entries or help your chart analysis directly.
The main features of this indicator is to show vitality and range of any given chart.
Volatility: it calculates the average profit of every swing in the range and the final result will be the chart volatility, which indicate how profitable this chart is.
Range: it calculates the profit of the whole range compared to the total price. (E.g. range bottom is 0.1 and range top is 0.2 the range will be 100%)
Extra: indicator shows the total direction of the chart in term of (STRONG UPTREND, UPTREND, SIDEWAYS, DOWNTREND, STRONG DOWNTREND), if you got (Somthing_wrong) please contact me.
How to use: apply the indicator on different charts that you have chosen and the higher (volatility & range) the more profitable the chart is.
inputs:
Lookback length: how long the range is (how many candles are included).
How intense should the Swing be: how many candles should be counted as a confirmation complete swing.
Show counted Swings: if checked as true, will show the swings counted in the volatility calculation.
For any notes on the indicator to be edited, or for another indicator ideas please comment.

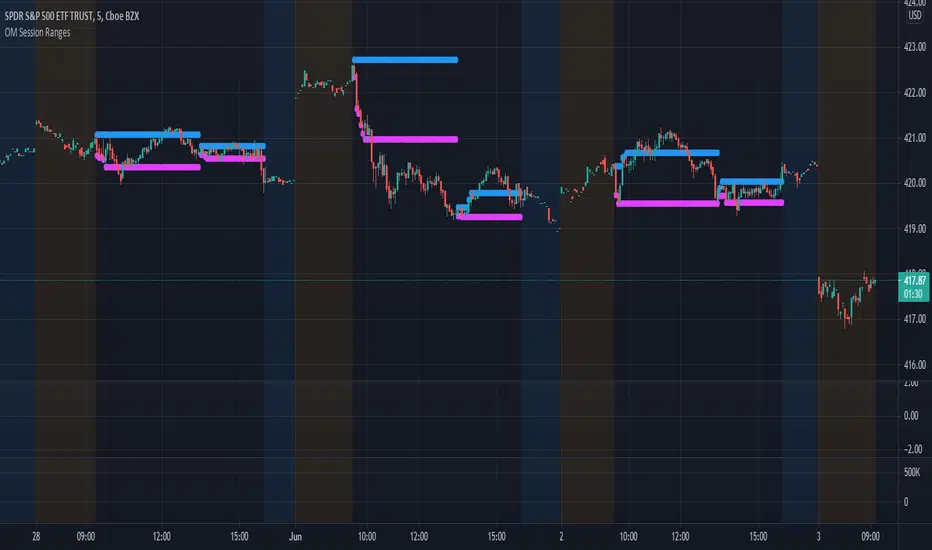
OM Session RangesThis indicator was created to assist in generating the morning and afternoon ranges as defined by Options Millionaire's strategy.
Morning range is determined by identifying the high and low from open to 10:05.
Afternoon range is determined by identifying the high and low from 13:30 to 14:05.
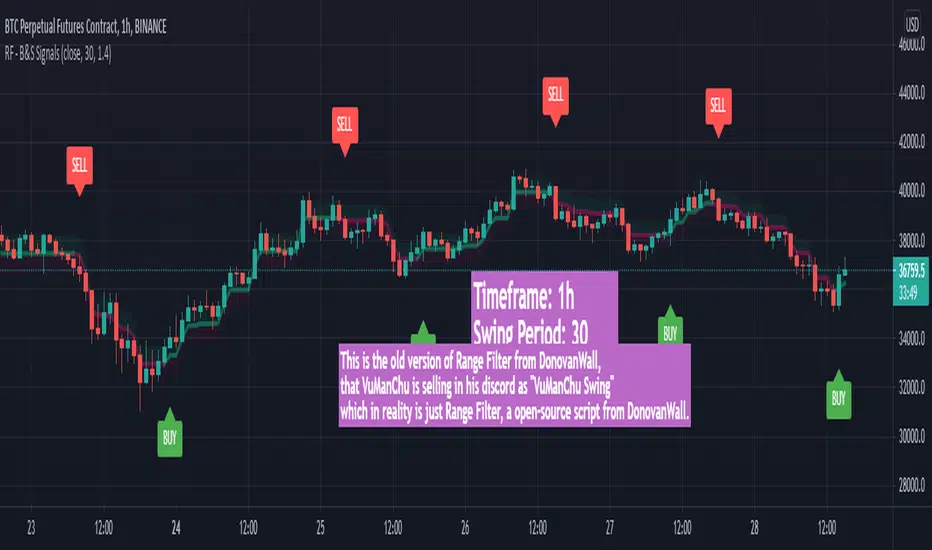
VuManChu Swing FreeThis is the old version of Range Filter from DonovanWall, that VuManChu is selling in his discord as "VuManChu Swing" which in reality is just Range Filter, a open-source script from DonovanWall.
Safe Scalpy Stop Loss. Percentage from price visualizer.This is my first script I have published so bear with me.
I have thrown this together so you can easily see on the chart where -0.5%, -1% and -2% would be from the last candle close. I also replicated these to show positive values in case you are shorting.
I have also added a custom value setting so you can set the line at whatever percentage value you like and included an adjustable recent higher high and higher low finder to help create a recent range as it seems to work well in tandem for scalping range based price movement.
You can turn all these things on and off in the settings on the style checkboxes.
I felt the need to make this because I like to scalp trade with leverage like a total degen from time to time. Often the setups happen very quickly. It is difficult to calculate where to set a stop loss in a hurry so I keep a fixed account size/lev and just vary the position percentage size based on the percentage of the stop loss from the current price.
Sometimes when switching from a lower volatility chart to high volatility one it is easy to get caught out by quickly entering a scalp trade only to find you made your position way too big or you shouldn't have entered at all. You thought it was only moving 0.2% per candle instead of 3%. Whoops. Rekt.
This indicator is all about trying to help me avoid that with a visual clue to back up the bad maths I do quickly in my head.
I often hide it and only show it when I'm ready to enter a position to double check my SL and entry are set in a sensible area.
I thought I would publish it in case someone else finds such a simple tool handy.
Apologies if there is already something out there that does this job. I couldn't find it.
See you all on the moon.

Trend Type Indicator by BobRivera990Usage:
The purpose of this indicator is to programmatically determine the type of price trend using technical analysis tools.
You can do a quick check on the asset’s higher and lower time frames. For example, if you are trading on an H1 chart, you can check the m5 chart to ensure that the trend is in the same direction and similarly check the H4 chart to ensure that the higher time frame price is also moving in the same direction.
If multiple time frame charts confirm a similar trend, then it is considered a very strong trend and ideal for Trend trading.
Remarks:
By default, the last status is related to 8 periods before the latest closing price.
Related definitions:
The three basic types of trends are up, down, and sideways.
1. Uptrend
An uptrend describes the price movement of a financial asset when the overall direction is upward. The uptrend is composed of higher swing lows and higher swing highs.
Some market participants ("long" trend traders) only choose to trade during uptrends.
2. Downtrend
A downtrend refers to the price action of a security that moves lower in price as it fluctuates over time.
The downtrend is composed of lower swing lows and lower swing highs.
3. Sideways
A sideways trend is the horizontal price movement that occurs when the forces of supply and demand are nearly equal. This typically occurs during a period of consolidation before the price continues a prior trend or reverses into a new trend.
How it works:
Step 1: Sideways Trend Detection
In this step we want to distinguish the sideways trend from uptrend and downtrend. For this purpose, we use two common technical analysis tools: ATR and ADX
1. Average True Range (ATR)
The average true range (ATR) is a technical analysis indicator that measures market volatility.
We also use a 20-period moving average of the ATR.
When the ATR is below the average of its last 20-periods, it means that the rate of price volatility has decreased and we conclude that the current trend is sideways
2. Average Directional Index (ADX)
The average directional index (ADX) is a technical analysis indicator used by some traders to determine the strength of a trend.
The trend has strength when ADX is above 25.
So when the ADX is less than or equal to 25, there is no strong trend, and we conclude that the current type of trend is sideways.
Step 2: Detect uptrend from downtrend
If it turns out that the current price trend is not sideways, then it is either uptrend or downtrend.
For this purpose, we use plus and minus directional Indicators (+ DI & -DI).
A general interpretation would be that during a strong trend, when +DI is higher than -DI, it is an uptrend. When -DI is higher than +DI, it is a downtrend.
Parameters:
"Use ATR …" ________________________// Use Average True Range (ATR) to detect Sideways Movements
"ATR Length"_______________________ // length of the Average True Range (ATR) used to detect Sideways Movements
"ATR Moving Average Type" ___________// Type of the moving average of the ATR used to detect Sideways Movements
"ATR MA Length" ____________________// length of the moving average of the ATR used to detect Sideways Movements
"Use ADX ..."_______________________ // Use Average Directional Index (ADX) to detect Sideways Movements
"ADX Smoothing”____________________// length of the Average Directional Index (ADX) used to detect Sideways Movements
"DI Length"_________________________// length of the Plus and Minus Directional Indicators (+DI & -DI) used to determine the direction of the trend
"ADX Limit" ________________________// A level of ADX used as the boundary between Trend Market and Sideways Market
"Smoothing Factor"__________________// Factor used for smoothing the oscillator
"Lag"______________________________// lag used to match indicator and chart
Resources:
www.investopedia.com

Volatility Index of Range Verification█ OVERVIEW
This is a volatility indicator created by extending concepts from Tushar Chande's Range Action Verification Index (RAVI).
█ CONCEPTS
This indicator constructs range of the RAVI indicator. It uses this range to build a histogram that represents how fast the range is changing, or a measure of volatility. A line is then constructed, either from a moving average or standard deviation depending on the settings that can serve as an action trigger.
█ INPUTS
• Fast MA Period: the period of the quickest moving average that is used to build the RAVI indicator line
• Slow MA Period: the period of the slowest moving average that is used to build the RAVI indicator line
• MA Type: the type of moving average to use, either Simple or Exponential
• Price Source: the type of price source to use; close, high, low, hlc3, etc.
• Lookback Period: how far back to construct the minimum and maximum of the range
• Standard Range: the standard range of the indicator. a smaller range will exaggerate differences in the columns, and vice-versa
• Volatility Period: the period used for the trigger line moving average
• Std. Deviation Mode?: Whether the trigger line will plot using a moving average or a multiple of Standard Deviation.
• Deviation Multiplier: How many deviations to use if the trigger line is in Std. Deviation Mode
Triple Average True Range Channel Definition: By ADAM HAYES from Investopedia -- Updated Jul 8, 2019
The average true range (ATR) is a technical analysis indicator that measures market volatility by decomposing the entire range of an asset price for that period. Specifically, ATR is a measure of volatility introduced by market technician J. Welles Wilder Jr. in his book, "New Concepts in Technical Trading Systems."
The true range indicator is taken as the greatest of the following: current high less the current low; the absolute value of the current high less the previous close; and the absolute value of the current low less the previous close. The average true range is then a moving average, generally using 14 days, of the true ranges.
I've added a channel perspective from a certain % from the Slow Average Length that user will have to configure depending of resolution and the markets instruments they chose...
Also a fill is used to easily point out when a high distance between a fast and a slow volatility analysis is occurring.
Which is also denotated with a shaped label...
Share and comment my work :)
