CBG Opening Range and Initial BalanceThis is a total re-write of my previous Opening Range indicator. All the same functionality with better code
Features
Opening Range and Initial Balance ranges (30 minutes and 1 hour defaults)
Overnight Range
Daily Open Price
Can select which midpoint: OR or IB
4 separate extensions (up and down) based on either OR or IB
Shaded range area
All lines and shading can be turned on and off in the Style menu
Tìm kiếm tập lệnh với "range"
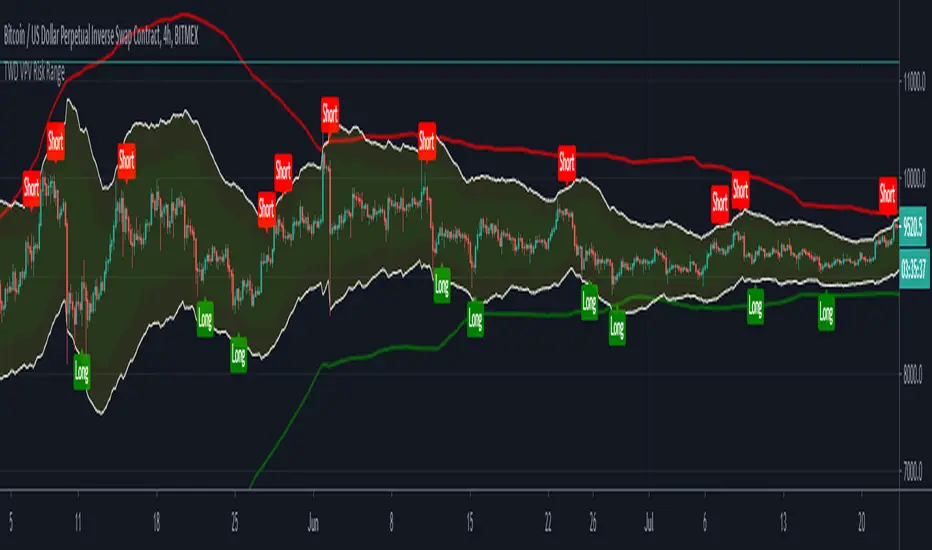
TWD VPV Risk RangeThe 'TradingWithDan Volume Price Volatility Risk Range' indicator identifies two risk ranges based on the volatility and volume of the underlying asset. It then uses those to identify when the trend towards the top or bottom of the risk range is potentially reversing and issues a 'long' or 'short' signal.
The larger risk range is identified by the red and green lines is used to visualise the larger context of the price movement so when the top of the smaller risk range approaches the larger risk range line then the upward trending movement is potentially reaching exhaustion and there is a greater risk of downside. The opposite is also true when the bottom of the smaller risk range approaches the lower larger risk range line.
This indicator is designed to be used in a trending market, either up or down and if for example you have identified an asset that is in an uptrend, or an asset you wish to accumulate, you can take partial position entries at the 'buy' signals and take partial profits at the 'sell' signals. You can use it effectively in a none trending market, taking the outright short or long potions, but you will be at risk of a trend developing.
The indicator isn't designed to identify trends, but to identify sell and buy entries that occurs due to the natural Brownian motion of the price action.
It is designed for my style of trading where I do not enter the entirety of my intended position in one go and will take partial profits when there are price movements towards the top of the risk range if I am long and then put more of the position back on towards bottom of the risk range and vice versa if I am short an asset. It is especially useful for managing my long term core positions and finally I use the alerts to trigger automated trading bots for my positions using the signals.
It can be used on a wide range of assets and on all time frames.
High & Low Of Custom Session - OpeningRange Breakout (Expo)High & Low Of Custom Session - OpeningRange Breakout (Expo) prints the high and the low of a custom session.
I use the indicator to trade the re-test of opening range (high/low) as well as breakouts from the opening range. The same logic can be applied to the session you have chosen.
HOW TO USE
1. Use the indicator to trade the re-tests of the session range.
2. Use the indicator to trade breakouts of session range.
INDICATOR IN ACTION
1-min chart
I hope you find this indicator useful , and please comment or contact me if you like the script or have any questions/suggestions for future improvements. Thanks!
I will continually work on this indicator, so please share your experience and feedback as it will enable me to make even better improvements. Thanks to everyone that has already contacted me regarding my scripts. Your feedback is valuable for future developments!
-----------------
Disclaimer
Copyright by Zeiierman.
The information contained in my scripts/indicators/ideas does not constitute financial advice or a solicitation to buy or sell any securities of any type. I will not accept liability for any loss or damage, including without limitation any loss of profit, which may arise directly or indirectly from the use of or reliance on such information.
All investments involve risk, and the past performance of a security, industry, sector, market, financial product, trading strategy, or individual’s trading does not guarantee future results or returns. Investors are fully responsible for any investment decisions they make. Such decisions should be based solely on an evaluation of their financial circumstances, investment objectives, risk tolerance, and liquidity needs.
My scripts/indicators/ideas are only for educational purposes!

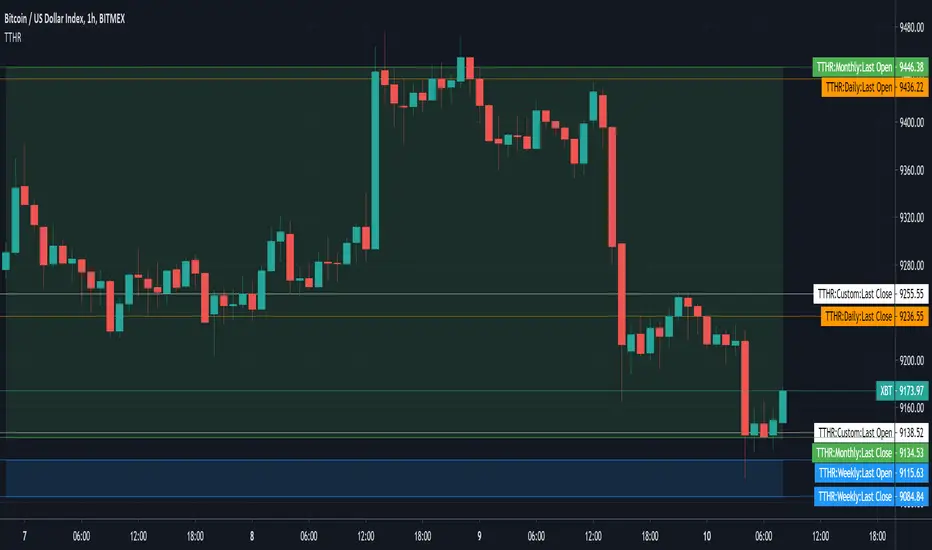
TT Historical RangesBeta - Ongoing Updates
Used to overlay the Open and Close prices and trading range for Last Daily, Weekly and Monthly Candle on your own charts and timeframes.
In the example shown
the green area is showing the last Monthly Candle open and close range
the blue area at the bottom is showing the last Weekly Candle open and close range
the remaining horizontal are for the last Daily Candle (orange lines) and the User Selected Candle of 3 Days (white lines).
NOTE: the labels next to the scale for each price line are only visible if you turn on indicator labels in the scale settings .
Indicator Settings - Daily, Weekly, Monthly and User Selected plots have their own display and style options.
enable or disable last open price line
enable or disable last close price line
enable or disable historical trading range (fill between open/close)
select and your own preferred time frame to display
NOTE: used for my own educational purposes and is not fit for trading advice or strategies.
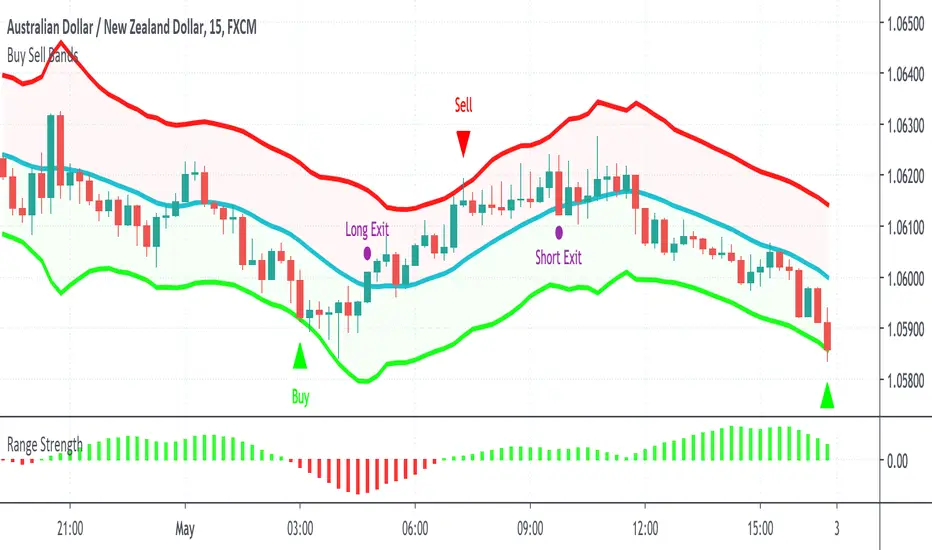
Buy Sell BandsBuy Sell Bands is a super simple indicator based on the mean reversion (range trading) strategy that shows you exactly where to buy, sell and close trades on every chart, market and timeframe.
It's best used together with our Range Strength indicator to identify when the market is in a range mode, this is the best time to take the entry signals from the Buy Sell Bands.
How Is It Different From Other Indicators?
- Designed specifically for the mean reversion (range trading) strategy
- Upper and lower bands are based on current and past volatility
- Aren't as sensitive to "squeezes" after periods of contracted volatility
- Works well in conjunction with the Range Strength Indicator to confirm entry signals
- Helps identify good "pair trading" opportunities
- Can be applied to all markets and timeframes
How To Use The Indicator?
1) Visit our website URL shown below this description and signup
2) We will then grant your TradingView username permission to use our indicators
3) Go to your Indicators window, then the Invite-Only section and add our indicators to your chart
4) Our indicators will then show on every chart you now look at
5) You can set up alerts to be notified in real time of trading signals from our indicators
6) Read our user manual for all the best tips on how to use our indicators as part of a range trading strategy
7) Feel free to reach out to us for personal one-on-one help with getting setup
What Markets and Conditions Does It Work Best On?
All markets cycle between trending and ranging modes, and the key to successfully using these indicators is identifying when the market is in or about to go into a range trading mode, and as such it can be applied to all markets and timeframes.
Some markets and timeframes trade within ranges more predictably than others, for example Forex, Cryptocurrencies, and Futures on the 15 minute timeframe during the US night session can work well due to the lack of price sensitive news creating lasting trends. With Stocks & ETFs on the 5 minute timeframe during the midday session on large cap blue chip stocks with no recent news releases can show strong range trading environments to use our indicators in.
In addition to single markets, you can also use our indicators on pair charts, for example Coca Cola(KO) versus Pepsi(PEP), you can do this by entering KO/PEP inside your TradingView chart quote box and it will bring up a pair chart. Our indicators will show buy and sell signals right on the pair chart just like any other single instrument chart. You can get very creative with what type of pairs you can come up with.
Our indicators are primarily designed for day trading and swing trading, however they can also be used for position trading and investing by identifying technically oversold and overbought range levels that are based on current and past volatility around a dynamic average price, for this we recommend using a weekly chart to identify longer trading opportunities.
As always indicators should be used as part of a trading strategy to assist in making decisions, instead of just blindly following every signal they produce you should always seek to compliment technical trading signals with additional analysis to reduce your risk and increase your odds of making a winning trade.
Examples Of Use On Various Markets and Timeframes
GBP vs CHF Forex Pair 15 Minute Chart
Tesla Stock 1 Minute Chart
Bitcoin vs USD Crypto Pair 15 Minute Chart
Micro E-Mini SP500 Futures 1 Minute Chart
Mastercard vs Visa Stock Daily Pair Chart
To gain access to the Buy Sell Bands and Range Strength Indicators visit our website shown below.
Happy Range Trading :)
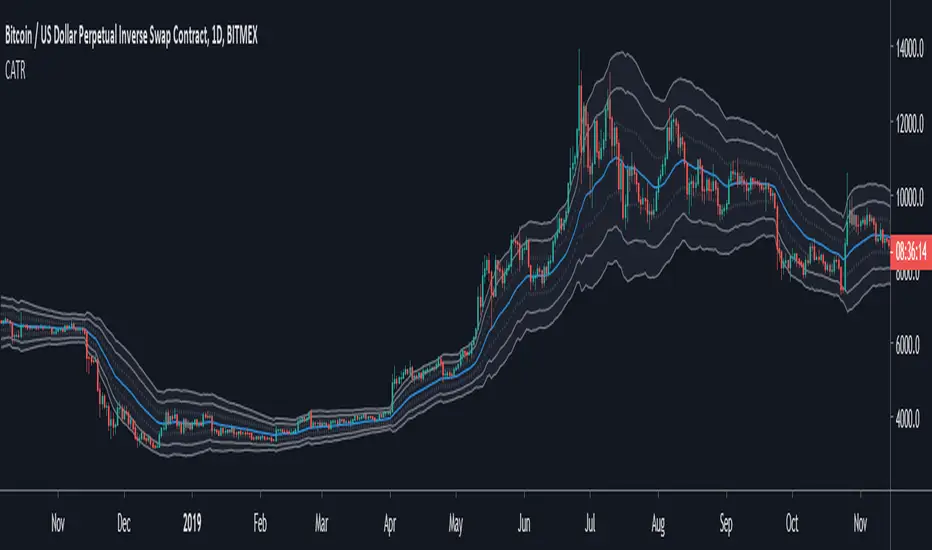
Channel ATR1 - What is the Channel ATR indicator
This is an envelope indicator (like the Bollinger bands indicator) used to evaluate how much the price diverge from it's moving average.
This indicator can be used as a system on it's own. I recommend to use it when the market goes side way, although, you can also use it when the market is trending.
What makes this indicator so relevant and reliable ? The use of the ATR to build the envelope. Read below if you wan to know more.
2 - How is the Channel ATR computed
The main component is an EMA. The envelope is made of 3 layers, each is the Average True Range, plot at a multiple distance from the EMA (1*EMA, 2*EMA, 3*EMA) . If you don't know what is the ATR, it's basically a measure of the volatility (you can read more about it here ).
Each layer of the envelope is a multiple of the measure of the volatility. Let's see how to use it.
3 - How to use the Channel ATR indicator
You can use this indicator in different strategies :
- Return to the mean: When the price goes out of the envelope, it's an excess of the market. You can take advantage of this by betting to a return to the EMA value.
- Trend following : If the market is tending, you can buy/sell when the price touch the EMA and place a target at another level in the envelope.
- Stop loss: Since each envelope layer is built from the ATR (i.e. the volatility), you can use it to place your stop at least at 1 ATR from your entry, to not be hit by the market noise.
- Find your own way : The Channel ATR is a very rich and powerful indicator, you can try to built your own trading system on the top of it.
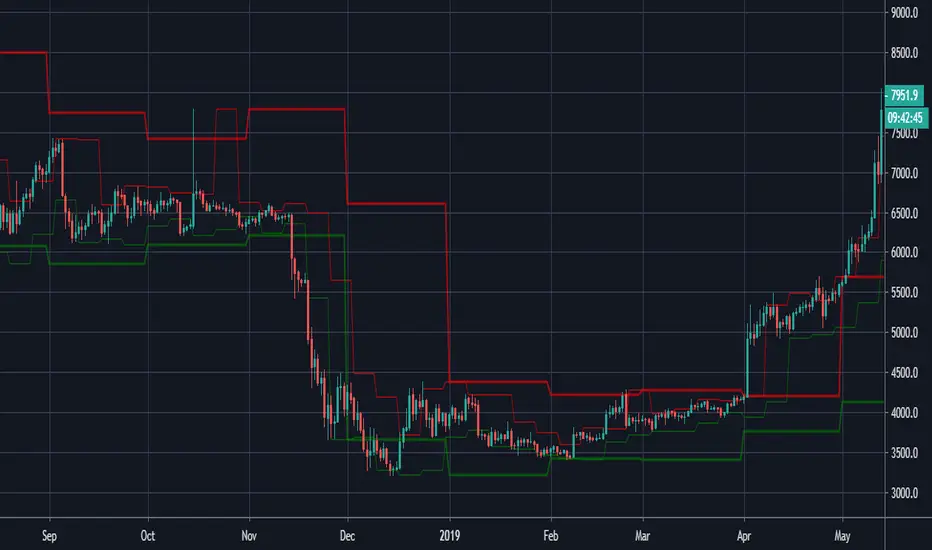
Moving High & Low (2 Time Frames)===========
Moving High & Low (2 Time Frames)
===========
A simple line set indicator displaying the highs and lows of the previous selected timeframe upon a lower timeframe chart (2 line sets available).
e.g. Displaying the Highs & Lows of the last week and/or month on the 1D chart
-----------
Useful for 2 very different approaches to trading markets -
Finding Breakout Points:
For example - When candlestick closes above or below highs from previous week/month it may be a good time to go long as if the trend continues it may well go on for a long time making lots of pips along the way!
Finding SAR points within a range:
For example - When price starts ranging within horizontal line sets that aren't moving either way too much it may be a good idea to place long/short orders at appropriate key levels dictated by these range extremities, anticipating the price to reach these levels and deflect (Stop & Reverse) back the other way.
Either way we would recommend you NOT use this indicator alone, this is very much a confirmation tool or as an aid to find key levels of support/resistance.
Good Luck and Happy Trading!
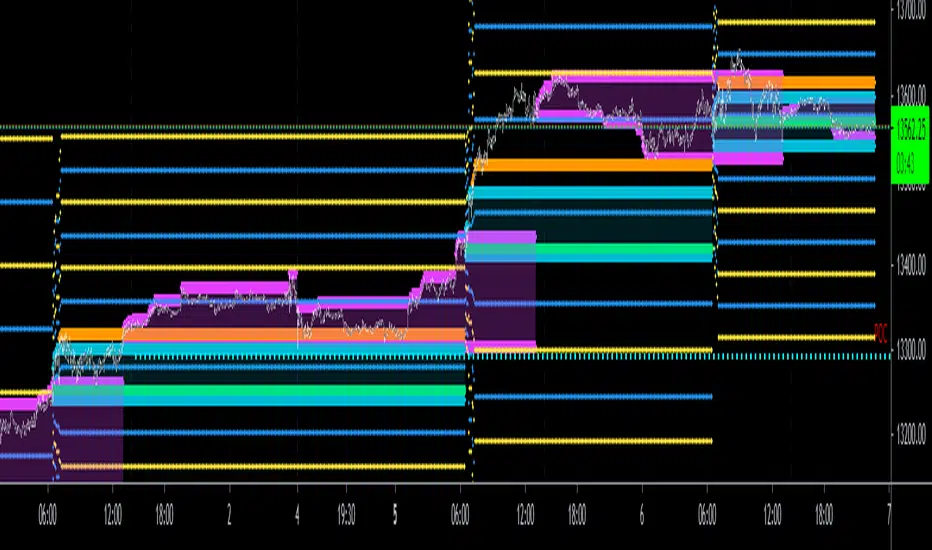
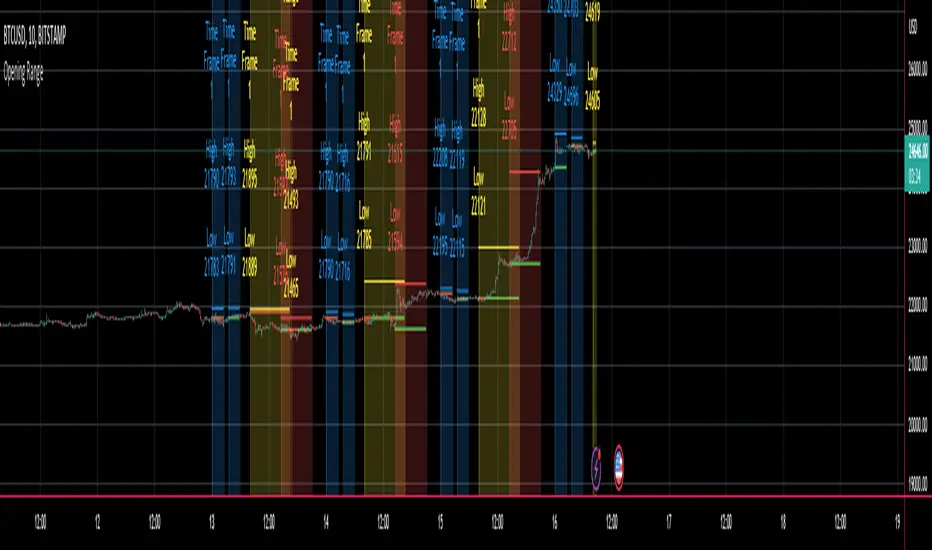
Multi Ticker Session Opening High Low RangeThe Multi Ticker Session Opening High Low Range Indicator by the Caretaker.
The original idea for this indicator came out of a request from Krown's Crypto Cave community member ZFelds.
This indicator is designed to display the High / Low Ranges of the "on chart" asset, at a chosen resolution from the opening time of, and for the duration of, the chosen Ticker Sessions (up to 3) .
Its function is to allow the user to easily keep track of the session times of the major world indices, and the reaction of the on chart assets price from the opening of the ticker sessions over the duration of the ticker sessions.
Typically used for a guide when scalp trading on low time-frames by plotting the opening 1 or 5 minute High/Low trading range of an asset during the start of a major market opening up an d making trading decisions based on the reaction of Price Action around those levels.
It does this by plotting High / Low Range bands (plus mid-lines) which displays the High and Low range of the on chart assets opening candle at the chosen time resolution for the chosen ticker (Defaults : SPX, NI225, UKX).
The Range bands fill colour changes depending on whether the chart asset closes candles within, above, or below the range (Default : Silver, Green, Red).
It plots optional Background "Session Bars" and "Session Banners" which function to clearly show the session.
The background "Session bars" can be set to plot just the first bar as a signal or on all session bars.
The "Session Banners" are horizontal lines of chosen width which "float" above the chart data.
Optional info text-boxes also "float" above the chart data and function to display the session opening range information.
(Ticker symbol, Opening range time resolution, Session open high & low).
The text-boxes can be set to full label or short label.
The text-boxes can be set to the left or center of the session.
The height offset by which the text-boxes and banners float above the highest high of the range is alterable in the settings.
The text-boxes and banners also have a "clash avoidance" function which will offset their heights to help avoid them clashing on screen (This offset is alterable in the settings).
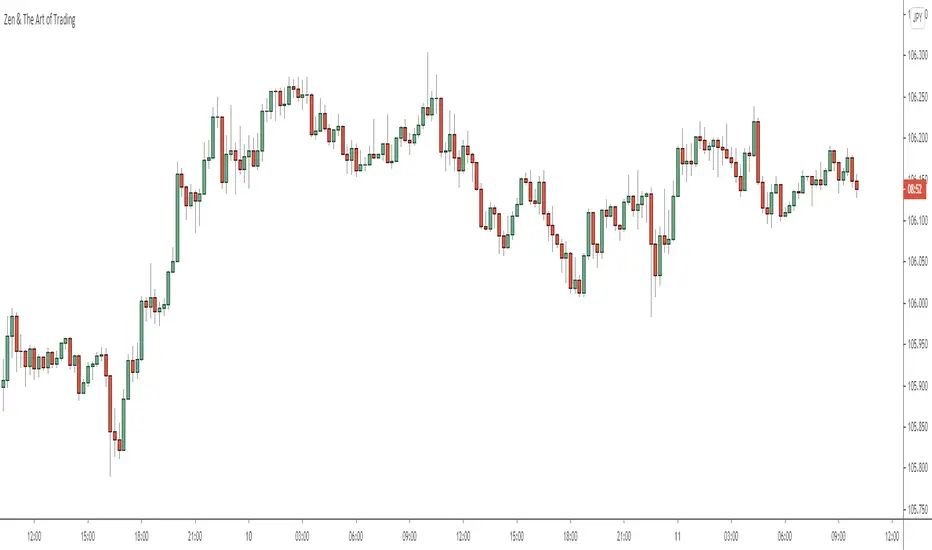
ATR (Average True Range) By TimeWhat is ATR By Time?
This premium indicator was inspired by my RVOL By Time indicator . It works on Stocks, Forex, Crypto and most Futures markets. Instead of calculating the ATR by recent price data, it calculates an ATR value for each candle based on that candle’s time of day.
For example, if you set the Lookback setting on this indicator to 14, then instead of calculating the ATR based on the past 14 candles, it will calculate an ATR value based on the past 14 trading sessions for each candle.
This is extremely useful for day traders in particular as it allows you to gauge the average range of candles during certain times of day instead of only by the most recent price action.
It also draws a regular ATR (optional) – so this is essentially an enhanced ATR script that gives you multiple readings on price volatility.
If you are interested, you can purchase access to the script or register for a free trial on my website: ATR By Time Feature Page .
Why Does It Cost Money?
The reason why this is a premium script that requires payment to access is because it took a lot of time, research and development in order to create. The other advantage of charging for it is that it retains exclusivity to only a select few dedicated traders.
By paying the yearly fee you get access to ALL of my premium indicators including lifetime updates and technical support.
If you don’t want to pay for this script then I completely understand and I have plenty of other free indicators and scripts that you might be interested in!
Free Trial
I am a trader myself and so I know how skeptical you might be that this indicator is worth your time and money. That is why I am offering a free trial of this indicator.
All you need to do to initiate your trial is Join My Mailing List/ on my website: zenandtheartoftrading.com
How It Works
This script uses a complex formula to calculate ATR values across distant historical bars.
Depending on the timeframe you select it will skip through historical bars to find previous bars from the same time of day. It collects these values then applies the traditional ATR formula to them.
The ATR value is determined by the maximum result of the following three calculations:
- Current high minus the current low
- The absolute value of the current high minus the previous close
- The absolute value of the current low minus the previous close
- Whichever of these three calculations comes out highest, that is your ATR for the given candle.
Once this value is calculated for historical bars the ATR indicator’s reading is typically determined by a 14-period moving average of these individual ATR values. So the ATR reading you see on your screen is an average of the past 14 ATR values.
This means that as markets expand and contract this volatility reading will adapt to the change in candle price ranges.
The difference with the ATR By Time indicator’s calculation formula is that rather than referencing recent bars it references bars based on their time of day.
For example, if you are on the 1-Hour chart and you check the ATR By Time value at 9:00AM with a Lookback period of 14, then the value you see will be the result of the ATR calculation of every 9:00AM 1-Hour candle over the past 14 trading sessions.
You can also choose to enable the ATR moving average in the settings menu if you wish. This will give you a smoothed ATR reading by averaging the current session’s ATR value with previous sessions.
This versatility gives you a sophisticated reading on price volatility which is particularly helpful for day trade setups based around market opens or market closes when volatility tends to spike.
The regular ATR indicator will not account for this on the lower timeframes, but this indicator will!
Examples
Stocks - Heatmap Scheme with regular ATR
Stocks - Price Scheme - No ATR
Stocks - Traffic Scheme - Session Average Line RMA
Stocks - Trigger Scheme - 10 sessions
Forex - RMA
Forex - No RMA
Forex - Normal ATR Stop
Forex - Session ATR Stop
Weekdays HeatmapA utility tool for getting interesting weekdays statistics.
Features
26 sources (standard prices, volumes, ranges)
Readable and optimized code
How to interpret
The darker the color, the stronger the weekday dominance
Supported sources/metrics
open
high
low
close
oo2 , (open + previous open) / 2
oh2 , (open + high) / 2
ol2 , (open + low) / 2
oc2 , (open + close) / 2
hh2 , (high + previous high) / 2
hl2 , median price
hc2 , (high + close) / 2
ll2 , (low + previous low) / 2
lc2 , (low + close) / 2
cc2 , (close + previous close) / 2
hlc3 , typical price
ohlc4
weighted close , (2 * close + high + low) / 4
true range
double true range , by Cynthia Kase
open/close range
high/low range
volume
tick volume
net volume
on balance volume
acc/dist , accumulation/distribution line
price volume trend
trade value , volume * close * pipvalue
How to get access
PM me for more details

ATR Entries & Stop Loss [Jigga]This is a simple script that displays multiples of ATR and shows you where the potential zones for longing and shorting are. The majority of people use ATR as a stop loss, so we can use it for our advantage and get in when they are stopped out. There is also a possibility to add a stop loss, so a trader can lose little when he is wrong and maximize profit when he is right. It works the best in ranging markets.
Do not forget to always use a proper stop loss and risk management.
Here you can see it in action:
BTC - BitMex - Range bound market

Average True Range OverlayPlots ATR calculated on a daily basis as an overlay on the current chart.
Implemented using the builtin atr function.
ATR is a volatility indicator
originally developed by J. Welles Wilder, Jr. for commodities:
New Concepts in Technical Trading Systems. Greensboro, NC: Trend Research. ISBN 978-0-89459-027-6.
The range of a day's trading is simply R = high − low.
The true range extends it to yesterday's closing price if it was outside of today's range:
TR = max
The average true range is an N-day smoothed moving average of the TR values.
A first stab at a sensible stop loss level might be 3*ATR below recent peak.
SuperRSI: Enhanced MomentumSuperRSI is a next-generation momentum indicator designed to overcome the lag and noise found in the traditional Relative Strength Index (RSI). Unlike standard RSI which only looks at close prices, SuperRSI utilizes a unique "Titan Engine" logic that incorporates the full Price Range (Highs and Lows) to calculate momentum. This results in a smoother, more responsive oscillator that detects trend shifts earlier.
Key Features:
🚀 Range-Based Calculation: Factors in the expansion and contraction of price ranges, not just closing prices.
🎨 Dynamic Visuals: Beautiful gradient coloring that adapts to the trend (Bullish/Bearish) and visualizes Overbought/Oversold zones clearly.
⚡ Dual Signal System:
Slow Signal (Default): For reliable trend following.
Fast Signal (Optional): Can be enabled in settings for aggressive entries and scalping.
🔔 Comprehensive Alerts: Built-in alerts for RSI crossovers with Fast/Slow lines and Signal crossovers (Golden/Death Cross).
🛡️ Pine Script v6: Built on the latest version for maximum performance and stability.
How to Use:
Trend Confirmation: When the line is green and above 50, the trend is bullish. When red and below 50, the trend is bearish.
Overbought/Oversold: Look for reversals when the indicator exits the dotted zones (>80 or <20).
Signal Crossovers: Enable the "Fast Signal" in settings to trade the crossovers between the Fast and Slow signal lines (similar to MACD mechanics).
Settings:
Fully customizable colors and lengths.
Option to toggle the "Fast Signal" on or off (Hidden by default to keep the chart clean).

Intraday Sessions Ranges with Time SegmentationSession Ranges indicator overlays customizable range boxes on major trading sessions (e.g. London, Premarket, NY AM and NY PM) using New York time.
Toggle visibility, add evenly spaced vertical segment lines, and highlight key time zones. Perfect for traders marking price action and levels across multiple historical days.

QuantCrawler 5m ORB Pro - Opening Range with Confluence FiltersThis indicator captures the 5-minute Opening Range and generates entry signals using a breakout-then-retest methodology. It includes optional confluence filters to refine entries and reduce false signals.
HOW IT WORKS
1. Captures the 5-minute Opening Range (high, low, midpoint) at your selected session open
2. Waits for price to break beyond OR high or low by your defined distance
3. After breakout, monitors for price to retest the OR midpoint
4. Signals LONG after bullish breakout + midpoint retest
5. Signals SHORT after bearish breakout + midpoint retest
6. Marks invalidated signals with (X) if price breaks through the opposite side
PRE-CONFIGURED SESSIONS
- NYSE - 9:30-9:35 ET
- CME - 8:30-8:35 CT
- London - 3:00-3:05 ET
- Asia - 7:00-7:05 PM ET
- Custom - Define your own session times and timezone
BREAKOUT DISTANCE OPTIONS
Choose between fixed points or percentage-based breakout threshold. Percentage mode automatically scales to the instrument price.
CONFLUENCE FILTERS
Optional filters to add confirmation before signals fire:
- VWAP - Long requires price above VWAP, short requires below
- EMA Slope - Confirms trend direction using 20-period EMA
- Volume - Requires relative volume above 1.5x average
- FVG - Requires a Fair Value Gap supporting trade direction
- ATR - Filters Opening Ranges that are abnormally small or large relative to ATR
When filters block a valid setup, the indicator displays a BLOCKED label so you can see what you missed and why.
STATUS BOX
Real-time display showing:
- Current trade state (Building OR, Watching, Awaiting Retest, Long/Short Active)
- OR High, Low, and Midpoint levels
- Active filters and block reasons
ALERTS
Built-in alerts for Long Entry, Short Entry, or Any Entry.

[TA] Range Regime# Range Regime – Candle Range Monitor (RR)
## Short Description
Tracks current candle range vs historical average, flags range spikes, and labels volatility regime (LOW / NORMAL / HIGH) at a glance.
---
## What It Does
Range Regime (RR) is a volatility/range monitoring indicator designed to help you quickly understand whether the market is *quiet, normal, or expanding* on the current timeframe.
It calculates:
* Current Range
* Either Candle Range (High–Low) *or* True Range (TR)
* Average Range over a lookback window (optionally smoothed)
* Max / Min / Mid range levels over the same lookback
* Spike detection
* Marks candles where current range is ≥ (Spike Threshold × Average)
* Regime state
* Compares the current range vs a longer Baseline Average
* Labels LOW / NORMAL / HIGH volatility regime in a small table
It also shows a compact stats table with points and ticks (based on `syminfo.mintick`) so you can think in the units you actually trade.
---
## Why It’s Helpful
This tool is useful because range expansion and compression often determine:
* Whether a setup is worth taking right now
* Whether your stops/targets are realistic for the session
* Whether you should size down (high regime) or avoid forcing trades (low regime)
* When the market is shifting from chop → impulse (spikes) or impulse → stall (compression)
In practice, RR helps you answer:
* “Is volatility expanding or contracting?”
* “Is this move unusually large relative to recent history?”
* “Are we in a high-vol environment where risk needs to change?”
---
## How To Use It
1. Add to chart (it plots in its own pane).
2. Choose your Range Mode :
* Candle (H–L) : pure bar range (great for clean range monitoring)
* True Range (TR) : includes gaps (better for overnight / news / gap-prone markets)
3. Set Lookback (N) :
* Typical: 20–100
* Smaller = more reactive, larger = more stable
4. Optionally enable Smooth the Average :
* Helps reduce noise and false “spike” triggers
5. Adjust Spike Threshold (× Avg) :
* Common values:
* 1.3–1.6 = more frequent spike flags
* 1.8–2.5 = only “real” expansions get flagged
6. Set Baseline Length (Regime) :
* Typical: 150–300
* This is your “background volatility context”
---
## How To Read The Plots
* Current Range (columns): what the market just “spent” in range.
* Avg: normal range for this timeframe.
* Max / Min: extremes over the lookback window.
* Mid: midpoint between Max and Min (quick “center” reference).
* Spike Line (× Avg): the threshold for a “spike.”
* Background highlight: appears when the current candle qualifies as a spike.
* Regime table (top-left):
* HIGH when current range > 1.25× baseline average
* LOW when current range < 0.75× baseline average
* Otherwise NORMAL
---
## Practical Trading Uses (Examples)
* Risk calibration: If regime is HIGH , consider wider stops / smaller size.
* Trade selection: Avoid mean-reversion scalps when spikes are frequent (momentum environment).
* Session context: Spot when market transitions from tight range (LOW) into expansion (spike + HIGH).
* Instrument comparison: Great for comparing how “active” ES vs NQ vs CL is *on the same timeframe*.
---
## Suggested Defaults
* Lookback (N): 50
* Range Mode: True Range (TR) for gap-prone markets; Candle (H–L) for cleaner intraday bars
* Smoothing: On, length 10
* Spike Threshold: 1.5×
* Baseline Length: 200
---
## Notes / Limitations
* This is not a buy/sell signal . It’s a volatility/range context tool .
* Results depend on timeframe. A spike on 1m means something very different than a spike on 1h.
* “Ticks” display uses the symbol’s `mintick` and will be most meaningful on instruments with standardized tick sizes (futures, many FX pairs, etc.).
---
## Invite-Only / Access Copy
This script is published as “Invite-Only.”
If you’ve been granted access, it will appear under Indicators → Invite-only scripts on TradingView.
If you don’t see it, you likely haven’t been added yet—request access from the publisher.
---

First Candle Range (FCR) Gold Strategy - EtubersThe 18:00 (6:00 PM) candle is widely used by traders in the Forex and Futures markets because it marks the New York market rollover and the start of the Asian session.
How the Strategy Works:
- The Range: The High and Low prices of the 1-hour candle (18:00–19:00) create a "Supply and Demand" zone.
- The Breakout: A candle closing above the high signals a bullish breakout; a candle closing below the low signals a bearish breakout.
- Institutional Memory: By extending this zone forward for 4 days, traders can identify where "old" 18:00 levels act as support or resistance in the future.
- Execution: Traders often wait for a breakout followed by a "retest" of the box boundary to enter a high-probability trade.

CRT - Candle Range TheoryCRT - Candle Range Theory is an indicator that identifies CRT patterns based on the concept of liquidity sweeps and price rejection.
WHAT IS CRT?
A CRT (Candle Range Theory) pattern occurs when:
- A "Parent" candle establishes a range (High/Low)
- The next candle sweeps beyond one side of that range (liquidity grab)
- But closes back INSIDE the parent range (rejection)
This creates a potential reversal signal as liquidity has been taken and price rejected continuation.
PATTERN TYPES
BEARISH CRT
- CRT candle sweeps above Parent High
- Does NOT sweep below Parent Low
- Closes inside Parent range
BULLISH CRT
- CRT candle sweeps below Parent Low
- Does NOT sweep above Parent High
- Closes inside Parent range
ALERT TYPES
The indicator offers three alert filters based on the strength of rejection:
1. Close NOT Reach 50%
Strongest rejection - Close doesn't even retrace to the 50% level of the parent range.
Bearish: Close > 50% | Bullish: Close < 50%
2. Price NOT Reach 50%
Price (wick) doesn't reach the 50% level at all.
Bearish: Low > 50% | Bullish: High < 50%
3. Basic CRT
Any valid CRT pattern without the 50% filter.
VISUAL ELEMENTS
- PH / PL lines: Parent candle High and Low
- 50% line: Middle of the parent range
- 25% / 75% lines: Quarter levels of the parent range
- Labels: Appear on CRT candle showing pattern type and conditions met
HOW TO USE
1. Set your preferred chart timeframe
2. Enable the alert types you want to monitor
3. Create alerts via the TradingView alert menu
4. Labels will automatically appear when conditions are met
SETTINGS
Visual Settings
- Colors for PH/PL, 50%, and 25%/75% lines
- Line widths for each level type
- Toggle visibility for 50% and quarter lines
CRT Alerts
- Show/hide labels on chart
- Customize bearish/bullish label colors
- Enable/disable each alert type independently
NOTES
- This indicator works on any timeframe
- Multiple conditions can be displayed in one label if enabled
- Outside bars (sweep both sides) are excluded from CRT detection
- Close must be inside parent range for valid pattern

Visible Range / POC / Volume / SNR Detector PROVisible Range POC & Volume SNR Detector PRO
Visible Range POC & Volume SNR Detector PRO is a professional-grade volume-based market structure tool designed to identify institutional Support & Resistance zones, Point of Control (POC), and Value Areas directly from the visible chart range.
This indicator goes beyond traditional swing highs and lows by analyzing real traded volume, revealing where large players are active, where price finds fair value, and where high-probability reactions are most likely to occur.
🔍 Core Features
📊 Visible Range Volume Profile
🔹Builds a full Volume Profile using only the visible chart range
🔹Splits price into configurable precision bins for maximum accuracy
🔹Detects true volume clusters instead of subjective price levels
🎯 Point of Control (POC)
🔹 Automatically identifies the highest-volume price level
🔹Acts as a magnet price where market participants agree on value
🔹Fully customizable line style, width, and color
🔹 Optional label with timeframe + price + volume (K / M / B)
📦 Value Area (VAH / VAL)
* Calculates Value Area High & Low around the POC
* Default **70% volume range** (institutional standard)
* Optional Value Area fill for clear fair-value visualization
* Helps distinguish **range conditions vs trending moves**
🧱 Volume-Based Support & Resistance Zones
🔹Automatically detects high-impact S&R zones from volume behavior
🔹Zones are visually classified by strength:
🔹 🟢 Strong
🔹 🟡 Medium
🔹 🔴 Weak
🔹Clean box rendering with customizable borders:
🔹 Solid / Dashed / Dotted
🔹 Zones extend dynamically into the future for planning trades
🔄 Dynamic Flip Logic (PRO Standard)
🔹 Advanced Dynamic Flip system:
🔹 Support ➜ Resistance after a breakdown
🔹Resistance ➜ Support after a breakout
🔹 Reflects real market structure shifts
🔹Eliminates outdated static levels
🔁 True Retest & Zone Intelligence
🔹Each zone includes detailed contextual data:
🔹🔄 True Retest Count (price leaves zone and comes back)
🔹⏳ Zone Age (minutes / hours / days)
🔹💪 Strength Classification
🔹🔁 Flip Status
🔹⏱️ Timeframe
🔹💲 Exact price level
🔹All information is displayed in a single clean label.
🔔 Smart Alerts System
🔹Never miss key interactions:
🔹🟢 Touch Alert — price enters a zone
🔹⬇️⬆️ Break Alert — zone failure or breakout
🔹🔄 Retest Alert — classic break & retest setup
Alerts trigger on confirmed bars to reduce noise and false signals.
📋 Professional Dashboard
🔹At-a-glance market overview:
🔹Total Support & Resistance zones
🔹🎯 POC level
🔹📦 VA High / VA Low
🔹💪 Strong / Medium / Weak zone distribution
🔹📍 Nearest Support & Resistance
🔹📏 Distance to key levels
🔹 🎨 Auto / Dark / Light theme support
🔹 📐 Adjustable size & position

QFT MTF Range DetectorQFT MTF Range Detector — QuantumFlowTrader
Description:
The QFT MTF Range Detector is a multi-timeframe (MTF) tool designed to identify consolidation zones or ranging conditions across multiple intraday timeframes — from 1 minute up to 4 hours. This indicator is optimized for high-frequency trading environments such as scalping and day trading.
How it works:
For each selected timeframe, the indicator evaluates five key technical conditions:
- Low ADX (less than 17) – suggesting weak trend strength.
- Range width within a specific normalized threshold.
- Normalized ATR (volatility filter) in a defined range.
- RSI near the neutral zone (40–60) with low volatility.
- Price proximity to the mid-range (consolidation center).
Each condition contributes a score. If at least 3 out of 5 conditions are met, that timeframe is considered to be in a range (consolidation).
Visual output:
A compact table is displayed on the chart showing all selected timeframes:
Black box = Timeframe is in a range (consolidation).
Purple box = Not in a range (likely trending or volatile).
Timeframes are labeled (e.g., "4H", "15M") for clarity.
Customization:
Choose display corner (top/bottom, left/right).
Enable or disable table borders.
Set custom colors for range and non-range signals.
Use case:
Traders can quickly assess which timeframes are in a range, helping them:
Avoid choppy markets,
Time entries and exits better,
Confirm multi-timeframe alignment.
Note: This is not a buy/sell signal indicator. It is a market condition filter to enhance decision-making.

Visible RangeOverview This is a precision tool designed for quantitative traders and engineers who need exact control over their chart's visual scope. Unlike standard time calculations that fail in markets with trading breaks (like A-Shares, Futures, or Stocks), this indicator uses a loop-back mechanism to count the actual number of visible bars, ensuring your indicators (e.g., MA60, MA200) have sufficient sample data.
Why use this? If you use multi-timeframe layouts (e.g., Daily/Hourly/15s), it is critical to know exactly how much data is visible.
The Problem: In markets like the Chinese A-Share market (T+1, 4-hour trading day), calculating Time Range / Timeframe results in massive errors because it includes closed market hours (lunch breaks, nights, weekends).
The Solution: This script iterates through the visible range to count the true bar_index, providing 100% accurate data density metrics.
Key Features
True Bar Counting: Uses a for loop to count actual candles, ignoring market breaks. perfect for non-24/7 markets.
Integer Precision: Displays time ranges (Days, Hours, Mins, Secs) in clean integers. No messy decimals.
Compact UI: Displays information in a single line (e.g., View: 30 Days (120 Bars)), default to the Top Right corner to save screen space.
Fully Customizable: Adjustable position, text size, and colors to fit any dark/light theme.
Performance Optimized: Includes max_bars_back limits to prevent browser lag on deep history lookups.
Settings
Position: Default Top Right (can be moved to any corner).
Max Bar Count: Default 5000 (Safety limit for loop calculation).

BPR (Ballanced price range) DetectorHow This BPR Detector Works
This indicator is designed to detect and visualize balanced price ranges (BPRs) on price charts. The indicator has two main components:
Regular FVG Detection - The indicator first detects regular Fair Value Gaps in price action, which are spaces where price has moved quickly leaving a gap. This is necessary because BPRs are derived from regular FVGs.
BPR Detection - When the price action inverts and moves through a regular FVG in the opposite direction, the indicator identifies this as a BPR. This concept is important in Inner Circle Trader (ICT) methodology as it can signal potential changes in trend direction. Additionally the detection logic is refined by incorporating displacement.
The main functionality preserved includes:
Detection of regular FVGs (required to find BPRs)
Conversion of regular FVGs to BPRs when price moves through them creating a FVG in the opposite direction
Visual display of both FVG and BPR zones
Mitigation tracking for both types of imbalances
Displacement visualization that helps identify energetic price moves
Key Settings
FVG Settings - Control the appearance and behaviour of regular Fair Value Gaps
BPR Settings - Control the appearance of Breaker Price Ranges (which have different colours by default)
Mitigation Settings - Define how the indicator determines when an imbalance has been filled
Displacement Settings - Optional highlighting of energetic price moves that may lead to imbalances

Session Range Boxes GR v2.1This indicator draws intraday range boxes for the main Forex sessions based on Europe/Budapest time (CET/CEST).
Tracked sessions (Budapest time):
Asia: 01:00 – 08:00
Frankfurt (pre-London): 08:00 – 09:00
London: 09:00 – 18:00
New York: 14:30 – 23:00
For each session, the script:
Detects the session start and session end using the current chart timeframe and the Europe/Budapest time zone.
Tracks the high and low of price during the session.
Draws a colored box from session open to session close, covering the full price range between the session high and low.
Draws a white midline inside every box at the midpoint between the session high and low (and keeps it visible for all past sessions).
Optionally plots a small label (“Asia”, “Fra”, “London”, “NY”) above the first bar of each session.
Color scheme:
Asia: soft orange box
Frankfurt: light aqua box
London: darker blue box
New York: light lime box
Use this tool to:
Quickly see which session created the high or low of the day,
Highlight important liquidity zones and prior session ranges that price may revisit,
Visually separate Asia, Frankfurt, London and New York volatility profiles on intraday charts.
Optimized for intraday trading (Forex / indices), but it works on any symbol where session behavior and time-of-day structure matter.
