Relative Volume Screener AlertsThis script will screen 12 different stocks and current chart (13 in total) for entry points from my relative volume indicator.
1. Enter in any ticker ID's from charts you wish to scan in the settings.
2. Go to desired timeframe.
3. Click add alert button at top toolbar.
4. Select RVOL Screener Alerts indicator, input alert notification settings and/or change alert name and click create.
The script will then scan the stocks and alert you of any entry points from the timeframe you set the alerts.
A new alert needs to be created for each timeframe you wish to screen.
You can find my relative volume indicator here:
Tìm kiếm tập lệnh với "relative volume"

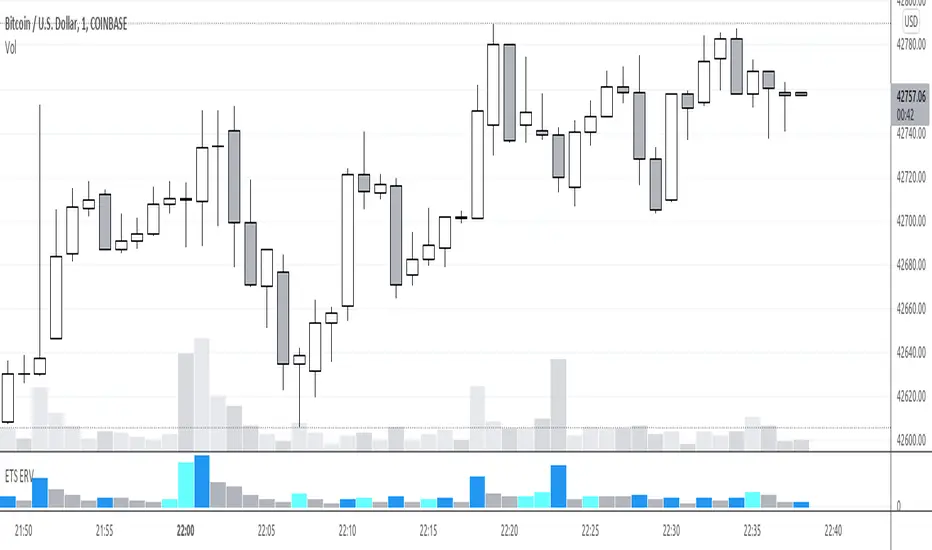
Relative VolumeVolume can be a very useful tool if used correctly. Relative volume is designed to filter out the noise and highlight anomalies assisting traders in tracking institutional movements. This tool can be used to identify stop loss hunters and organized dumps. It uses a variety of moving averages to hide usual activity and features an LSMA line to show trend. Trend columns are shown to highlight activity and can be seen at bottom of the volume columns, this is done using ZLSMA and LSMA.
The above chart shows an example of 2 indicators being used on the 15 min chart. The bottom indicator is set to the 1 min chart. Traders can see a large dump on the 1 min chart as institutions wipe out any tight stop losses. Next they buy back in scooping up all those long positions.
This is an example layout using a split screen setup and multiple timeframes ranging from 1 min to 30 mins. This gives a clear indication of trends and make it easy to pickup on institutional behaviour. Tip: Double clicking indicator background will maximize RVOL to the split screen window.

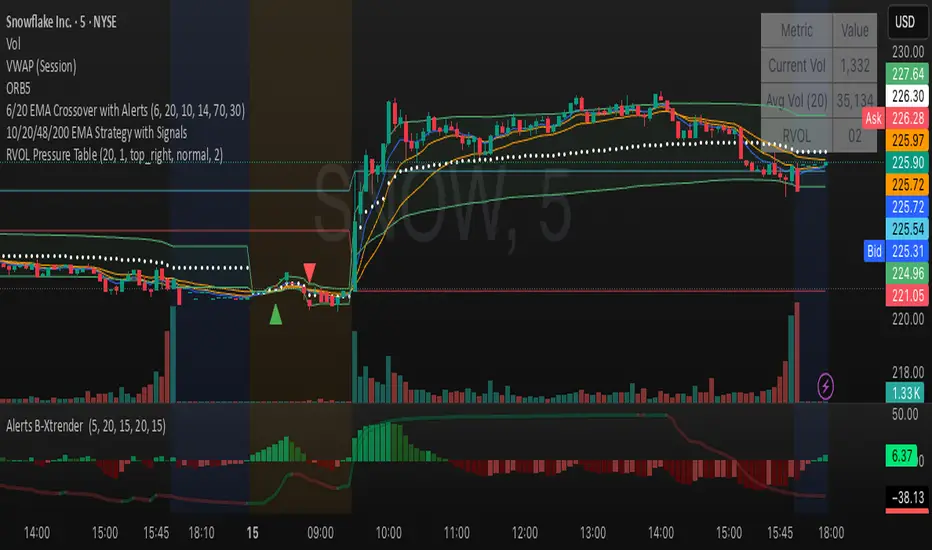
Relative Volume Table with PressureDisplay relative Volume as a table in the top right corner. Turns green when volume is high and price is increasing and red when volume is high and price is decreasing. I use this on D timeframe at the open to screen for stocks breaking out.
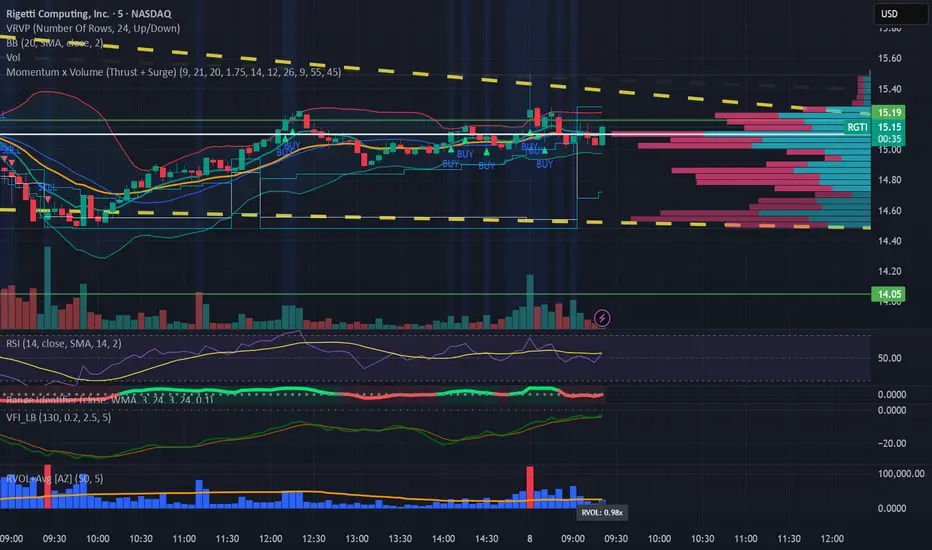
Relative Volume (RVOL) + Average Volume [AZ]The script helps you instantly see whether today’s volume is unusual compared to the past (relative volume). It’s built for breakout/fakeout filters, like the 15-minute ORB strategy you’re running.
M3EDGE™ Relative Volume (RVOL)Relative Volume (RVOL) compares the current volume to its historical average.
🎯 Goal: Spot abnormal flows and anticipate impulsive moves.
🔍 M3EDGE™ Key Reading:
• RVOL > 2.0 → Likely institutional activity.
• RVOL > 1.5 → Heightened surveillance: potential move building.
• Price falling + high RVOL → Stealth accumulation / sell-side absorption.
• Price rising + high RVOL → Confirmed breakout with real flows.
💡 In the M3EDGE™ method, RVOL filters out false signals and validates setups by aligning flow + structure + momentum.
Applied to ETFs or stocks, it reveals what price action alone won’t show

Relative volume zone + Smart Order Flow Dynamic S/ROverview:
The Relative Volume Zone + Smart Order Flow with Dynamic S/R indicator is designed to help traders identify key trading opportunities by combining multiple technical components. This script integrates relative volume analysis, order flow detection, VWAP, RSI filtering, and dynamic support and resistance levels to offer a comprehensive view of the market conditions. It is particularly effective on shorter timeframes (M5, M15), making it suitable for scalping and day trading strategies.
Key Components:
1. Relative Volume Zones:
• The script calculates the relative volume by comparing the current volume with the average volume over a defined lookback period (volLookback). When the relative volume exceeds a specified multiplier (volMultiplier), it indicates a high volume zone, signaling potential accumulation or distribution areas.
• Purpose: Identifies high-volume trading zones that may act as significant support or resistance, indicating possible entry or exit points.
2. Smart Order Flow Analysis:
• The indicator uses Volume Delta (the difference between buying and selling volume) and a Cumulative Delta to detect order imbalances in the market.
• Order Imbalance is identified using a moving average of the Volume Delta (orderImbalance), which helps highlight hidden buying or selling pressure.
• Purpose: Reveals market sentiment by showing whether buyers or sellers dominate the market, aiding in the identification of trend reversals or continuations.
3. VWAP (Volume Weighted Average Price):
• VWAP is calculated over a default daily length (vwapLength) to show the average price a security has traded at throughout the day, based on both volume and price.
• Purpose: Provides insight into the fair value of the asset, indicating whether the market is in an accumulation or distribution phase.
4. RSI (Relative Strength Index) Filter:
• RSI is used to filter buy and sell signals, preventing trades in overbought or oversold conditions. It is calculated using a specified period (rsiPeriod).
• Purpose: Reduces false signals and improves trade accuracy by only allowing trades when RSI conditions align with volume and order flow signals.
5. Dynamic Support and Resistance Levels:
• The script dynamically plots support and resistance levels based on recent swing highs and lows (swingLookback).
• Purpose: Identifies potential reversal zones where price action may change direction, allowing for more precise entry and exit points.
How It Works:
• Buy Signal:
A buy signal is generated when:
• The price enters a high-volume zone.
• The price crosses above a 5-period moving average.
• The cumulative delta shows more buying pressure (cumulativeDelta > SMA of cumulativeDelta).
• The RSI is below 70 (not in overbought conditions).
• Sell Signal:
A sell signal is generated when:
• The price enters a high-volume zone.
• The price crosses below a 5-period moving average.
• The cumulative delta shows more selling pressure (cumulativeDelta < SMA of cumulativeDelta).
• The RSI is above 30 (not in oversold conditions).
• Dynamic Support and Resistance Lines:
Drawn based on recent swing highs and lows, these lines provide context for potential price reversals or breakouts.
• VWAP and Order Imbalance Lines:
Plotted to show the average traded price and highlight order flow shifts, helping to validate buy/sell signals.
How to Use:
1. Apply the Indicator:
Add the script to your chart and adjust the settings to match your trading style and preferred timeframe (optimized for M5/M15).
2. Interpret the Signals:
Use the buy and sell signals in conjunction with dynamic support/resistance, VWAP, and order imbalance lines to identify high-probability trade setups.
3. Monitor Alerts:
Set alerts for significant order flow events to receive notifications when there is a positive or negative order imbalance, indicating potential market shifts.
What Makes It Unique:
This script is unique because it combines multiple market analysis tools — relative volume zones, smart order flow, VWAP, RSI filtering, and dynamic support/resistance — to provide a well-rounded, multi-dimensional view of the market. This integration allows traders to make more informed decisions by validating signals across various indicators, enhancing overall trading accuracy and effectiveness.

Relative Volume (Premarket + TF Override) [Screener-ready]This indicator picks up the Relative Volume in Pre Market. Now there is an indicator you can include it to filter in a pre market sreener. To pick up high Rel Volume (x5) spiking in Pre Market.

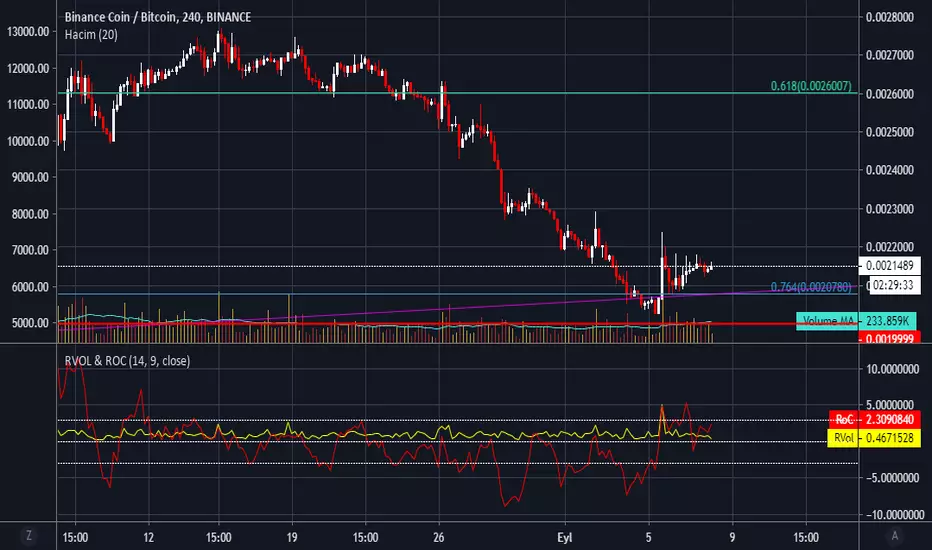
RVol & RoC - Relative Volume & Rate of Change by haciyatmazRelative Volume ( RVol ) is a critical measure of volume flows. It measures current volume in relation to the "usual" volume for this time of the day.
Rate of Change ( RoC ) is a momentum-based technical indicator that measures the percentage change in price between the current price and the price a certain number of periods ago.
Multi Exchange Relative Volume IndicatorThe Multi Exchange Relative Volume indicator is a powerful tool designed to visualize the relative volume across different exchanges. This is particularly useful for decentralized securities like forex and crypto, where volume data is spread across multiple markets. By aggregating volume data from various exchanges, this indicator helps traders identify trends, spot unusual volume spikes, and make informed trading decisions.
Key Features:
Multi-Exchange Volume Aggregation: Collects and sums the volume data from up to five different exchanges, offering a holistic view of the market activity.
Customizable Inputs: Easily select and configure up to five different exchanges of your choice to monitor their volume activity.
Relative Volume Visualization: Compares the aggregated volume against historical averages to highlight periods of high or low volume.
Color-Coded Volume Bars: Volume bars are color-coded based on the relative volume percentage, providing quick visual cues:
- Red for volume 1.0-1.5 times the average
- Orange for volume 1.5-2.0 times the average
- Green for volume 2.0-3.0 times the average
- Yellow for volume greater than 3.0 times the average
- Grey for below average volume
Dynamic Lookback Period: Adjust the lookback period to suit your trading style and timeframe, allowing for flexible analysis.
Exponential Moving Average (EMA): Includes an EMA of volume to smooth out short-term fluctuations and highlight longer-term trends.
Scalable Layout: The scaling factor allows you to zoom in or out, adjusting the visual representation of volume data to better fit your chart.
Usage:
Configure Exchanges: Select up to five exchanges you want to monitor from the input settings.
Set Lookback Period and Bars: Customize the lookback period and the number of bars to consider for calculating average volume.
Adjust Scaling: Use the scaling factor to zoom in or out on the volume data for better visualization.
Interpret Volume Bars: Analyze the color-coded volume bars to identify significant changes in volume and potential trading opportunities.
Monitor EMA: Use the EMA line to understand the trend and smooth out noise from the volume data.
The Multi Exchange Relative Volume indicator is an essential tool for traders who want to gain deeper insights into market activity across multiple exchanges. By visualizing relative volume, it helps in identifying potential breakout or breakdown points, enhancing your trading strategy.

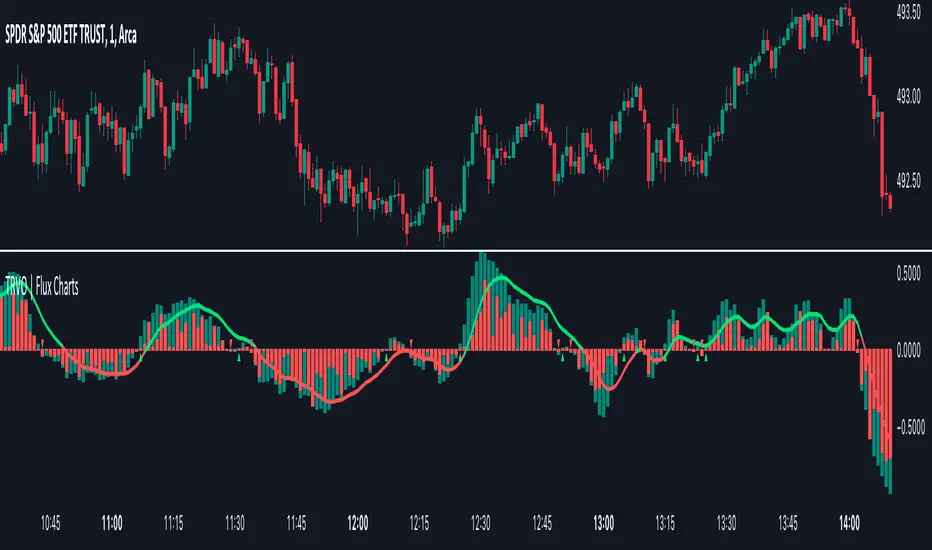
Time Relative Volume Oscillator | Flux Charts💎 GENERAL OVERVIEW
The relative volume indicator aims to improve upon the default existing relative volume indicator by comparing volumes between previous trading sessions rather than previous candles. As such, it works best on lower time frames as there is more data to compare with. The purpose of the indicator is to show how the current bar’s volume compares to the volume at the same time on previous trading days.
There exists a couple different modes and combinations that each provide a different perspective on the trading volume.
Oscillator mode
Oscillator mode starts with the same relative volume calculation, but adds two EMAs of different lengths that diverge and converge. Like the MACD, it plots the difference as a histogram. This functions as an easy way to view when relative volume is increasing or decreasing.
How to use:
The oscillator oscillates between -1 and 1. It moves along with volume direction, so this mode can be used to view the current volume direction in a lagging fashion. In oscillating markets, this indicator can give an idea of how buy/sell volume is moving and where it currently stands. Small arrows mark where reversals are predicted, when the histogram crosses over 0. The biggest pitfall of this mode is that, in a straight trending market, the two EMAs converge and it gives a false reversal signal.
Delta mode
Delta volume mode is a step up from the buy/sell volume mode. It separates both sides into the top and bottom, while also displaying the actual volume behind it in a semi transparent overlay. The best feature, however, is the delta oscillator. This oscillator fluctuates depending on how buy/sell volume is changing and plots bullish/bearish labels when the dominant side (bullish/bearish) changes. The signals, while a bit common, can sometimes dictate large direction changes, started by a dominant volume switch.
On top of different display modes, there is also one more volume mode: buy/sell volume. Instead of only showing the total volume and relative volume, it calculates and separates buying and selling volume.
This volume mode displays differently in all three viewing modes, but the basic principle is the same. It adds a vital piece of information to the chart without adding clutter. The calculation for buy/sell volume uses the candle wicks and body to compare bullish and bearish movement.
Classic mode
Classic mode takes the default volume indicator and improves upon it by also displaying the relative volume on top of the actual volume. Relative volume is calculated similarly between the three display modes: simply by comparing the current bar’s volume to the volume at the same time during previous trading days. Classic mode displays this “relative volume” as well as a simple EMA over top of the actual trading volume.
Originality
The script improves upon the existing relative volume indicator by using previous trading days rather than previous candles to generate the relative volume. On top of that, the calculation methods are unique, using different formulas like variations of the sigmoid function to smooth noise. The main issue this script aims to fix is that towards the start or end of the day relative volume indicators all see spikes as volume grows into close. The new relative volume calculations fix this problem and show what the “true” relative volume is because they compare the current bar to the “same” bar on previous trading sessions.
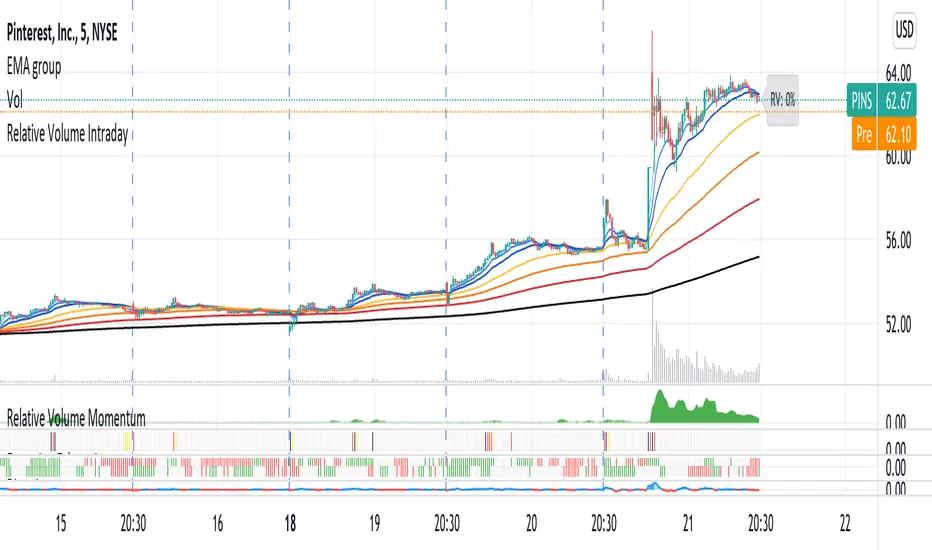
RVOL Relative Volume - IntradayHello All,
Relative Volume is one of the most important indicators and Traders should check it while trading/analyzing. it is used to identify whether the volume flows are increasing or decreasing. Relative volume measures current volume in relation to the “usual” volume for this time of the day. What is considered “usual"? For that, we have to use a historical baseline known as the average daily volume. That means how much volume a security does on a daily basis over a defined period. (This scripts runs on the time frames greater or equal 1 minute and less than 1 day)
The common definition for real-time relative volume is: Current volume for this time of day / Average volume for this time of day. It does not mean taking the volume (for example) from 10:30 am to 10:45 am and comparing it to what it does from 10:30 am to 10:45 am every day. What it truly means is to compare cumulative volumes. Therefore, this is the precise definition of real-time relative volume:
Current cumulative volume up to this time of day / Average cumulative volume up to this time of day
What should we understand while checking RVOL;
- Relative volume tell us if volume flows are increasing or decreasing
- A high relative volume tells us that there is increased trading activity in a security today
- Increased volume flows often accompany higher volatility i.e. a significant price move
Let see an example:
P.S. if you want to get more info about RVOL/Relative Volume then you can search it on the net. While developing the script this was used as reference, you can also check it for more info.
Enjoy!

TechniTrend: Relative Volume IndexRelative Volume Index (RVI)
Short Description:
Relative Volume Index (RVI) with customizable volume bands, moving averages, and alerts for high and low volume thresholds. Includes options for displaying daily and weekly relative volume for enhanced analysis.
Full Description:
The Relative Volume Index is a powerful and versatile tool designed to help traders easily identify volume trends and anomalies in the market. By comparing the current volume to its moving average, this indicator highlights significant increases or decreases in relative volume, allowing traders to catch potential breakouts, breakdowns, or volume spikes early on.
Key Features:
Relative Volume Comparison : Compares the current volume to the moving average volume over a customizable period, highlighting overbought and oversold conditions.
Volume Alerts : Customizable alert thresholds for high and low relative volume to quickly notify traders when volume exceeds predefined limits.
Custom Moving Averages : Choose from various moving average types (SMA, EMA, WMA) to calculate the average volume over a given length.
Volume Normalization : For better readability, volumes greater than 1000 are divided by 1000 and displayed with a 'K' suffix (thousands).
Volume Bands : Configurable high, average, and low volume bands for visual reference.
Daily Relative Volume : Option to display the daily relative volume in comparison to its daily average.
Weekly Average Volume : Option to display the weekly average volume for broader market trends.
Customization Options:
Length : Customize the period for calculating the moving average.
Volume Moving Average : Toggle to show/hide the volume moving average (normalized in 'K').
Alerts : Set thresholds for high and low volume alerts and configure alerts for immediate notification.
Volume Bands : Toggle to show/hide volume bands for easy visual identification of volume zones.
Daily/Weekly Relative Volume : Optional display of relative volume data on a daily and weekly basis.
This indicator provides traders with a more intuitive view of market volume dynamics, making it easier to spot significant volume changes and take action accordingly.
Recommended Settings:
High Volume Alert Threshold: 2.0
Low Volume Alert Threshold: 0.5
Length for Moving Average Calculation: 14
Show Weekly Average Volume: On for broader trend insights
Use this indicator to stay ahead of market moves by monitoring volume trends with precision.
Alerts:
High Volume Alert : Get notified when relative volume exceeds your high threshold.
Low Volume Alert : Get notified when relative volume drops below your low threshold.

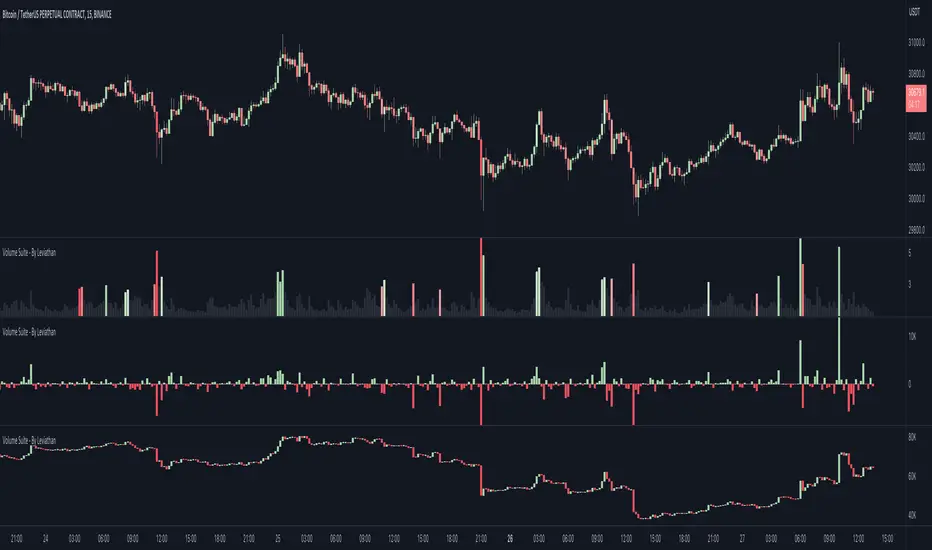
Volume Suite - By Leviathan (CVD, Volume Delta, Relative Volume)Volume Suite is an all-in-one script that includes several volume-based indicators such as CVD, Volume Delta, Relative Volume, Buy/Sell Volume, Cumulative Relative Volume and more. Additionally, it offers fully customisable appearance and features for improved data visualization, such as highlights for high volume activity, small price changes with high volume, or large price changes with low volume and more.
Data available in version 1:
- Volume Delta
Volume Delta is the net difference between Buy Volume and Sell Volume at a given bar. Positive Delta indicates that Buy Volume > Sell Volume, while Negative Delta means that Sell Volume > Buy Volume. As there is not way to get tick data on Tradingview, calculating Volume Delta is improvised by using the direction of lower timeframe candles and their volume.
- Cumulative Volume Delta (CVD)
CVD is a running total/cumulation of Volume Delta values, where positive VD gets added to the sum and negative VD gets subtracted from the sum. It can be used for trend strength analysis, divergence strategies, sentiment, etc.
- Buy/Sell Volume
Buy and Sell Volume provides an insight into volume activity in a given bar by estimating the buying/selling volume based on the direction of lower timeframe candles and their volume.
- Relative Volume
Relative Volume is used to compare current trading volume to past trading volume over a given period. For instance, a relative volume of 1.0 indicates that volume is at an average level, while a relative volume of 2.0 suggests that the volume is twice as high as the average.
- Cumulative Relative Volume (CRVOL)
CRVOL is a running total/cumulation of Relative Volume values, where RVOL at close>open gets added to the sum and RVOL at close
Strategy - Relative Volume GainersStrategy - Relative Volume Gainers
Overview:
This trading strategy, called "Relative Volume Gainers," is designed for Long Entry opportunities in the stock market. The strategy aims to identify potential trading candidates based on specific technical conditions, including volume, price movements, and indicator alignments.
Strategy Rules:
The strategy is focused solely on Long Entry positions.
The volume for the current trading day must be greater than or equal to the volume of the previous day.
The percentage change in price must be greater than or equal to 2.5%.
The Last Traded Price (LTP) must be greater than or equal to the Exponential Moving Average (EMA) 200.
The Relative Volume for the current trading day (calculated over the last 30 days) must be greater than or equal to the Simple Moving Average (SMA) of Relative Volume over the same 30 days.
The current candle on the chart should be Green or Bullish, indicating positive price movement.
The price difference between bid and ask prices should be kept to a minimum.
It's recommended to also analyze market depth for better insights.
Strategy Requirements:
Add the Exponential Moving Average (EMA) 200 to your trading chart.
This strategy can be applied on charts of any timeframe.
For intraday trading, particularly for early entry, consider using a 1-minute timeframe.
It is advisable to create a screener to identify potential trades in real-time market conditions.
Risk Warning:
Stocks that meet the strategy criteria might exhibit high volatility and a high beta, making them inherently risky to trade. Exercise caution and adhere to predetermined risk management strategies.
Determine your trading quantity based on your entry price and stop loss in order to manage risk effectively.
Quantity Calculation Formula:
Quantity calculation is crucial to manage risk and position sizing. The following formulas can be used based on your trading scenario:
Quantity with Leverage:
Quantity = (((Using Capital / 100) * Risk Percent) / (Entry Price - Stop Loss)) * Leverage
Eg: Quantity = (((10000 / 100) * 0.2) / (405.5 - 398.5)) * 5
Quantity = 14
Risk = Rs.100 (Rs.100 is 1% of Rs.10000. So the risk is 1%, means we lose only Rs.100 when the SL is hit. If SL is increased the Quantity will get reduced to maintain a fixed risk of Rs.100)
Quantity without Leverage:
Quantity = (((Using Capital / 100) * Risk Percent) / (Entry Price - Stop Loss))
Note:
Always stay informed about market conditions and be prepared for potential rapid price movements when trading stocks that meet the strategy criteria. Strictly adhere to your predefined risk management strategy to safeguard your capital.

SuperTrend + Relative Volume (Kernel Optimized)Introducing our new KDE Optimized Supertrend + Relative Volume Indicator!
This innovative indicator combines the power of the Supertrend indicator along with Relative Volume. It utilizes the Kernel Density Estimation (KDE) to estimate the probability of a candlestick marking a significant trend break or reversal.
❓How to Interpret the KDE %:
The KDE % is a crucial metric that reflects the likelihood that the current candlestick represents a true break in the SuperTrend line, supported by an increase in relative volume. It estimates the probability of a trend shift or continuation based on historical SuperTrend breaks and volume patterns:
Low KDE %: A lower probability that the current break is significant. Price action is less likely to reverse, and the trend may continue.
Moderate KDE - High KDE %: An increased possibility that a trend reversal or consolidation could occur. Traders should start watching for confirmation signals.
📌How Does It Work?
The SuperTrend indicator uses the Average True Range (ATR) to determine the direction of the trend and identifies when the price crosses the SuperTrend line, signaling a potential trend reversal. Here's how the KDE Optimized SuperTrend Indicator works:
SuperTrend Calculation: The SuperTrend indicator is calculated, and when the price breaks above (bullish) or below (bearish) the SuperTrend line, it is logged as a significant event.
Relative Volume: For each break in the SuperTrend line, we calculate the relative volume (current volume vs. the average volume over a defined period). High relative volume can suggest stronger confirmation of the trend break.
KDE Array Calculation: KDE is applied to the break points and relative volume data:
Define the KDE options: Bandwidth, Number of Steps, and Array Range (Array Max - Array Min).
Create a density range array using the defined number of steps, corresponding to potential break points.
Apply a Gaussian kernel function to the break points and volume data to estimate the likelihood of the trend break being significant.
KDE Value and Signal Generation: The KDE array is updated as each break occurs. The KDE % is calculated for the breakout candlestick, representing the likelihood of the trend break being significant. If the KDE value exceeds the defined activation threshold, a darker bullish or bearish arrow is plotted after bar confirmation. If the KDE value falls below the threshold, a more transparent arrow is drawn, indicating a possible but lower probability break.
⚙️Settings:
SuperTrend Settings:
ATR Length: The period over which the Average True Range (ATR) is calculated.
Multiplier: The multiplier applied to the ATR to determine the SuperTrend threshold.
KDE Settings:
Bandwidth: Determines the smoothness of the KDE function and the width of the influence of each break point.
Number of Bins (Steps): Defines the precision of the KDE algorithm, with higher values offering more detailed calculations.
KDE Threshold %: The level at which relative volume is considered significant for confirming a break.
Relative Volume Length: The number of historic candles used in calculating KDE %

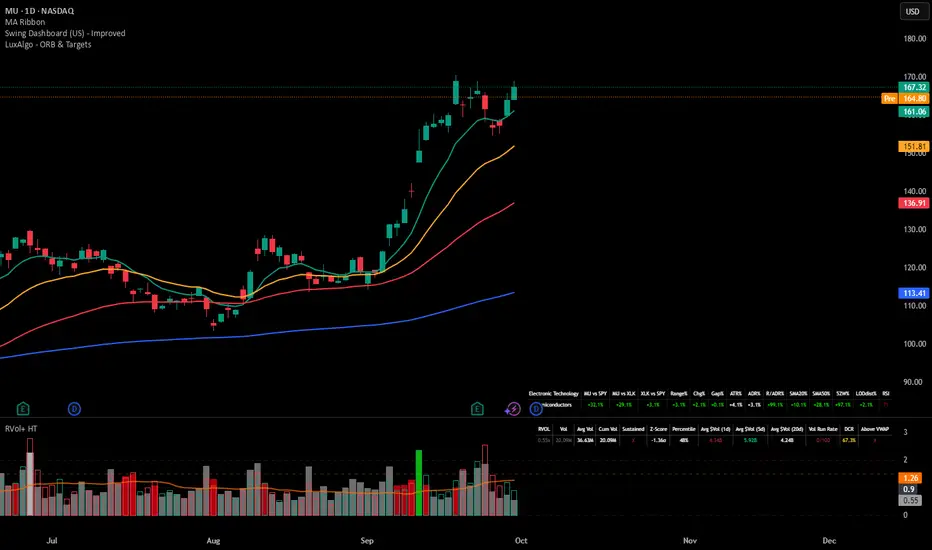
RVol+ Enhanced Relative Volume Indicator📊 RVol+ Enhanced Relative Volume Indicator
Overview
RVol+ (Relative Volume Plus) is an advanced time-based relative volume indicator designed specifically for swing traders and breakout detection. Unlike simple volume comparisons, RVol+ analyzes volume at the same time of day across multiple sessions, providing statistically significant insights into institutional activity and breakout potential.
🎯 Key Features
Core Volume Analysis
Time-Based RVol Calculation - Compares current cumulative volume to the average volume at this exact time over the past N days
Statistical Z-Score - Measures volume in standard deviations from the mean for true anomaly detection
Volume Percentile - Shows where current volume ranks historically (0-100%)
Sustained Volume Filter - 3-bar moving average prevents false signals from single-bar spikes
Breakout Detection
🚀 Confirmed Breakouts - Identifies price breakouts validated by high volume (RVol > 1.5x)
⚠️ False Breakout Warnings - Alerts when price breaks key levels on low volume (high failure risk)
Multi-Timeframe Context - Weekly volume overlay prevents chasing daily noise
Advanced Metrics
OBV Divergence Detection - Spots bullish/bearish accumulation/distribution patterns
Volume Profile Integration - Identifies institutional positioning
Money Flow Analysis - Tracks smart money vs retail activity
Extreme Volume Alerts - 🔥 Labels mark unusual spikes beyond the display cap
Visual Intelligence
Smart Color Coding:
🟢 Bright Teal = High activity (RVol ≥ 1.5x)
🟡 Medium Teal = Caution zone (RVol ≥ 1.2x)
⚪ Light Teal = Normal activity
🟠 Orange = Breakout confirmed
🔴 Red = False breakout risk
Comprehensive Stats Table:
Current Volume (formatted as M/K/B)
RVol ratio
Z-Score with significance
Volume percentile
Historical average and standard deviation
Sustained volume confirmation
📈 How to Use
For Swing Trading (1D - 3W Holds)
Perfect Setup:
✓ RVol > 1.5x (bright teal)
✓ Z-Score > 2.0 (⚡ alert)
✓ Percentile > 90%
✓ Sustained = ✓
✓ 🚀 Breakout label appears
Avoid:
✗ Red "Low Vol" warning during breakouts
✗ RVol < 1.0 at key levels
✗ Sustained volume not confirmed
Signal Interpretation
⚡ Z>2 Labels - Statistically significant volume (95th+ percentile) - highest probability moves
↗️ OBV+ Labels - Bullish accumulation (OBV rising while price consolidates)
↘️ OBV- Labels - Bearish distribution (OBV falling while price rises)
🔵 Blue Background - Weekly volume elevated (confirms daily strength)
⚙️ Customization
Basic Settings
N Day Average - Number of historical days for comparison (default: 5)
RVol Thresholds - Customize highlight levels (default: 1.2x, 1.5x)
Visual Display Cap - Prevent extreme spikes from compressing view (default: 4.0x)
Advanced Metrics (Toggle On/Off)
Z-Score analysis
Weekly RVol context
OBV divergence detection
Volume percentile ranking
Breakout signal generation
Table Customization
Position - 9 placement options to avoid chart overlap
Size - Tiny to Huge
Colors - Full customization of positive/negative/neutral values
Transparency - Adjustable background
Debug Mode
Enable Pine Logs for calculation transparency
Adjustable log frequency
Real-time calculation breakdown
🔬 Technical Details
Algorithm:
Binary search for historical lookups (O(log n) performance)
Time-zone aware session detection
DST-safe timestamp calculations
Exponentially weighted standard deviation
Anti-repainting architecture
Performance:
Optimized for max_bars_back = 5000
Efficient array management
Built-in function optimization
Memory-conscious data structures
📊 What Makes RVol+ Different?
vs. Standard Volume:
Context-aware (time-of-day matters)
Statistical significance testing
False breakout filtering
vs. Basic RVol:
Z-Score normalization (2-3 sigma detection)
Multi-timeframe confirmation
OBV divergence integration
Sustained volume filtering
Smart visual scaling
vs. Professional Tools:
Free and open-source
Fully customizable
No black-box algorithms
Educational debug logs
💡 Best Practices
Wait for Confirmation - Don't enter on first bar; wait for sustained volume ✓
Combine with Price Action - RVol validates, price structure determines entry
Weekly Context Matters - Blue background = institutional interest
Z-Score is King - Focus on ⚡ alerts for highest probability
Avoid Low Volume Breakouts - Red ⚠️ labels = high failure risk
🎓 Trading Psychology
Volume precedes price. When RVol+ shows:
High RVol + Rising OBV = Accumulation before breakout
High RVol at Resistance = Test of conviction
Low RVol on Breakout = Retail-driven (fade candidate)
Z-Score > 3 = Potential "whale" positioning
📝 Credits
Based on the time-based RVol concept from /u/HurlTeaInTheSea, enhanced with:
Statistical analysis (z-scores, percentiles)
Multi-timeframe integration
OBV divergence detection
Professional-grade visualization
Swing trading optimization
🔧 Version History
v2.0 - Enhanced Edition
Added Z-Score analysis
Multi-timeframe volume context
OBV divergence detection
Breakout confirmation system
Smart color coding
Customizable stats table
Debug logging mode
Performance optimizations
📚 Learn More
For optimal use with swing trading:
Combine with support/resistance levels
Watch for volume clusters in consolidation
Use weekly timeframe for trend confirmation
Monitor OBV divergence for early warnings
⚠️ Disclaimer
This indicator is for educational purposes. Volume analysis is one component of trading decisions. Always use proper risk management, consider multiple timeframes, and validate signals with price structure. Past performance does not guarantee future results.
🚀 Getting Started
Add indicator to chart
Adjust "N Day Average" to your preference (5-10 days typical)
Position stats table to avoid overlap
Enable features you want to monitor
Watch for 🚀 breakout confirmations!
Happy Trading! 📈
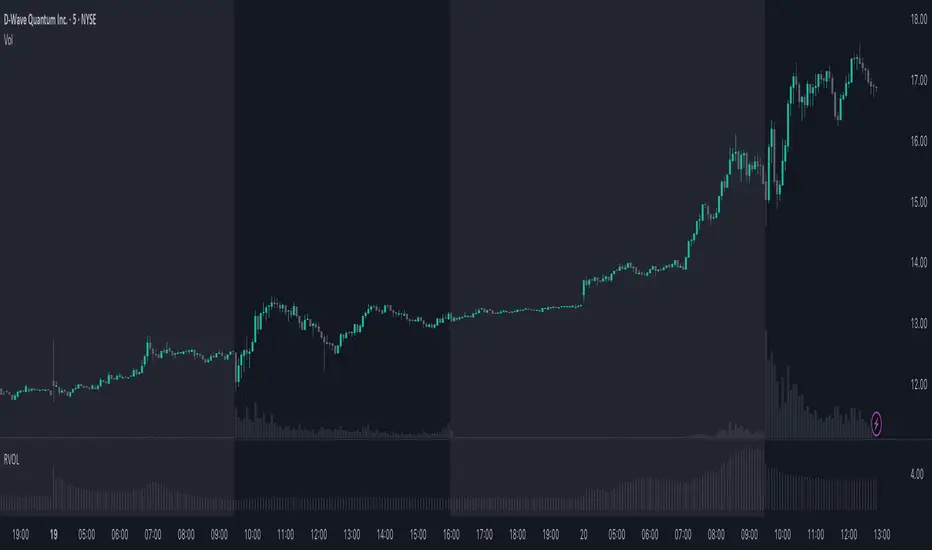
RVOL - Relative Volume IntradayIn the context of intraday trading, RVOL stands for Relative Volume. It is a technical indicator that compares the current volume of a stock to its average volume over a specified period. A RVOL above 1 suggests higher than average trading volume, potentially indicating increased interest and volatility.
The precise definition of real time relative volume is current cumulative volume up to the time of day divided by average cumulative volume up to this time of day. It means for example taking the volume from 09:45 to 10:00 and comparing it to what it does from 09:45 to 10:00 every day.
This indicator supports all timeframes from1 minute to 4 hours.
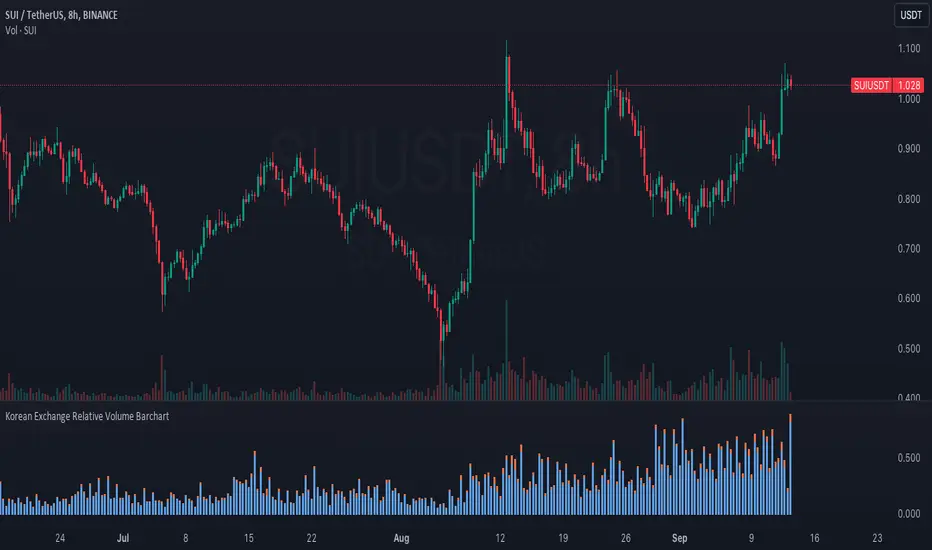
Korean Exchange Relative Volume BarchartKorean Exchange Relative Volume Barchart
The Korean Exchange Relative Volume Barchart indicator compares the trading volume of a cryptocurrency on any symbol with the combined volumes of major Korean exchanges, Upbit and Bithumb. This tool helps traders understand regional trading activities, offering insights into market sentiment influenced by Korean markets.
For example 0.5 would indicate that the Korean exchanges are doing 50% of the volume of the selected symbol.
Features:
Exchange Selection: Include or exclude Upbit and Bithumb in the comparison.
Automatic Symbol Mapping: Automatically maps the current chart's symbol to equivalent symbols on Upbit and Bithumb.
Stacked Bar Chart Visualization: Plots a stacked bar chart showing the relative volume contributions of Binance, Upbit, and Bithumb.
Usage:
Add the Indicator: Apply it to a cryptocurrency chart on TradingView.
Configure Settings: Toggle inclusion of Upbit and Bithumb in the settings.
Interpret the Chart: The stacked bar chart displays the proportion of trading volumes from each exchange.
Notes:
Symbol Compatibility: Ensure the cryptocurrency is listed on the Korean exchanges for accurate comparison.
Data Accuracy: Volumes are compared in the same base currency (e.g., BTC), so no exchange rate conversion is necessary.
Enhance your trading analysis by understanding the influence of Korean exchanges on cryptocurrency volumes with the Korean Exchange Volume Comparison indicator.
4C Volume w/ Relative Volume at TimeThis is a Volume indicator that also shows Relative Volume at Time (RVOL).
The RVOL is easily visible as a background color, that changes between Low and High RVOL colors.
The RVOL portion of the indicator is a modified version of the 'Relative Volume At Time' indicator by Tradingview (which has been the best/most accurate RVOL indicator i have seen yet on Tradingview, and seems to closely match the how the "Zanger Volume" indicator works).
Elevated RVOL can be a very important criteria for trading , especially on lower time frames.
This indicator can be used as a simple filter when looking at charts to determine whether it should be traded or not, based on the RVOL.
Higher volume/participation relative to previous time periods can lead to better follow through of moves and price action, and can lead to trending conditions.
Lower RVOL can lead to choppy market conditions, with lower participation and follow through on chart patterns.
The RVOL portion of the indicator draws from the Tradingview 'Relative Volume At Time' indicator developed by authors @e2e4mfck and @LucF , for TradingView.
This indicator takes the Past Volume mark and changes it into a background color.
High RVOL = When the day's cumulative volume is greater than the Past Volume levels, then the background is painted Blue by default
Low RVOL = When the day's cumulative volume is lower than the Past Volume levels, then the background is painted Purple by default
See annotated examples in the chart Below, which compares/contrasts this new indicator with the RVOL indicator by Tradingview:
Portions of the 'Relative Volume At Time' indictor code have been removed to clean up the script.
Plans in the future are to remove more code were possible, to further refine the script and speed up the processing times for the indicator.
If anyone is able to strip out more and keep it functioning the same, please let me know.
Enjoy.
Credit also goes to author @LazyBear . Portions of the Volume indicator is adapted from - HawkEye Volume Indicator

Early Relative Volume"Buy or Sell when you see a spike in volume" is advice that you often hear, the problem for me was that you only find out that volume is spiking after the fact. So that's why I created the Early Relative Volume indicator.
The Early Relative Volume indicator takes the amount of time that has passed for the current bar, let's say 10 seconds, and compares the volume of that first 10 seconds to the average volume in 10 seconds of the previous candle.
That means that it will tell you if the volume thus far in the current candle is more or less than the relative volume of the previous candle, so that you can potentially get an indication that the volume of the current candle is going to be greater or less than the previous candle.
This approach is of course not perfect, and obviously the values update as the current candle progresses, but I've found it useful to identify early breakout candles.
There is also an option to do the same calculation with the size of the body of the candle, by enabling the "Blue bars if candle body and volume bigger" option. It will only turn blue of both the volume and the size of the candle's body is calculated to be bigger.
I hope this helps you in your trading!
Volume Spikes Pro - relative volume comparisonThe Enhanced Volume Spike Detector builds on the basic relative volume comparison by adding price direction analysis and more sophisticated categorization of volume events.
Directional Analysis
This indicator doesn't just identify volume spikes, but categorizes them as:
- **Bullish**: Volume spike with upward price movement
- **Bearish**: Volume spike with downward price movement
- **Neutral**: Volume spike with minimal price change
- **Strong**: Exceptional volume spike (2.5x+ default) regardless of direction
Visual Classification
Different color schemes instantly communicate the volume spike type:
- Green for bullish volume (price rising)
- Red for bearish volume (price falling)
- Dark Green for strong bullish volume
- Dark Red for strong bearish volume (price falling)
Customization Tips
- For day trading or short timeframes: Consider reducing MA length to 10-15
- For swing trading: The default 20 is appropriate
- For position trading or longer timeframes: Consider increasing to 30-50
- For more selective signals: Increase multiplier to 2.0 or higher
- For more comprehensive detection: Decrease multiplier to 1.3-1.4

RVM Relative Volume MomentumRVM Relative Volume Momentum is an indicator that shows relative volume as a percentage of volume over the last 5 bars to the average volume of the same 5 bars of the previous 3 days.
RVI Relative Volume IntradayRVI Relative Volume Intraday is a simple label next to the last bar that shows the relative volume as a percentage of the ratio of today's volume to the average volume for the same intraday time period of the last five days. Useful for break-out intraday strategies.
