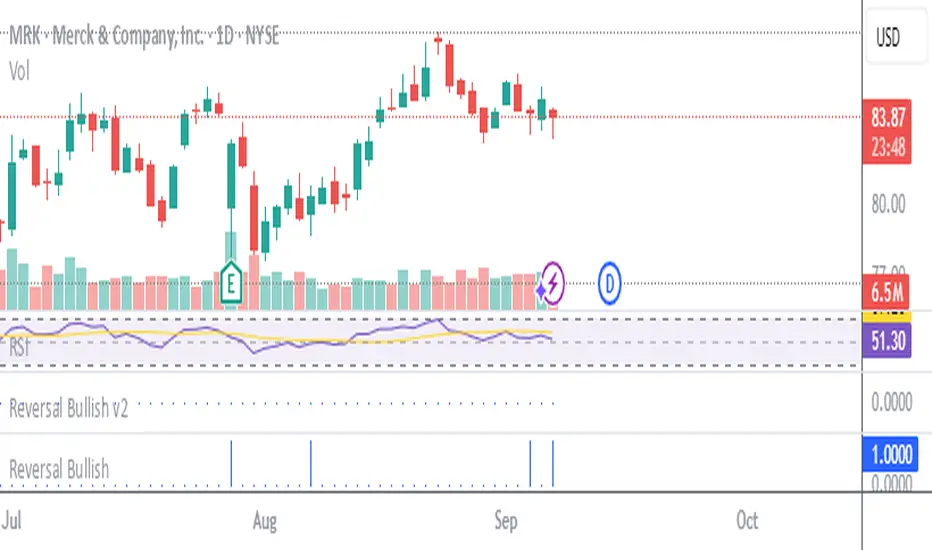
Stockbee Reversal Bullish v2Custom indicator for identifying stocks that meet the Stockbee's Reversal Bullish New criteria. This can be used as a standalone indicator or use it to screen for stocks in Pine Screener.Chỉ báo Pine Script®của traderabhi8136
Stockbee Reversal BullishCustom indicator for identifying stocks that meet the Stockbee's Reversal Bullish criteria. This can be used as a standalone indicator or use it to screen for stocks in Pine Screener.Chỉ báo Pine Script®của traderabhi8119
Combo Backtest 123 Reversal & MASS Index This is combo strategies for get a cumulative signal. First strategy This System was created from the Book "How I Tripled My Money In The Futures Market" by Ulf Jensen, Page 183. This is reverse type of strategies. The strategy buys at market, if close price is higher than the previous close during 2 days and the meaning of 9-days Stochastic Slow Oscillator is lower than 50. The strategy sells at market, if close price is lower than the previous close price during 2 days and the meaning of 9-days Stochastic Fast Oscillator is higher than 50. Second strategy The Mass Index was designed to identify trend reversals by measuring the narrowing and widening of the range between the high and low prices. As this range widens, the Mass Index increases; as the range narrows the Mass Index decreases. The Mass Index was developed by Donald Dorsey. WARNING: - For purpose educate only - This script to change bars colors.Chiến lược Pine Script®của HPotter22251
Combo Backtest 123 Reversal & Market Facilitation Index This is combo strategies for get a cumulative signal. First strategy This System was created from the Book "How I Tripled My Money In The Futures Market" by Ulf Jensen, Page 183. This is reverse type of strategies. The strategy buys at market, if close price is higher than the previous close during 2 days and the meaning of 9-days Stochastic Slow Oscillator is lower than 50. The strategy sells at market, if close price is lower than the previous close price during 2 days and the meaning of 9-days Stochastic Fast Oscillator is higher than 50. Second strategy The Market Facilitation Index is an indicator that relates price range to volume and measures the efficency of price movement. Use the indicator to determine if the market is trending. If the Market Facilitation Index increased, then the market is facilitating trade and is more efficient, implying that the market is trending. If the Market Facilitation Index decreased, then the market is becoming less efficient, which may indicate a trading range is developing that may be a trend reversal. WARNING: - For purpose educate only - This script to change bars colors.Chiến lược Pine Script®của HPotter22446
Combo Backtest 123 Reversal & Fisher Transform Indicator This is combo strategies for get a cumulative signal. First strategy This System was created from the Book "How I Tripled My Money In The Futures Market" by Ulf Jensen, Page 183. This is reverse type of strategies. The strategy buys at market, if close price is higher than the previous close during 2 days and the meaning of 9-days Stochastic Slow Oscillator is lower than 50. The strategy sells at market, if close price is lower than the previous close price during 2 days and the meaning of 9-days Stochastic Fast Oscillator is higher than 50. Second strategy Market prices do not have a Gaussian probability density function as many traders think. Their probability curve is not bell-shaped. But trader can create a nearly Gaussian PDF for prices by normalizing them or creating a normalized indicator such as the relative strength index and applying the Fisher transform. Such a transformed output creates the peak swings as relatively rare events. Fisher transform formula is: y = 0.5 * ln ((1+x)/(1-x)) The sharp turning points of these peak swings clearly and unambiguously identify price reversals in a timely manner. WARNING: - For purpose educate only - This script to change bars colors.Chiến lược Pine Script®của HPotter169
Combo Strategy 123 Reversal & Fisher Transform Indicator This is combo strategies for get a cumulative signal. First strategy This System was created from the Book "How I Tripled My Money In The Futures Market" by Ulf Jensen, Page 183. This is reverse type of strategies. The strategy buys at market, if close price is higher than the previous close during 2 days and the meaning of 9-days Stochastic Slow Oscillator is lower than 50. The strategy sells at market, if close price is lower than the previous close price during 2 days and the meaning of 9-days Stochastic Fast Oscillator is higher than 50. Second strategy Market prices do not have a Gaussian probability density function as many traders think. Their probability curve is not bell-shaped. But trader can create a nearly Gaussian PDF for prices by normalizing them or creating a normalized indicator such as the relative strength index and applying the Fisher transform. Such a transformed output creates the peak swings as relatively rare events. Fisher transform formula is: y = 0.5 * ln ((1+x)/(1-x)) The sharp turning points of these peak swings clearly and unambiguously identify price reversals in a timely manner. WARNING: - For purpose educate only - This script to change bars colors.Chỉ báo Pine Script®của HPotter33102
My VWAP Reversal + Pivot Points StandardThis indicator, with the addition of a standard VWAP indicator to the 5m chart, helps the operator when using a closing candle Price to initiate a VWAP Reversal strategy. The strategy involves Price gapping up, look for a Close below the 1st 5m candle Low; else look for a Close above the 1st 5m candle High. On a break of VWAP, take the trade in the opposite direction of the gap, hence the VWAP Reversal. Not my own strat, credit to T3 Newsbeat, publicly posted on YouTube. The Pivot Points Standard in the Pine 4 user manual, was the base source code, and leaving it here will allow me to remove the PP indicator I was using.Chỉ báo Pine Script®của mikeram197188758
Combo Backtest 123 Reversal and Accelerator Oscillator (AC) This is combo strategies for get a cumulative signal. Result signal will return 1 if two strategies is long, -1 if all strategies is short and 0 if signals of strategies is not equal. First strategy This System was created from the Book "How I Tripled My Money In The Futures Market" by Ulf Jensen, Page 183. This is reverse type of strategies. The strategy buys at market, if close price is higher than the previous close during 2 days and the meaning of 9-days Stochastic Slow Oscillator is lower than 50. The strategy sells at market, if close price is lower than the previous close price during 2 days and the meaning of 9-days Stochastic Fast Oscillator is higher than 50. Second strategy The Accelerator Oscillator has been developed by Bill Williams as the development of the Awesome Oscillator. It represents the difference between the Awesome Oscillator and the 5-period moving average, and as such it shows the speed of change of the Awesome Oscillator, which can be useful to find trend reversals before the Awesome Oscillator does. WARNING: - For purpose educate only - This script to change bars colors.Chiến lược Pine Script®của HPotter1154
Combo Strategies 123 Reversal and Accelerator Oscillator (AC) This is combo strategies for get a cumulative signal. Result signal will return 1 if two strategies is long, -1 if all strategies is short and 0 if signals of strategies is not equal. First strategy This System was created from the Book "How I Tripled My Money In The Futures Market" by Ulf Jensen, Page 183. This is reverse type of strategies. The strategy buys at market, if close price is higher than the previous close during 2 days and the meaning of 9-days Stochastic Slow Oscillator is lower than 50. The strategy sells at market, if close price is lower than the previous close price during 2 days and the meaning of 9-days Stochastic Fast Oscillator is higher than 50. Second strategy The Accelerator Oscillator has been developed by Bill Williams as the development of the Awesome Oscillator. It represents the difference between the Awesome Oscillator and the 5-period moving average, and as such it shows the speed of change of the Awesome Oscillator, which can be useful to find trend reversals before the Awesome Oscillator does. WARNING: - This script to change bars colors.Chỉ báo Pine Script®của HPotter3364
Reversal Radar (ConfluenceJP)Reversals Bullish to help see the trend coming when it is difficult to see. Nothing Guaranteed just another tool to help.Chỉ báo Pine Script®của JayP_KalEl5
AI Reversal Signals Custom [wjdtks255]📊 Indicator Overview: AI Reversal Signals Custom This indicator is a comprehensive trend-following and reversal detection tool. It combines the long-term trend bias of a 200 EMA with highly sensitive RSI-based reversal signals and momentum visualization. It is designed to capture market bottoms and tops by identifying exhaustion points in price action. Key Features 200 EMA (Trend Filter): A gold line representing the long-term institutional trend. It helps traders distinguish between "buying the dip" and "catching a falling knife." Reversal Buy/Sell Labels: Real-time signals that appear when the market recovers from extreme overbought or oversold conditions. Dynamic Background Clouds: Visual indicators of trend strength changes, highlighting potential entry zones. Momentum Histogram: Internal calculations mimic the "Bottom Bars" seen in professional suites to track the velocity of price movement. 📈 Trading Strategy (How to Trade) 1. High-Probability Long Setup (Buy) Trend Confirmation: Price should ideally be trading above the 200 EMA for the highest success rate. Signal: Wait for the "BUY" label to appear below the candle. Momentum: Confirm with the Light Green background or histogram shift indicating recovery. Entry: Enter on the close of the signal candle. 2. High-Probability Short Setup (Sell) Trend Confirmation: Price should ideally be trading below the 200 EMA. Signal: Wait for the "SELL" label to appear above the candle. Momentum: Confirm with the Red background or histogram fading from green to red. Entry: Enter on the close of the signal candle. 3. Risk Management Stop Loss: Place your Stop Loss slightly below the recent swing low for Buy orders, or above the recent swing high for Sell orders. Take Profit: Exit when the price reaches a major support/resistance level or when an opposing signal appears. 💡 Professional Tip For the best results, use this indicator on the 15-minute or 1-hour timeframes. The most powerful "Ultimate Reversal" signals occur when there is a Bullish Divergence (Price making lower lows while the RSI makes higher lows) followed by a confirmed "BUY" label.Chỉ báo Pine Script®của wjdtks255Cập nhật 240
MACD Volume Strategy (BBO + MACD State, Reversal Type)Overview MACD Volume Strategy (BBO + MACD State, Reversal Type) is a momentum-based reversal system that combines MACD crossover logic with volume filtering to enhance signal accuracy and minimize noise. It aims to identify structural trend shifts and manage risk using predefined parameters. ※This strategy is for educational and research purposes only. All results are based on historical simulations and do not guarantee future performance. Strategy Objectives Identify early trend transitions with high probability Filter entries using volume dynamics to validate momentum Maintain continuous exposure using a reversal-style model Apply a consistent 1:1.5 risk-to-reward ratio per trade Key Features Integrated MACD and volume oscillator filtering Zero repainting (all signals confirmed on closed candles) Automatic position flipping for seamless direction shifts Stop-loss and take-profit based on recent structural highs/lows Trading Rules Long Entry Conditions MACD crosses above the zero line (BBO Buy arrow) Volume oscillator is positive (short EMA > long EMA) MACD is above the signal line Close any existing short and enter a new long Short Entry Conditions MACD crosses below the zero line (BBO Sell arrow) Volume oscillator is positive MACD is below the signal line Close any existing long and enter a new short Exit Rules Take Profit (TP) = Entry ± (risk distance × 1.5) Stop Loss (SL) = Recent swing low (for long) or high (for short) Early Exit = Triggered when a reversal signal appears (flip logic) Risk Management Parameters Pair: ETH/USD Timeframe: 10-minute Starting Capital: $3,000 Commission: 0.02% Slippage: 2 pip Risk per Trade: 5% of account equity (adjusted for sustainable practice) Total Trades: 312 (backtest on selected dataset) ※Risk parameters are fully configurable and should be adjusted to suit each trader's personal setup and broker conditions. Parameters & Configurations Volume Short Length: 6 Volume Long Length: 12 MACD Fast Length: 11 MACD Slow Length: 21 Signal Smoothing: 10 Oscillator MA Type: SMA Signal Line MA Type: SMA Visual Support Green arrow = Long entry Red arrow = Short entry MACD lines, signal line, and histogram SL/TP markers plotted directly on the chart Strategic Advantages & Uniqueness Volume filtering eliminates low-participation, weak signals Structurally aligned SL/TP based on recent market pivots No repainting — decisions are made only on closed candles Always in the market due to the reversal-style framework Inspirations & Attribution This strategy is inspired by the excellent work of: Bitcoinblockchainonline – “BBO_Roxana_Signals MACD + vol” Leveraging MACD zero-line cross and volume oscillator for intuitive signal generation. HasanRifat – “MACD Fake Filter ” Introduced a signal filter using MACD wave height averaging to reduce false positives. This strategy builds upon those ideas to create a more automated, risk-aware, and technically adaptive system. Summary MACD Volume Strategy is a clean, logic-first automated trading system built for precision-seeking traders. It avoids discretionary bias and provides consistent signal logic under backtested historical conditions. 100% mechanical — no discretionary input required Designed for high-confidence entries Can be extended with filters, alerts, or trailing stops ※Strategy performance depends on market context. Past performance is not indicative of future results. Use with proper risk management and careful configuration. Chiến lược Pine Script®của PakunFX122
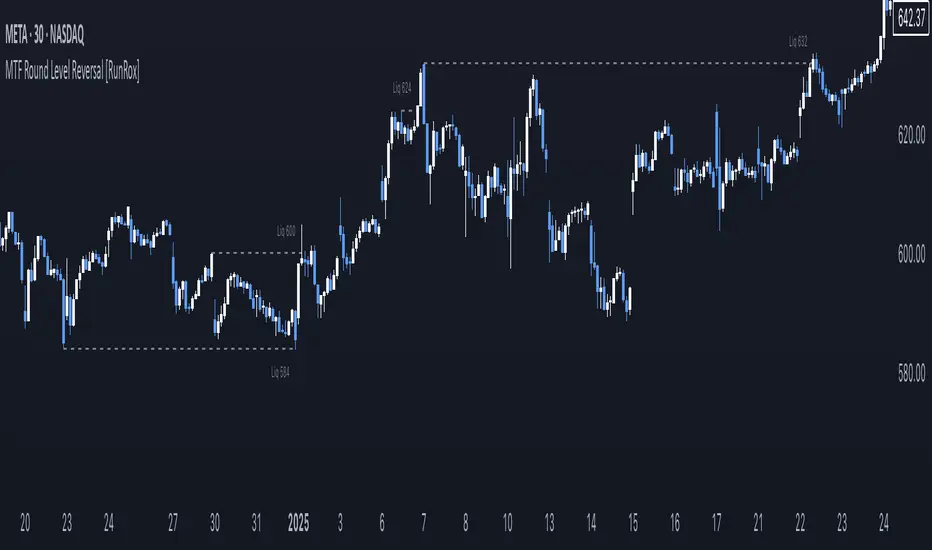
MTF Round Level Reversal [RunRox]🧲 MTF Round Level Reversal is an indicator designed to highlight price levels on the chart where the market encountered significant resistance or support at round numbers, failing to break through large clusters of orders. In many cases, price revisits these round-number levels to absorb the remaining liquidity, offering potential reversal or continuation trade opportunities. ✏️ EXAMPLE Here’s an example demonstrating how this indicator works and how its logic is structured: As shown in the screenshot above, price encountered resistance at round-number levels, clearly reacting off these areas. Afterward, the market pulled back, presenting opportunities to enter trades targeting these previously established open levels. This logic is based on the observation that price often seeks to revisit these open round-number levels due to the residual liquidity resting there. While effective across various markets, this indicator performs particularly well with stocks or assets priced at higher values. For a level to appear on the chart, price must first encounter a round-number value and clearly reverse from it, leaving a visible reaction on the chart. After this occurs, the indicator will mark this level as fully formed and display it as an active reversal area. ⚙️ SETTINGS 🔷 Timeframe – Choose any timeframe from which you’d like the indicator to source level data. 🔷 Period – Defines the number of candles required on both sides (left and right) to confirm and fully form a level. 🔷 Rounding Level – Adjusts price rounding precision when detecting levels (from 0.0001 up to 5000). 🔷 Color – Customize the color and transparency of displayed levels. 🔷 Line Style – Select the desired line style for level visualization. 🔷 Label Size – Set the font size for the level labels displayed on the chart. 🔷 Move Label to the Right – Move level labels to the right side of the screen for better visibility. 🔷 Label Offset – Specifies how many bars labels should be offset from the chart’s right edge. 🔷 Delete Filled Level – Automatically removes levels from the chart after they’ve been revisited or filled. 🔷 Calculation Bars – Determines the number of recent bars considered when calculating and identifying levels. 🔶 There are numerous ways to apply this indicator in your trading strategy. You can look for trades targeting these round-number levels or identify reversal setups forming at these high-liquidity zones. The key insight is understanding that these levels represent significant liquidity areas, which price frequently revisits and retests. We greatly appreciate your feedback and suggestions to further improve and enhance this indicator!Chỉ báo Pine Script®của RunRox22203
Rob Booker Reversal Tabs StrategyRob Booker Reversal Tabs Strategy is an updated version of Rob Bookers Reversal Tab study: Rob Booker Reversal Tabs While the original is a Pinescript study, this version can be switched between strategy and indicator mode. Rob Bookers script generates reversal signal based on MACD and Stochastics, it is not a true reversal system, default pyramiding value is set to 5. Inputs determine MACD and Stochastics settings. The only additional input is the "Strategy Mode" checkbox. This script works well on its own for some tickers, but like any reversal pattern generating scripts, traders will profit from looking at overall price action and trend strength before making a trade. From the original: A simple reversal pattern indicator that uses MACD and Stochastics. Created by Rob Booker and programmed by Andrew Palladino. Please note that I only updated the original to V5 and edited it to be a strategy, which was a grand total of 5 minutes of work. I updated it because I wanted to see how the script performs as a strategy and I'm publishing it in case others would like to use it. I take no credit whatsoever for the original and WILL take this version down if Rob Booker or his Team ask me to or decide to release their own strategy version of the original. Check out Rob Bookers scripts and ideas on his Tradingview account: robbookerChiến lược Pine Script®của Powerscooter272
K's Reversal Indicator IK's reversal indicator I is a special combination between Bollinger bands and the MACD oscillator. It is a contrarian indicator that depends on the following conditions: • A buy signal is generated whenever the current market price is below the 100-period lower Bollinger band while simultaneously, the MACD value must be above its signal line. At the same time, the previous MACD value must be below its previous signal line. • A sell (short) signal is generated whenever the current market price is above the 100-period upper Bollinger band while simultaneously, the MACD value must be below its signal line. At the same time, the previous MACD value must be above its previous signal line. The way to use K's reversal indicator is to combine it with your already long/short bias in a sideways/range market in order to maximize the probability of success. Limitations of the indicator include the following: • There are no clear exit rules that work well on average across the markets. Even though K’s reversal indicator gives contrarian signals, it does not show when to exit the positions. • As with other indicators, it underperforms on some markets and is not to be used everywhere. • False signals tend to occur during trending markets but there is no proven way to detect a false signal.Chỉ báo Pine Script®của Sofien-Kaabar3636 1.7 K
Naked Bar Upward ReversalAMEX:SPY The Naked Bar Upward Reversal is a three bar candlestick pattern with an inside candle as a entry point. This pattern is bullish since it has a candle closing red from the previous candle; the most bearish pattern possible. The following inside candle is a reversal of its previous candle with an open above the previous candle's close. Look to buy the next open above the inside candle's close. This is a bullish reversal pattern and should be used in this context. Successful entries are found in corrections along an upward trend, or buying into a dip. Performance drops when the pattern appears at tops. To improve profitability, use a cluster of evidence to enhance the performance of this pattern. The intended time frame is within the daily and weekly. Chỉ báo Pine Script®của MrDevDevy3372
Pivot Reversal strategy long onlyPivot Point Reversal Strategy Pivot point reversal strategy is based on the first support level’s price action during the bullish trend and the first resistance level during the bearish trend . Traders follow the main trend and enter into the trade after reversal analyzing pivot point levels. This version is an upgraded version, combining the initial pivot point reversal strategy together with one of the most accuracy moving average in my opinion for day trade, the Least square moving average. At the same time I applied an option to backtest using a date range and a leverage calculator. The default options are optimized for BTC /USDT 2H charts, using 0.1% comission fee. If you have any questions, let me knowChiến lược Pine Script®của exlux276
Combo Backtest 123 Reversal & Key Reversal Up This is combo strategies for get a cumulative signal. First strategy This System was created from the Book "How I Tripled My Money In The Futures Market" by Ulf Jensen, Page 183. This is reverse type of strategies. The strategy buys at market, if close price is higher than the previous close during 2 days and the meaning of 9-days Stochastic Slow Oscillator is lower than 50. The strategy sells at market, if close price is lower than the previous close price during 2 days and the meaning of 9-days Stochastic Fast Oscillator is higher than 50. Second strategy A key reversal is a one-day trading pattern that may signal the reversal of a trend. Other frequently-used names for key reversal include "one-day reversal" and "reversal day." How Does a Key Reversal Work? Depending on which way the stock is trending, a key reversal day occurs when: In an uptrend -- prices hit a new high and then close near the previous day's lows. In a downtrend -- prices hit a new low, but close near the previous day's highs WARNING: - For purpose educate only - This script to change bars colors.Chiến lược Pine Script®của HPotter129
Combo Backtest 123 Reversal & Key Reversal Down This is combo strategies for get a cumulative signal. First strategy This System was created from the Book "How I Tripled My Money In The Futures Market" by Ulf Jensen, Page 183. This is reverse type of strategies. The strategy buys at market, if close price is higher than the previous close during 2 days and the meaning of 9-days Stochastic Slow Oscillator is lower than 50. The strategy sells at market, if close price is lower than the previous close price during 2 days and the meaning of 9-days Stochastic Fast Oscillator is higher than 50. Second strategy A key reversal is a one-day trading pattern that may signal the reversal of a trend. Other frequently-used names for key reversal include "one-day reversal" and "reversal day." How Does a Key Reversal Work? Depending on which way the stock is trending, a key reversal day occurs when: In an uptrend -- prices hit a new high and then close near the previous day's lows. In a downtrend -- prices hit a new low, but close near the previous day's highs WARNING: - For purpose educate only - This script to change bars colors.Chiến lược Pine Script®của HPotter2278
Swing/Daytrading strategy with reversal option Hello, today I bring a swing reversal strategy that work on all financial markets. It uses timeframes starting from 1h, the bigger the better. Its very dangerous because it has no stop loss, neither a take profit. Our exit condition is based on the reversal on the entry . For entry we have 2 types : normal and reversal Lets say we want to go long , for that we check the last CLOSE of a candle with the previos HIGH. If its higher than that, and at the same time CLOSE is bigger than the moving average, we have a long entry. For short we have CLOSE with the previous LOW. If its lower than that and at the same time is lower than moving average, we have a short entry. For moving average we use T3 MA For reversal what I do, is , I take the short condition and I apply it to long, and for long I apply the short condition. On many cases I found out it work amazingly. I forgot to add: it also has a time entry system, so we use the best hours/sessions for entries . Exit a trade: lets say we enter short, when we find a long condition, we close short and enter into long. Viceversa for long. If you have any questions, let me know. Enjoy it :)Chiến lược Pine Script®của SoftKill2111589
Key Reversal Up Backtest A key reversal is a one-day trading pattern that may signal the reversal of a trend. Other frequently-used names for key reversal include "one-day reversal" and "reversal day." How Does a Key Reversal Work? Depending on which way the stock is trending, a key reversal day occurs when: In an uptrend -- prices hit a new high and then close near the previous day's lows. In a downtrend -- prices hit a new low, but close near the previous day's highs WARNING: - For purpose educate only - This script to change bars colors.Chiến lược Pine Script®của HPotter338
Key Reversal Down Backtest A key reversal is a one-day trading pattern that may signal the reversal of a trend. Other frequently-used names for key reversal include "one-day reversal" and "reversal day." How Does a Key Reversal Work? Depending on which way the stock is trending, a key reversal day occurs when: In an uptrend -- prices hit a new high and then close near the previous day's lows. In a downtrend -- prices hit a new low, but close near the previous day's highs WARNING: - For purpose educate only - This script to change bars colors.Chiến lược Pine Script®của HPotter22132
Key Reversal Up A key reversal is a one-day trading pattern that may signal the reversal of a trend. Other frequently-used names for key reversal include "one-day reversal" and "reversal day." How Does a Key Reversal Work? Depending on which way the stock is trending, a key reversal day occurs when: In an uptrend -- prices hit a new high and then close near the previous day's lows. In a downtrend -- prices hit a new low, but close near the previous day's highsChỉ báo Pine Script®của HPotter33593