Savitzky Golay Median Filtered RSI [BackQuant]Savitzky Golay Median Filtered RSI
Introducing BackQuant's Savitzky Golay Median Filtered RSI, a cutting-edge indicator that enhances the classic Relative Strength Index (RSI) by applying both a Savitzky-Golay filter and a median filter to provide smoother and more reliable signals. This advanced approach helps reduce noise and captures true momentum trends with greater precision. Let’s break down how the indicator works, the features it offers, and how it can improve your trading strategy.
Core Concept: Relative Strength Index (RSI)
The Relative Strength Index (RSI) is a widely used momentum oscillator that measures the speed and change of price movements. It oscillates between 0 and 100, with levels above 70 typically indicating overbought conditions and levels below 30 indicating oversold conditions. However, the standard RSI can sometimes generate noisy signals, especially in volatile markets, making it challenging to identify reliable entry and exit points.
To improve upon the traditional RSI, this indicator introduces two powerful filters: the Savitzky-Golay filter and a median filter.
Savitzky-Golay Filter: Smoothing with Precision
The Savitzky-Golay filter is a digital filtering technique used to smooth data while preserving important features, such as peaks and trends. Unlike simple moving averages that can distort important price data, the Savitzky-Golay filter uses polynomial regression to fit the data, providing a more accurate and less lagging result.
In this script, the Savitzky-Golay filter is applied to the RSI values to smooth out short-term fluctuations and provide a more reliable signal. By using a window size of 5 and a polynomial degree of 2, the filter effectively reduces noise without compromising the integrity of the underlying price movements.
Median Filter: Reducing Outliers
After applying the Savitzky-Golay filter, the median filter is applied to the smoothed RSI values. The median filter is particularly effective at removing short-lived outliers, further enhancing the accuracy of the RSI by reducing the impact of sudden and temporary price spikes or drops. This combination of filters creates an ultra-smooth RSI that is better suited for detecting true market trends.
Long and Short Signals
The Savitzky Golay Median Filtered RSI generates long and short signals based on user-defined threshold levels:
Long Signals: A long signal is triggered when the filtered RSI exceeds the Long Threshold (default set at 176). This indicates that momentum is shifting upward, and it may present a good buying opportunity.
Short Signals: A short signal is generated when the filtered RSI falls below the Short Threshold (default set at 162). This suggests that momentum is weakening, potentially signaling a selling opportunity or exit from a long position.
These threshold levels can be adjusted to suit different market conditions and timeframes, allowing traders to fine-tune the sensitivity of the indicator.
Customization and Visualization Options
The Savitzky Golay Median Filtered RSI comes with several customization options, enabling traders to tailor the indicator to their specific needs:
Calculation Source: Select the price source for the RSI calculation (default is OHLC4, but it can be changed to close, open, high, or low prices).
RSI Period: Adjust the lookback period for the RSI calculation (default is 14).
Median Filter Length: Control the length of the median filter applied to the smoothed RSI, affecting how much noise is removed from the signal.
Threshold Levels: Customize the long and short thresholds to define the sensitivity for generating buy and sell signals.
UI Settings: Choose whether to display the RSI and thresholds on the chart, color the bars according to trend direction, and adjust the line width and colors used for long and short signals.
Visual Feedback: Color-Coded Signals and Thresholds
To make the signals easier to interpret, the indicator offers visual feedback by coloring the price bars and the RSI plot according to the current market trend:
Green Bars indicate long signals when momentum is bullish.
Red Bars indicate short signals when momentum is bearish.
Gray Bars indicate neutral or undecided conditions when no clear signal is present.
In addition, the Long and Short Thresholds can be plotted directly on the chart to provide a clear reference for when signals are triggered, allowing traders to visually gauge the strength of the RSI relative to its thresholds.
Alerts for Automation
For traders who prefer automated notifications, the Savitzky Golay Median Filtered RSI includes built-in alert conditions for long and short signals. You can configure these alerts to notify you when a buy or sell condition is met, ensuring you never miss a trading opportunity.
Trading Applications
This indicator is versatile and can be used in a variety of trading strategies:
Trend Following: The combination of Savitzky-Golay and median filtering makes this RSI particularly useful for identifying strong trends without being misled by short-term noise. Traders can use the long and short signals to enter trades in the direction of the prevailing trend.
Reversal Trading: By adjusting the threshold levels, traders can use this indicator to spot potential reversals. When the RSI moves from overbought to oversold levels (or vice versa), it may signal a shift in market direction.
Swing Trading: The smoothed RSI provides a clear signal for short to medium-term price movements, making it an excellent tool for swing traders looking to capitalize on momentum shifts.
Risk Management: The filtered RSI can be used as part of a broader risk management strategy, helping traders avoid false signals and stay in trades only when the momentum is strong.
Final Thoughts
The Savitzky Golay Median Filtered RSI takes the classic RSI to the next level by applying advanced smoothing techniques that reduce noise and improve signal reliability. Whether you’re a trend follower, swing trader, or reversal trader, this indicator provides a more refined approach to momentum analysis, helping you make better-informed trading decisions.
As with all indicators, it is important to backtest thoroughly and incorporate sound risk management strategies when using the Savitzky Golay Median Filtered RSI in your trading system.
Thus following all of the key points here are some sample backtests on the 1D Chart
Disclaimer: Backtests are based off past results, and are not indicative of the future.
INDEX:BTCUSD
INDEX:ETHUSD
BINANCE:SOLUSD
Tìm kiếm tập lệnh với "rsi"

MTF RSI+CMO PROThis RSI+CMO script combines the Relative Strength Index (RSI) and Chande Momentum Oscillator (CMO), providing a powerful tool to help traders analyze price momentum and spot potential turning points in the market. Unlike using RSI alone, the CMO (especially with a 14-period length) moves faster and accentuates price pops and dips in the histogram, making price shifts more apparent.
Indicator Features:
➡️RSI and CMO Combined: This indicator allows traders to track both RSI and CMO values simultaneously, highlighting differences in their movement. RSI and CMO values are both plotted on the histogram, while CMO values are also drawn as a line moving through the histogram, giving a visual representation of their relationship. The often faster-moving CMO accentuates short-term price movements, helping traders spot subtle shifts in momentum that the RSI might smooth out.
➡️Multi-Time Frame Table: A real-time, multi-time frame table displays RSI and CMO values across various timeframes. This gives traders an overview of momentum across different intervals, making it easier to spot trends and divergences across short and long-term time frames.
➡️Momentum Chart Label: A chart label compares the current RSI and CMO values with values from 1 and 2 bars back, providing an additional metric to gauge momentum. This feature allows traders to easily see if momentum is increasing or decreasing in real-time.
➡️RSI/CMO Bullish and Bearish Signals: Colored arrow plot shapes (above the histogram) indicate when RSI and CMO values are signaling bullish or bearish conditions. For example, green arrows appear when RSI is above 65, while purple arrows show when RSI is below 30 and CMO is below -40, indicating strong bearish momentum.
➡️Divergences in Histogram: The histogram can make it easier for traders to spot divergences between price and momentum. For instance, if the price is making new highs but the RSI or CMO is not, a bearish divergence may be forming. Similarly, bullish divergences can be spotted when prices are making lower lows while RSI or CMO is rising.
➡️Alert System: Alerts are built into the indicator and will trigger when specific conditions are met, allowing traders to stay informed of potential entry or exit points based on RSI and CMO levels without constantly monitoring the chart. These are set manually. Look for the 3 dots in the indicator name.
How Traders Can Use the Indicator:
💥Identifying Momentum Shifts: The RSI+CMO combination is ideal for spotting momentum shifts in the market. Traders can monitor the histogram and the CMO line to determine if the market is gaining or losing strength.
💥Confirming Trade Entries/Exits: Use the real-time RSI and CMO values across multiple time frames to confirm trades. For instance, if the 1-hour RSI is above 70 but the 1-minute RSI is turning down, it could indicate short-term overbought conditions, signaling a potential exit or reversal.
💥Spotting Divergences: Divergences are critical for predicting potential reversals. The histogram can be used to spot divergences when RSI and CMO values deviate from price action, offering an early signal of market exhaustion.
💥Tracking Multi-Time Frame Trends: The multi-time frame table provides insight into the market’s overall trend across several timeframes, helping traders ensure their decisions align with both short and long-term trends.
RSI vs. CMO: Why Use Both?
While both RSI and CMO measure momentum, the CMO often moves faster with a value of 14 for example, reacting to price changes more quickly. This makes it particularly effective for detecting sharp price movements, while RSI helps smooth out price action. By using both, traders get a clearer picture of the market's momentum, particularly during volatile periods.
Confluence and Price Fluidity:
One of the powerful ways to enhance the effectiveness of this indicator is by using it in conjunction with other technical analysis tools to create confluence. Confluence occurs when multiple indicators or price action signals align, providing stronger confirmation for a trade decision. For example:
🎯Support and Resistance Levels: Traders can use RSI+CMO in combination with key support and resistance zones. If the price is nearing a support level and RSI+CMO values start to signal a bullish reversal, this alignment strengthens the case for entering a long position.
🎯Moving Averages: When the RSI+CMO signals a potential trend reversal and this is confirmed by a crossover in moving averages (such as a 50-day and 200-day moving average), traders gain additional confidence in the trade direction.
🎯Momentum Indicators: Traders can also look for momentum indicators like the MACD to confirm the strength of a trend or potential reversal. For instance, if the RSI+CMO values start to decrease rapidly while both the RSI+CMO also shows overbought conditions, this could provide stronger confirmation to exit a long trade or enter a short position.
🎯Candlestick Patterns: Price fluidity can be monitored using candlestick formations. For example, a bearish engulfing pattern with decreasing RSI+CMo values offers confluence, adding confidence to the signal to close or short the trade.
By combining the MTF RSI+CMO PRO with other tools, traders ensure that they are not relying on a single indicator. This layered approach can reduce the likelihood of false signals and improve overall trading accuracy.

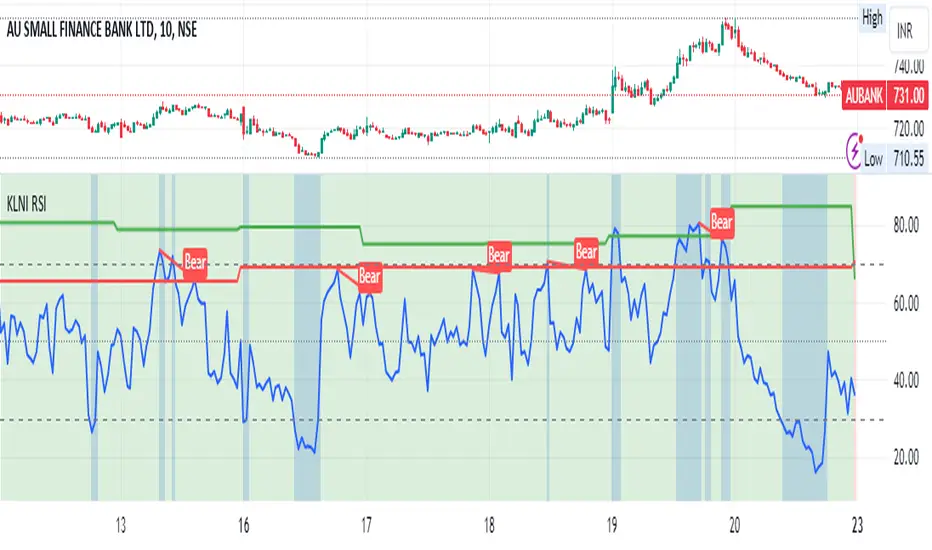
KLNI RSI MTFDescription of the RSI Multi-Timeframe Indicator
The RSI Multi-Timeframe Indicator allows you to track and compare the Relative Strength Index (RSI) across three different timeframes on the same chart. This is particularly useful for traders who want to gauge the momentum of an asset over multiple time periods simultaneously, helping to make more informed trading decisions.
Key Features
Multi-Timeframe RSI:
You can select up to three timeframes to plot RSI on the same chart.
Available timeframe options include:
Current: Displays RSI for the current chart timeframe.
60 minutes (1 hour)
Daily
Weekly
Monthly
Custom RSI Settings:
Adjust the RSI length and source (e.g., close price) through user inputs, allowing you to tailor the indicator to your strategy.
Divergence Detection (Optional):
The indicator can optionally detect and display bullish and bearish divergences between price and RSI for the first selected timeframe.
Bullish divergence is shown when price makes a lower low, but RSI makes a higher low.
Bearish divergence is shown when price makes a higher high, but RSI makes a lower high.
Visual Aids:
Overbought and oversold RSI levels are highlighted with background colors for clarity.
Horizontal lines at 70 (overbought), 50 (neutral), and 30 (oversold) help quickly identify RSI conditions.
How to Use This Indicator
Inputs & Settings
Timeframe Settings:
First Timeframe: Choose the primary timeframe (e.g., 60 minutes, Daily, Weekly).
Second Timeframe: Select the second timeframe to plot on the chart.
Third Timeframe: Select the third timeframe for additional RSI analysis.
RSI Settings:
RSI Length: Set the period for RSI calculation (default: 14).
Source: Select the price data for RSI calculation (default: close price).
Show Divergence: Enable or disable the detection of divergence between price and RSI.
Plotting on Chart
The indicator will display three distinct RSI plots for the selected timeframes:
RSI TF1 (blue line) for the first timeframe.
RSI TF2 (green line) for the second timeframe.
RSI TF3 (red line) for the third timeframe.
Each RSI line corresponds to its chosen timeframe, allowing you to see how RSI behaves across different time periods.
Reading the RSI Values
Overbought: When RSI is above 70, the asset is considered overbought, potentially signaling a sell or short entry.
Oversold: When RSI is below 30, the asset is considered oversold, possibly indicating a buying opportunity.
Neutral: RSI around 50 is neutral and may suggest a lack of clear momentum.
Divergence Detection
If enabled, the indicator will highlight points of divergence:
Bullish Divergence: A green label will appear below the chart where price is making lower lows, but RSI is making higher lows, suggesting potential bullish momentum.
Bearish Divergence: A red label will appear when price is making higher highs, but RSI is making lower highs, indicating potential bearish pressure.
Practical Applications
Momentum Confirmation: Use this indicator to confirm the strength of a trend by comparing RSI across multiple timeframes. For example, if RSI is above 50 on all three timeframes, it may confirm strong upward momentum.
Overbought/Oversold Signals: When RSI is overbought on multiple timeframes, it could signal an impending reversal or correction. Conversely, oversold conditions across timeframes might indicate a buy opportunity.
Divergence Detection: Spot divergence between price and RSI to identify potential trend reversals early. Divergence can provide early signals of changing market momentum.
Summary
This indicator is a powerful tool for multi-timeframe RSI analysis, helping traders understand momentum shifts across different timeframes. It offers customizability, divergence detection, and visual aids to streamline your technical analysis and decision-making process.
Fusion MFI RSIHello fellas,
This superb indicator summons two monsters called Relative Strength Index (RSI) and Money Flow Index (MFI) and plays the Yu-Gi-Oh! card "Polymerization" to combine them.
Overview
The Fusion MFI RSI Indicator is an advanced analytical tool designed to provide a nuanced understanding of market dynamics by combining the Relative Strength Index (RSI) and the Money Flow Index (MFI). Enhanced with sophisticated smoothing techniques and the Inverse Fisher Transform (IFT), this indicator excels in identifying key market conditions such as overbought and oversold states, trends, and potential reversal points.
Key Features (Brief Overview)
Fusion of RSI and MFI: Integrates momentum and volume for a comprehensive market analysis.
Advanced Smoothing Techniques: Employs Hann Window, Jurik Moving Average (JMA), T3 Smoothing, and Super Smoother to refine signals.
Inverse Fisher Transform (IFT) Enhances the clarity and distinctiveness of indicator outputs.
Detailed Feature Analysis
Fusion of RSI and MFI
RSI (Relative Strength Index): Developed by J. Welles Wilder Jr., the RSI measures the speed and magnitude of directional price movements. Wilder recommended using a 14-day period and identified overbought conditions above 70 and oversold conditions below 30.
MFI (Money Flow Index): Created by Gene Quong and Avrum Soudack, the MFI combines price and volume to measure trading pressure. It is typically calculated using a 14-day period, with over 80 considered overbought and under 20 as oversold.
Application in Fusion: By combining RSI and MFI, the indicator leverages RSI's sensitivity to price changes with MFI's volume-weighted confirmation, providing a robust analysis tool. This combination is particularly effective in confirming the strength behind price movements, making the signals more reliable.
Advanced Smoothing Techniques
Hann Window: Traditionally used to reduce the abrupt data discontinuities at the edges of a sample, it is applied here to smooth the price data.
Jurik Moving Average (JMA): Known for preserving the timing and smoothness of the data, JMA reduces market noise effectively without significant lag.
T3 Smoothing: Developed to respond quickly to market changes, T3 provides a smoother response to price fluctuations.
Super Smoother: Filters out high-frequency noise while retaining important trends.
Application in Fusion: These techniques are chosen to refine the output of the combined RSI and MFI values, ensuring the indicator remains responsive yet stable, providing clearer and more actionable signals.
Inverse Fisher Transform (IFT):
Developed by John Ehlers, the IFT transforms oscillator outputs to enhance the clarity of extreme values. This is particularly useful in this fusion indicator to make critical turning points more distinct and actionable.
Mathematical Calculations for the Fusion MFI RSI Indicator
RSI (Relative Strength Index)
The RSI is calculated using the following steps:
Average Gain and Average Loss: First, determine the average gain and average loss over the specified period (typically 14 days). This is done by summing all the gains and losses over the period and then dividing each by the period.
Average Gain = (Sum of Gains over the past 14 periods) / 14
Average Loss = (Sum of Losses over the past 14 periods) / 14
Relative Strength (RS): This is the ratio of average gain to average loss.
RS = Average Gain / Average Loss
RSI: Finally, the RSI is calculated using the RS value:
RSI = 100 - (100 / (1 + RS))
MFI (Money Flow Index)
The MFI is calculated using several steps that incorporate both price and volume:
Typical Price: Calculate the typical price for each period.
Typical Price = (High + Low + Close) / 3
Raw Money Flow: Multiply the typical price by the volume for the period.
Raw Money Flow = Typical Price * Volume
Positive and Negative Money Flow: Compare the typical price of the current period to the previous period to determine if the money flow is positive or negative.
If today's Typical Price > Yesterday's Typical Price, then Positive Money Flow = Raw Money Flow; Negative Money Flow = 0
If today's Typical Price < Yesterday's Typical Price, then Negative Money Flow = Raw Money Flow; Positive Money Flow = 0
Money Flow Ratio: Calculate the ratio of the sum of Positive Money Flows to the sum of Negative Money Flows over the past 14 periods.
Money Flow Ratio = (Sum of Positive Money Flows over 14 periods) / (Sum of Negative Money Flows over 14 periods)
MFI: Finally, calculate the MFI using the Money Flow Ratio.
MFI = 100 - (100 / (1 + Money Flow Ratio))
Fusion of RSI and MFI
The final Fusion MFI RSI value could be calculated by averaging the IFT-transformed values of RSI and MFI, providing a single oscillator value that reflects both momentum and volume-weighted price action:
Fusion MFI RSI = (MFI weight * MFI) + (RSI weight * RSI)
Suggested Settings and Trading Rules
Original Usage
RSI: Wilder suggested buying when the RSI moves above 30 from below (enter long) and selling when the RSI moves below 70 from above (enter short). He recommended exiting long positions when the RSI reaches 70 or higher and exiting short positions when the RSI falls below 30.
MFI: Quong and Soudack recommended buying when the MFI is below 20 and starts rising (enter long), and selling when it is above 80 and starts declining (enter short). They suggested exiting long positions when the MFI reaches 80 or higher and exiting short positions when the MFI falls below 20.
Fusion Application
Settings: Use a 14-day period for this indicator's calculations to maintain consistency with the original settings suggested by the inventors.
Trading Rules:
Enter Long Signal: Consider entering a long position when both RSI and MFI are below their respective oversold levels and begin to rise. This indicates strong buying pressure supported by both price momentum and volume.
Exit Long Signal: Exit the long position when either RSI or MFI reaches its respective overbought threshold, suggesting a potential reversal or decrease in buying pressure.
Enter Short Signal: Consider entering a short position when both indicators are above their respective overbought levels and begin to decline, suggesting that selling pressure is mounting.
Exit Short Signal: Exit the short position when either RSI or MFI falls below its respective oversold threshold, indicating diminishing selling pressure and a potential upward reversal.
How to Use the Indicator
Select Source and Timeframe: Choose the data source and the timeframe for analysis.
Configure Fusion Settings: Adjust the weights for RSI and MFI.
Choose Smoothing Technique: Select and configure the desired smoothing method to suit the market conditions and personal preference.
Enable Fisherization: Optionally apply the Inverse Fisher Transform to enhance signal clarity.
Customize Visualization: Set up gradient coloring, background plots, and bands according to your preferences.
Interpret the Indicator: Use the Fusion value and visual cues to identify market conditions and potential trading opportunities.
Conclusion
The Fusion MFI RSI Indicator integrates classical and modern technical analysis concepts to provide a comprehensive tool for market analysis. By combining RSI and MFI with advanced smoothing techniques and the Inverse Fisher Transform, this indicator offers enhanced insights, aiding traders in making more informed and timely trading decisions. Customize the settings to align with your trading strategy and leverage this powerful tool to navigate financial markets effectively.
Best regards,
simwai
---
Credits to:
@loxx – T3
@everget – JMA
@cheatcountry – Hann Window

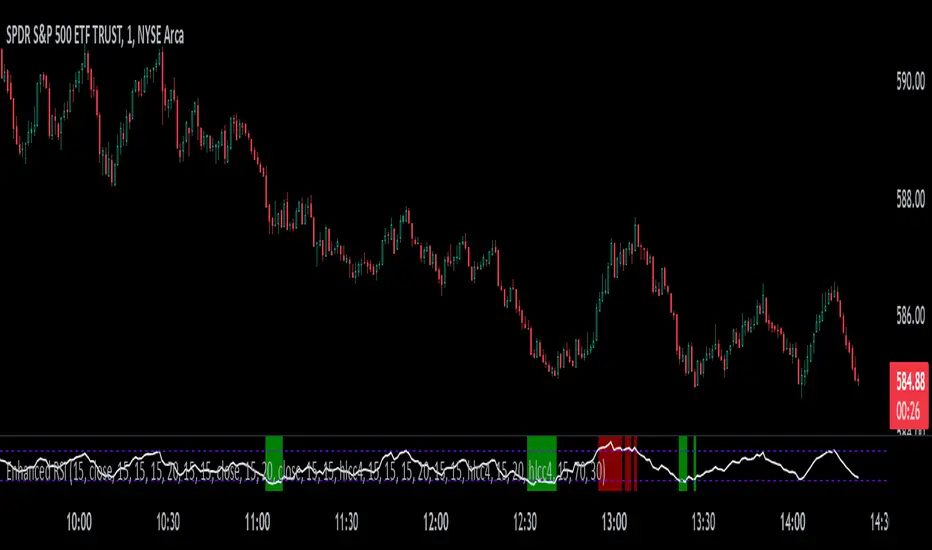
Perfect RSIOverview:
The "Enhanced RSI" is a comprehensive TradingView indicator designed to provide traders with a nuanced and detailed analysis of market conditions using the Relative Strength Index (RSI). It amalgamates various RSI calculation methods to offer a more robust and adaptable approach to technical analysis.
Originality:
This script is unique in its synthesis of multiple RSI calculation techniques, including Regular RSI, Dynamic RSI, DMI RSI, Wilder's RSI, TSI RSI, Momentum RSI, and PPO RSI. By combining these methods, the script creates a distinctive and versatile tool for traders seeking a holistic view of RSI dynamics.
How It Works:
Diverse RSI Calculations:
Regular RSI: Calculates standard RSI with user-defined length and source.
Dynamic RSI: Adjusts RSI dynamically based on price movement direction.
DMI RSI: Uses Directional Movement Index for RSI calculation.
Wilder's RSI: Implements Wilder's smoothing technique for RSI.
TSI RSI: Utilizes True Strength Index for RSI calculation.
Momentum RSI: Calculates RSI based on momentum.
PPO RSI: Applies Percentage Price Oscillator for RSI calculation.
Composite RSI:
Combines the individual RSIs into three composite indices (RSI1, RSI2, RSI) using a weighted average approach.
Dynamic Level Adjustment:
Uses the correlation coefficient to dynamically adjust overbought and oversold levels, enhancing adaptability to market changes.
Visualization and Background Coloring:
Visualizes overbought and oversold zones on the chart.
Adjusts background color based on these conditions for clearer interpretation.
How to Use:
Installation:
Copy and paste the script into the Pine Editor on TradingView.
Adjust parameters as needed.
Analysis:
Utilize the "Enhanced RSI" as a comprehensive analysis tool for RSI dynamics.
Consider it as a confirmation tool alongside other technical indicators.
Customization:
Experiment with different RSI lengths and methods to align with your trading strategy.
Backtest the script to validate its effectiveness.
Considerations:
Complexity:
The script is sophisticated; users are advised to understand each calculation method before reliance.
Parameter Sensitivity:
Effectiveness may vary based on chosen parameters; thorough backtesting and parameter optimization are recommended.
Triple RSI Indicator with ToggleThis script combines three relative strength index (RSI) indicators with different periods, and allows the user to toggle between them to generate overbought and oversold signals. The indicator is named "Triple RSI Indicator with Toggle" and has the short title "TRSI-T."
The input parameters for the RSI periods are set by the user and include a short RSI with a period of 5, a main RSI with a period of 14, and a long RSI with a period of 28. The overbought and oversold levels for each RSI can also be set by the user.
The script plots the three RSI lines on the chart and calculates a bar color based on the enabled RSI values. If all three RSI values are overbought, the bar color is set to fuchsia, if all three RSI values are oversold, the bar color is set to aqua, and if neither of these conditions is met, the bar color is set to not available.
The script also includes a fast RSI and an RSI exponential moving average (EMA) with adjustable periods. The RSI fast line is plotted along with the RSI EMA line, and a cloud fill is generated between the two lines. The fill color is based on whether the fast RSI line is above or below the RSI EMA line, with a blue color used for long signals and a pink color used for short signals.
This indicator can be used as part of a trading strategy in a number of ways. Here are a few examples:
Overbought and Oversold Signals: When the bar color of the indicator is fuchsia, it indicates that all three RSIs are overbought, and when the bar color is aqua, it indicates that all three RSIs are oversold. These signals can be used to enter a trade in the opposite direction, anticipating a reversal in price.
RSI Divergence: Traders can also look for divergences between the price and the RSI values. For example, if the price is making higher highs but the RSI values are making lower highs, it could indicate that the price trend is weakening and a reversal may be imminent. Conversely, if the price is making lower lows but the RSI values are making higher lows, it could indicate that the price trend is about to reverse.
RSI Cloud Signals: The cloud fill generated between the fast RSI and RSI EMA lines can be used to generate trading signals. When the fast RSI line is above the RSI EMA line and the fill color is blue, it can be a signal to go long. When the fast RSI line is below the RSI EMA line and the fill color is pink, it can be a signal to go short.
If anybody has some interesting thoughts on how to improve it, let me know!!
Visual RSI [LucF]Visual RSI offers a different way of looking at RSI by providing a composite representation of 9 different RSI-generated components. Instead of focusing on one line only, this approach blends multiple sources to provide the viewer with a larger context RSI-based picture.
For those who don’t want to read
• Green in bullish (>50) zone is the most bullish.
• Red in bullish zone doesn’t necessarily mean bearish—it just means bullish strength is weakening. It may be just a pause before a reprise or exhaustion signalling a reversal—impossible to tell.
• The same in inverse applies to the bearish zone (<50).
For those who want to understand
The nine components making up Visual RSI are:
• a current timeframe RSI
• a higher timeframe RSI
• the delta between these two RSI lines
• for each of these three basic components, two independent Bollinger band: one calculated for the bullish section of the scale (>50) and a separate one calculated for the lower bearish region.
Dual BBs
In my view, RSI’s position with regards to the centerline is much more important than its position in extreme areas. Why? Because the building block of RSI is the ratio of the averages of up/down moves during the RSI period. When the average of ups is greater, RSI is > 50. So while a rising signal starting from 20 let’s say, indicates that the rate of change is increasing, only when it crosses 50 can we say that sentiment balance has truly become bullish, and this information is more reliable than the signal being at a level corresponding to whatever estimate we make of what constitutes an extreme value. In my landscape, the general balance of a ratio provides more valuable information than the ratio’s exact value.
The idea behind the dual BBs is to provide independent tracking information for both halves of the indicator’s space, which I find more useful than the normal method of simply adding a multiple of the standard deviation on both sides of the mean. With dual BBs, the upper BB will never go lower than the indicator’s centerline, and the lower BB will never go higher. The upper BB focuses on upper-bound volatility when the signal is bearish, and the lower BB focuses on downside volatility when the signal is bearish.
The functions used to calculate the independent BBs are reusable on other signals if a centerline can be defined for them. A clamping percentage is implemented, so that when a BB line is hugging the centerline it clamps to it. This helps in providing earlier signals when they use the BB line states.
Providing context to RSI
What RSI measures indirectly is the balance in the rate of change—or the speed of price movement, but not its instant value, otherwise RSI would be even noisier. More precisely, RSI represents the relative strength of the up/down movement in the last n bars of RSI’s length, with 14 often used because that’s what Wilder proposed (Visual RSI’s defaults are 20 for the current timeframe and 40 for the higher timeframe). At every bar, a new value is added to the equation and an old value carrying equal weight is dropped, so a large dropped off value will have more impact on RSI’s value if the new bar’s move is small. This accounts for some of RSI’s speed in identifying exhaustion after important moves, but almost for some of its noise.
Visual RSI is the result of trying to drown RSI’s noise in the context of other informational streams, while simultaneously providing even faster information than RSI alone, by giving more visual weight to the delta between the current and higher timeframe RSI’s.
How to read Visual RSI
The default settings show all 9 basic components as green/red areas of intensities varying with their importance. The most intense colors are reserved for the delta RSI and the BBs have the lightest intensities. The individual lines of components are intentionally difficult to distinguish so that focus is first on the general picture, including the all-important six-state background, and then on the delta RSI.
One entry setup could be reversals in a larger trend context, so low pivots of the delta in a fully bullish context (a green background in the upper section of the indicator), and inversely, high pivots in a fully bearish context (a red background in the lower section of the indicator).
Please resist the common misconception, when interpreting RSI, that a reversal in the signal will necessarily lead to a reversal in price. Each trend has its rhythm. Only machine-generated price action can progress regularly. It’s normal for trends to take a breather for some time before they continue or reverse, as traders driving the trend experience emotional fatigue and gradual fear. RSI reversals merely signify that such a breather has occurred—nothing more. Only the larger context can provide information that can situate that pause and put more meaningful odds on it having more probability of continuing in one direction or the other. This is the reasoning behind the setup just described.
Features
• All components can be hidden, displayed as a simple line, a uniformly colored fill, or a green/red fill (the default).
• The background can be colored using 9 different methods, including 3 six-state methods using the rising/falling BB lines of the 3 basic components. These six states allow for bullish/bearish/neutral sentiment in both the upper and lower regions of the indicator. A bearish (dark red) background in the bullish (>50) section of the indicator represents decreasing bullishness. A bearish (slightly brighter red) in the bearish (<50) section of the indicator means incresingly bearish sentiment. The six-state backgrounds allow for neutral (no color) sentiment when no compelling signs can be found to conclude anything with meaningful odds. The default background uses the six-state method on the higher timeframe RSI’s BBs because I find it the most useful, as it represents the largest—and slowest—context sentiment among all the indicator’s components.
• A thin status bar in the top part of the indicator also allows selection of the same 9 methods to color it. The default is a triple-state system using the rising/falling characteristics of the current timeframe RSI’s BBs to provide a short-term counterbalance to the long-term background.
• Three different markers can be configured using approximately 70 permutations each, each filtered by 20 different filter permutations. When modification of the relevant parameters in the script’s Settings/Settings/Parameters section is added, possibilities are almost endless. If the generated signals are then fed into the PineCoders Engine and combined with the Engine’s own options, the permutations go up another order of magnitude, and changes to any setting can be instantly evaluated using the Engine’s backtesting results.
• Five simple filters can be combined. They are additive. They include volume-related conditions and a chandelier, which I find useful because both volume and volatility (the chandelier using highs/lows and ATR) are sensible complementary sources to RSI’s momentum information. The filter’s state can be shown as a thin line at the bottom of the indicator.
• Alerts can be configured using any of the marker/filter combinations mentioned. As usual, once your markers/filters are set up the way you want, create your alert from the chart/timeframe you want the alert to run on and be sure to use the “Once Per Bar Close” triggering condition. Use an alert message that will remind you of which combination of markers were used when creating the alert.
• A plot providing entry signals for the PineCoders Backtesting & Trading Engine is supplied. It will use whichever marker/filter configuration is active to generate signals.
• All higher timeframe information is non-repainting. Higher timeframe lines can be smoothed (the default). The selection of the higher timeframe can be made using 3 different methods:
1. By steps (if current timeframe <= 1 minute: 60 min, <= 60 min: 1D, <= 6H: 3D, <= 1D: 1W, <=1W: 1M, >1W: 12M)
2. By a user-defined multiple of the current timeframe
3. Using a fixed timeframe
Thanks to:
• Alex Orekhov aka @everget for the chandelier code.
• @RicardoSantos who through a small remark early on, unknowingly put me on the track of eliminating noise through visual crowding.
• The brilliant guys in the PineCoders Pro room for your knowledge, limitless creativity and constant companionship.

MCL RSI Conflux v2.5 — Multi-Timeframe Momentum & Z-Score Full Description
Overview
The MCL RSI Conflux v2.5 is a multi-timeframe momentum model that integrates daily, weekly, and monthly RSI values into a unified composite. It extends the classical RSI framework with adaptive overbought/oversold thresholds and statistical normalization (Z-score confluence).
This combination allows traders to visualize cross-timeframe alignment, identify synchronized momentum shifts, and detect exhaustion zones with higher statistical confidence.
Methodology
The script extracts RSI data from three major time horizons:
Daily RSI (short-term momentum)
Weekly RSI (intermediate trend)
Monthly RSI (macro bias)
Each RSI is optionally smoothed, weighted, and aggregated into a Composite RSI.
A Z-score transformation then measures how far each RSI deviates from its historical mean, revealing when momentum strength is statistically extreme or aligned across timeframes.
Key Features
Multi-Timeframe RSI Engine – Computes RSI across D/W/M intervals with individual weighting controls.
Adaptive Overbought/Oversold Bands – Automatically adjusts OB/OS thresholds based on rolling volatility (standard deviation of daily RSI).
Composite RSI Score – Weighted consensus RSI that represents total market momentum.
Z-Score Confluence Analysis – Identifies when all three timeframes are statistically synchronized.
Z-Composite Histogram – Displays aggregated Z-score strength around the midline (50).
Divergence Detection – Flags confirmed pivot-based bull and bear divergences on the daily RSI.
Dynamic Gradient Background – Shifts from red to green based on composite momentum regime.
Customizable Control Panel – Displays RSI values, Z-scores, state, and adaptive bands for each timeframe.
Integrated Alerts – For crossovers, risk-on/off thresholds, alignment, and Z-confluence events.
Interpretation
All RSI values above 50: multi-timeframe bullish alignment.
All RSI values below 50: multi-timeframe bearish alignment.
Composite RSI > 60: risk-on environment; momentum expansion.
Composite RSI < 45: risk-off environment; momentum contraction.
Adaptive OB/OS hits: potential exhaustion or mean reversion setup.
Green Z-ribbon: all Z-scores positive and aligned (statistical confirmation).
Red Z-ribbon: all Z-scores negative and aligned (broad market weakness).
Divergences: short-term warning signals against the prevailing momentum bias.
Practical Application
Use the Composite RSI as a global momentum gauge for position bias.
Trade only in the direction of higher-timeframe alignment (avoid countertrend RSI).
Combine Z-ribbon confirmation with Composite RSI crosses to filter noise.
Use divergence labels and adaptive thresholds for risk reduction or exit timing.
Ideal for swing traders and macro momentum models seeking trend synchronization filters.
Recommended Settings
Market Mode k-Band Lookback Use Case
Stocks / ETFs Adaptive 0.85 200 Medium-term rotation filter
Crypto Adaptive 1.00 150 Volatility-responsive swing filter
Commodities Fixed 70/30 100 Mean reversion model
Alerts Included
Daily RSI crossed above/below Weekly RSI
Composite RSI > Risk-On threshold
Composite RSI < Risk-Off threshold
All RSI aligned above/below 50
Z-Score Conformity (All positive or all negative)
Overbought/Oversold triggers
Author’s Note
This indicator was designed for research and systematic confluence analysis within Mongoose Capital Labs.
It is not financial advice and should be used in combination with independent risk assessment, volume confirmation, and higher-timeframe context.

Power RSI Segment Runner [CHE] Power RSI Segment Runner — Tracks RSI momentum across higher timeframe segments to detect directional switches for trend confirmation.
Summary
This indicator calculates a running Relative Strength Index adapted to segments defined by changes in a higher timeframe, such as daily closes, providing a smoothed view of momentum within each period. It distinguishes between completed segments, which fix the final RSI value, and ongoing ones, which update in real time with an exponential moving average filter. Directional switches between bullish and bearish momentum trigger visual alerts, including overlay lines and emojis, while a compact table displays current trend strength as a progress bar. This segmented approach reduces noise from intra-period fluctuations, offering clearer signals for trend persistence compared to standard RSI on lower timeframes.
Motivation: Why this design?
Standard RSI often generates erratic signals in choppy markets due to constant recalculation over fixed lookback periods, leading to false reversals that mislead traders during range-bound or volatile phases. By resetting the RSI accumulation at higher timeframe boundaries, this indicator aligns momentum assessment with broader market cycles, capturing sustained directional bias more reliably. It addresses the gap between short-term noise and long-term trends, helping users filter entries without over-relying on absolute overbought or oversold thresholds.
What’s different vs. standard approaches?
- Baseline Reference: Diverges from the classic Wilder RSI, which uses a fixed-length exponential moving average of gains and losses across all bars.
- Architecture Differences:
- Segments momentum resets at higher timeframe changes, isolating calculations per period instead of continuous history.
- Employs persistent sums for ups and downs within segments, with on-the-fly RSI derivation and EMA smoothing.
- Integrates switch detection logic that clears prior visuals on reversal, preventing clutter from outdated alerts.
- Adds overlay projections like horizontal price lines and dynamic percent change trackers for immediate trade context.
- Practical Effect: Charts show discrete RSI endpoints for past segments alongside a curved running trace, making momentum evolution visually intuitive. Switches appear as clean, extendable overlays, reducing alert fatigue and highlighting only confirmed directional shifts, which aids in avoiding whipsaws during minor pullbacks.
How it works (technical)
The indicator begins by detecting changes in the specified higher timeframe, such as a new daily bar, to define segment boundaries. At each boundary, it finalizes the prior segment's RSI by summing positive and negative price changes over that period and derives the value from the ratio of those sums, then applies an exponential moving average for smoothing. Within the active segment, it accumulates ongoing ups and downs from price changes relative to the source, recalculating the running RSI similarly and smoothing it with the same EMA length.
Points for the running RSI are collected into an array starting from the segment's onset, forming a curved polyline once sufficient bars accumulate. Comparisons between the running RSI and the last completed segment's value determine the current direction as long, short, or neutral, with switches triggering deletions of old visuals and creation of new ones: a label at the RSI pane, a vertical dashed line across the RSI range, an emoji positioned via ATR offset on the price chart, a solid horizontal line at the switch price, a dashed line tracking current close, and a midpoint label for percent change from the switch.
Initialization occurs on the first bar by resetting accumulators, and visualization gates behind a minimum bar count since the segment start to avoid early instability. The trend strength table builds vertically with filled cells proportional to the rounded RSI value, colored by direction. All drawing objects update or extend on subsequent bars to reflect live progress.
Parameter Guide
EMA Length — Controls the smoothing applied to the running RSI; higher values increase lag but reduce noise. Default: 10. Trade-offs: Shorter settings heighten sensitivity for fast markets but risk more false switches; longer ones suit trending conditions for stability.
Source — Selects the price data for change calculations, typically close for standard momentum. Default: close. Trade-offs: Open or high/low may emphasize gaps, altering segment intensity.
Segment Timeframe — Defines the higher timeframe for segment resets, like daily for intraday charts. Default: D. Trade-offs: Shorter frames create more frequent but shorter segments; longer ones align with major cycles but delay resets.
Overbought Level — Sets the upper threshold for potential overbought conditions (currently unused in visuals). Default: 70. Trade-offs: Adjust for asset volatility; higher values delay bearish warnings.
Oversold Level — Sets the lower threshold for potential oversold conditions (currently unused in visuals). Default: 30. Trade-offs: Lower values permit deeper dips before signaling bullish potential.
Show Completed Label — Toggles labels at segment ends displaying final RSI. Default: true. Trade-offs: Enables historical review but can crowd charts on dense timeframes.
Plot Running Segment — Enables the curved polyline for live RSI trace. Default: true. Trade-offs: Visualizes intra-segment flow; disable for cleaner panes.
Running RSI as Label — Displays current running RSI as a forward-projected label on the last bar. Default: false. Trade-offs: Useful for quick reads; may overlap in tight scales.
Show Switch Label — Activates RSI pane labels on directional switches. Default: true. Trade-offs: Provides context; omit to minimize pane clutter.
Show Switch Line (RSI) — Draws vertical dashed lines across the RSI range at switches. Default: true. Trade-offs: Marks reversal bars clearly; extends both ways for reference.
Show Solid Overlay Line — Projects a horizontal line from switch price forward. Default: true. Trade-offs: Acts as dynamic support/resistance; wider lines enhance visibility.
Show Dashed Overlay Line — Tracks a dashed line from switch to current close. Default: true. Trade-offs: Shows price deviation; thinner for subtlety.
Show Percent Change Label — Midpoint label tracking percent move from switch. Default: true. Trade-offs: Quantifies progress; centers dynamically.
Show Trend Strength Table — Displays right-side table with direction header and RSI bar. Default: true. Trade-offs: Instant strength gauge; fixed position avoids overlap.
Activate Visualization After N Bars — Delays signals until this many bars into a segment. Default: 3. Trade-offs: Filters immature readings; higher values miss early momentum.
Segment End Label — Color for completed RSI labels. Default: 7E57C2. Trade-offs: Purple tones for finality.
Running RSI — Color for polyline and running elements. Default: yellow. Trade-offs: Bright for live tracking.
Long — Color for bullish switch visuals. Default: green. Trade-offs: Standard for uptrends.
Short — Color for bearish switch visuals. Default: red. Trade-offs: Standard for downtrends.
Solid Line Width — Thickness of horizontal overlay line. Default: 2. Trade-offs: Bolder for emphasis on key levels.
Dashed Line Width — Thickness of tracking and vertical lines. Default: 1. Trade-offs: Finer to avoid dominance.
Reading & Interpretation
Completed segment RSIs appear as static points or labels in purple, indicating the fixed momentum at period close—values drifting toward the upper half suggest building strength, while lower half implies weakness. The yellow curved polyline traces the live smoothed RSI within the current segment, rising for accumulating gains and falling for losses. Directional labels and lines in green or red flag switches: green for running momentum exceeding the prior segment's, signaling potential uptrend continuation; red for the opposite.
The right table's header colors green for long, red for short, or gray for neutral/wait, with filled purple bars scaling from bottom (low RSI) to top (high), topped by the numeric value. Overlay elements project from switch bars: the solid green/red line as a price anchor, dashed tracker showing pullback extent, and percent label quantifying deviation—positive for alignment with direction, negative for counter-moves. Emojis (up arrow for long, down for short) float above/below price via ATR spacing for quick chart scans.
Practical Workflows & Combinations
- Trend Following: Enter long on green switch confirmation after a higher high in structure; filter with table strength above midpoint for conviction. Pair with volume surge for added weight.
- Exits/Stops: Trail stops to the solid overlay line on pullbacks; exit if percent change reverses beyond 2 percent against direction. Use wait bars to confirm without chasing.
- Multi-Asset/Multi-TF: Defaults suit forex/stocks on 1H-4H with daily segments; for crypto, shorten EMA to 5 for volatility. Scale segment TF to weekly for daily charts across indices.
- Combinations: Overlay on EMA clouds for confluence—switch aligning with cloud break strengthens signal. Add volatility filters like ATR bands to debounce in low-volume regimes.
Behavior, Constraints & Performance
Signals confirm on bar close within segments, with running polyline updating live but gated by minimum bars to prevent flicker. Higher timeframe changes may introduce minor repaints on timeframe switches, mitigated by relying on confirmed HTF closes rather than intrabar peeks. Resource limits cap at 500 labels/lines and 50 polylines, pruning old objects on switches to stay efficient; no explicit loops, but array growth ties to segment length—suitable for up to 500-bar histories without lag.
Known limits include delayed visualization in short segments and insensitivity to overbought/oversold levels, as thresholds are inputted but not actively visualized. Gaps in source data reset accumulators prematurely, potentially skewing early RSI.
Sensible Defaults & Quick Tuning
Start with EMA length 10, daily segments, and 3-bar wait for balanced responsiveness on hourly charts. For excessive switches in ranging markets, increase wait bars to 5 or EMA to 14 to dampen noise. If signals lag in trends, drop EMA to 5 and use 1H segments. For stable assets like indices, widen to weekly segments; tune colors for dark/light themes without altering logic.
What this indicator is—and isn’t
This tool serves as a momentum visualization and switch detector layered over price action, aiding trend identification and confirmation in segmented contexts. It is not a standalone trading system, predictive model, or risk calculator—always integrate with broader analysis, position sizing, and stop-loss discipline. View it as an enhancement for discretionary setups, not automated alerts without validation.
Disclaimer
The content provided, including all code and materials, is strictly for educational and informational purposes only. It is not intended as, and should not be interpreted as, financial advice, a recommendation to buy or sell any financial instrument, or an offer of any financial product or service. All strategies, tools, and examples discussed are provided for illustrative purposes to demonstrate coding techniques and the functionality of Pine Script within a trading context.
Any results from strategies or tools provided are hypothetical, and past performance is not indicative of future results. Trading and investing involve high risk, including the potential loss of principal, and may not be suitable for all individuals. Before making any trading decisions, please consult with a qualified financial professional to understand the risks involved.
By using this script, you acknowledge and agree that any trading decisions are made solely at your discretion and risk.
Do not use this indicator on Heikin-Ashi, Renko, Kagi, Point-and-Figure, or Range charts, as these chart types can produce unrealistic results for signal markers and alerts.
Best regards and happy trading
Chervolino

Regular-Delta RSI Gap Indicator# Regular-Delta RSI Gap Indicator
## Overview
The **Regular-Delta RSI Gap Indicator** is a sophisticated momentum oscillator that compares traditional RSI with volume-based Delta RSI to identify trend strength and potential reversal points. This unique indicator combines price action with volume dynamics to provide enhanced market insights.
## Key Features
### 🔄 Dual RSI Analysis
- **Regular RSI**: Standard RSI based on price changes
- **Delta RSI**: Volume-weighted RSI calculated from volume change rates
- **Visual Comparison**: Clear plotting of both RSIs with ribbon fill
### 💪 Strength Measurement
- **ADX-style Strength Calculation**: Measures the divergence strength between Regular and Delta RSI
- **Configurable Threshold**: Customizable strength level for trend validation
- **Trend Classification**: Identifies strong vs. weak market conditions
### 📊 Multiple Display Options
- **Histogram Visualization**: Columns showing the gap between Regular and Delta RSI
- **Cross Signals**: Triangle markers for crossover events
- **Ribbon Fill**: Color-coded area between the two RSI lines
- **Real-time Table**: Summary table showing current values and trends
## Input Parameters
### Core Settings
- **RSI Period** (default: 14): Calculation period for both RSIs
- **Strength Smoothing** (default: 14): Smoothing period for strength calculation
- **Strength Threshold** (default: 5): Minimum level for strong trend classification
### Visual Customization
- **Show Histogram**: Toggle histogram display
- **Show Signals**: Display crossover signals
- **Show Labels**: Enable trend labels and information table
- **Histogram Height Scale**: Adjust histogram visibility (0.1-3.0)
- **Apply Ribbon Fill**: Enable/disable ribbon coloring
### Color Scheme
- Fully customizable colors for bullish, bearish, neutral, and strength elements
## Interpretation
### Trend Signals
- **Strong Uptrend**: Regular RSI > Delta RSI + Strength above threshold
- **Strong Downtrend**: Regular RSI < Delta RSI + Strength above threshold
- **Weak Trend**: Strength below threshold
### Key Levels
- **Overbought**: 70 level (red line)
- **Oversold**: 30 level (blue line)
- **Midline**: 50 level (gray dotted line)
- **Zero Line**: Histogram baseline
- **Threshold**: Strength reference line
### Signal Types
1. **Crossover Signals**: Regular RSI crossing above/below Delta RSI
2. **Strength Transitions**: Strength line crossing threshold
3. **Histogram Patterns**: Column color and height changes
## Alerts
The indicator provides four alert conditions:
- Divergence Strength Rising
- Divergence Strength Falling
- RSI Crossover (Regular above Delta)
- RSI Crossunder (Regular below Delta)
## Use Cases
- **Trend Confirmation**: Validate price trends with volume confirmation
- **Reversal Detection**: Spot potential trend changes early
- **Momentum Analysis**: Gauge market momentum strength
- **Divergence Trading**: Identify regular/volume RSI divergences
## Optimization Tips
- Adjust period lengths based on trading timeframe
- Modify threshold based on market volatility
- Combine with price action for confirmation
- Use in conjunction with support/resistance levels
This indicator is particularly useful for traders looking to incorporate volume confirmation into their RSI analysis and identify high-probability trend continuations or reversals.

BayesStack RSI [CHE]BayesStack RSI — Stacked RSI with Bayesian outcome stats and gradient visualization
Summary
BayesStack RSI builds a four-length RSI stack and evaluates it with a simple Bayesian success model over a rolling window. It highlights bull and bear stack regimes, colors price with magnitude-based gradients, and reports per-regime counts, wins, and estimated win rate in a compact table. Signals seek to be more robust through explicit ordering tolerance, optional midline gating, and outcome evaluation that waits for events to mature by a fixed horizon. The design focuses on readable structure, conservative confirmation, and actionable context rather than raw oscillator flips.
Motivation: Why this design?
Classical RSI signals flip frequently in volatile phases and drift in calm regimes. Pure threshold rules often misclassify shallow pullbacks and stacked momentum phases. The core idea here is ordered, spaced RSI layers combined with outcome tracking. By requiring a consistent order with a tolerance and optionally gating by the midline, regime identification becomes clearer. A horizon-based maturation check and smoothed win-rate estimate provide pragmatic feedback about how often a given stack has recently worked.
What’s different vs. standard approaches?
Reference baseline: Traditional single-length RSI with overbought and oversold rules or simple crossovers.
Architecture differences:
Four fixed RSI lengths with strict ordering and a spacing tolerance.
Optional requirement that all RSI values stay above or below the midline for bull or bear regimes.
Outcome evaluation after a fixed horizon, then rolling counts and a prior-smoothed win rate.
Dispersion measurement across the four RSIs with a percent-rank diagnostic.
Gradient coloring of candles and wicks driven by stack magnitude.
A last-bar statistics table with counts, wins, win rate, dispersion, and priors.
Practical effect: Charts emphasize sustained momentum alignment instead of single-length crosses. Users see when regimes start, how strong alignment is, and how that regime has recently performed for the chosen horizon.
How it works (technical)
The script computes RSI on four lengths and forms a “stack” when they are strictly ordered with at least the chosen tolerance between adjacent lengths. A bull stack requires a descending set from long to short with positive spacing. A bear stack requires the opposite. Optional gating further requires all RSI values to sit above or below the midline.
For evaluation, each detected stack is checked again after the horizon has fully elapsed. A bull event is a success if price is higher than it was at event time after the horizon has passed. A bear event succeeds if price is lower under the same rule. Rolling sums over the training window track counts and successes; a pair of priors stabilizes the win-rate estimate when sample sizes are small.
Dispersion across the four RSIs is measured and converted to a percent rank over a configurable window. Gradients for bars and wicks are normalized over a lookback, then shaped by gamma controls to emphasize strong regimes. A statistics table is created once and updated on the last bar to minimize overhead. Overlay markers and wick coloring are rendered to the price chart even though the indicator runs in a separate pane.
Parameter Guide
Source — Input series for RSI. Default: close. Tips: Use typical price or hlc3 for smoother behavior.
Overbought / Oversold — Guide levels for context. Defaults: seventy and thirty. Bounds: fifty to one hundred, zero to fifty. Tips: Narrow the band for faster feedback.
Stacking tolerance (epsilon) — Minimum spacing between adjacent RSIs to qualify as a stack. Default: zero point twenty-five RSI points. Trade-off: Higher values reduce false stacks but delay entries.
Horizon H — Bars ahead for outcome evaluation. Default: three. Trade-off: Longer horizons reduce noise but delay success attribution.
Rolling window — Lookback for counts and wins. Default: five hundred. Trade-off: Longer windows stabilize the win rate but adapt more slowly.
Alpha prior / Beta prior — Priors used to stabilize the win-rate estimate. Defaults: one and one. Trade-off: Larger priors reduce variance with sparse samples.
Show RSI 8/13/21/34 — Toggle raw RSI lines. Default: on.
Show consensus RSI — Weighted combination of the four RSIs. Default: on.
Show OB/OS zones — Draw overbought, oversold, and midline. Default: on.
Background regime — Pane background tint during bull or bear stacks. Default: on.
Overlay regime markers — Entry markers on price when a stack forms. Default: on.
Show statistics table — Last-bar table with counts, wins, win rate, dispersion, priors, and window. Default: on.
Bull requires all above fifty / Bear requires all below fifty — Midline gate. Defaults: both on. Trade-off: Stricter regimes, fewer but cleaner signals.
Enable gradient barcolor / wick coloring — Gradient visuals mapped to stack magnitude. Defaults: on. Trade-off: Clearer regime strength vs. extra rendering cost.
Collection period — Normalization window for gradients. Default: one hundred. Trade-off: Shorter values react faster but fluctuate more.
Gamma bars and shapes / Gamma plots — Curve shaping for gradients. Defaults: zero point seven and zero point eight. Trade-off: Higher values compress weak signals and emphasize strong ones.
Gradient and wick transparency — Visual opacity controls. Defaults: zero.
Up/Down colors (dark and neon) — Gradient endpoints. Defaults: green and red pairs.
Fallback neutral candles — Directional coloring when gradients are off. Default: off.
Show last candles — Limit for gradient squares rendering. Default: three hundred thirty-three.
Dispersion percent-rank length / High and Low thresholds — Window and cutoffs for dispersion diagnostics. Defaults: two hundred fifty, eighty, and twenty.
Table X/Y, Dark theme, Text size — Table anchor, theme, and typography. Defaults: right, top, dark, small.
Reading & Interpretation
RSI stack lines: Alignment and spacing convey regime quality. Wider spacing suggests stronger alignment.
Consensus RSI: A single line that summarizes the four lengths; use as a smoother reference.
Zones: Overbought, oversold, and midline provide context rather than standalone triggers.
Background tint: Indicates active bull or bear stack.
Markers: “Bull Stack Enter” or “Bear Stack Enter” appears when the stack first forms.
Gradients: Brighter tones suggest stronger stack magnitude; dull tones suggest weak alignment.
Table: Count and Wins show sample size and successes over the window. P(win) is a prior-stabilized estimate. Dispersion percent rank near the high threshold flags stretched alignment; near the low threshold flags tight clustering.
Practical Workflows & Combinations
Trend following: Enter only on new stack markers aligned with structure such as higher highs and higher lows for bull, or lower lows and lower highs for bear. Use the consensus RSI to avoid chasing into overbought or oversold extremes.
Exits and stops: Consider reducing exposure when dispersion percent rank reaches the high threshold or when the stack loses ordering. Use the table’s P(win) as a context check rather than a direct signal.
Multi-asset and multi-timeframe: Defaults travel well on liquid assets from intraday to daily. Combine with higher-timeframe structure or moving averages for regime confirmation. The script itself does not fetch higher-timeframe data.
Behavior, Constraints & Performance
Repaint and confirmation: Stack markers evaluate on the live bar and can flip until close. Alert behavior follows TradingView settings. Outcome evaluation uses matured events and does not look into the future.
HTF and security: Not used. Repaint paths from higher-timeframe aggregation are avoided by design.
Resources: max bars back is two thousand. The script uses rolling sums, percent rank, gradient rendering, and a last-bar table update. Shapes and colored wicks add draw overhead.
Known limits: Lag can appear after sharp turns. Very small windows can overfit recent noise. P(win) is sensitive to sample size and priors. Dispersion normalization depends on the collection period.
Sensible Defaults & Quick Tuning
Start with the shipped defaults.
Too many flips: Increase stacking tolerance, enable midline gates, or lengthen the collection period.
Too sluggish: Reduce stacking tolerance, shorten the collection period, or relax midline gates.
Sparse samples: Extend the rolling window or increase priors to stabilize P(win).
Visual overload: Disable gradient squares or wick coloring, or raise transparency.
What this indicator is—and isn’t
This is a visualization and context layer for RSI stack regimes with simple outcome statistics. It is not a complete trading system, not predictive, and not a signal generator on its own. Use it with market structure, risk controls, and position management that fit your process.
Metadata
- Pine version: v6
- Overlay: false (price overlays are drawn via forced overlay where applicable)
- Primary outputs: Four RSI lines, consensus line, OB/OS guides, background tint, entry markers, gradient bars and wicks, statistics table
- Inputs with defaults: See Parameter Guide
- Metrics and functions used: RSI, rolling sums, percent rank, dispersion across RSI set, gradient color mapping, table rendering, alerts
- Special techniques: Ordered RSI stacking with tolerance, optional midline gating, horizon-based outcome maturation, prior-stabilized win rate, gradient normalization with gamma shaping
- Performance and constraints: max bars back two thousand, rendering of shapes and table on last bar, no higher-timeframe data, no security calls
- Recommended use-cases: Regime confirmation, momentum alignment, post-entry management with dispersion and recent outcome context
- Compatibility: Works across assets and timeframes that support RSI
- Limitations and risks: Sensitive to parameter choices and market regime changes; not a standalone strategy
- Diagnostics: Statistics table, dispersion percent rank, gradient intensity
Disclaimer
The content provided, including all code and materials, is strictly for educational and informational purposes only. It is not intended as, and should not be interpreted as, financial advice, a recommendation to buy or sell any financial instrument, or an offer of any financial product or service. All strategies, tools, and examples discussed are provided for illustrative purposes to demonstrate coding techniques and the functionality of Pine Script within a trading context.
Any results from strategies or tools provided are hypothetical, and past performance is not indicative of future results. Trading and investing involve high risk, including the potential loss of principal, and may not be suitable for all individuals. Before making any trading decisions, please consult with a qualified financial professional to understand the risks involved.
By using this script, you acknowledge and agree that any trading decisions are made solely at your discretion and risk.
Best regards and happy trading
Chervolino.
Do not use this indicator on Heikin-Ashi, Renko, Kagi, Point-and-Figure, or Range charts, as these chart types can produce unrealistic results for signal markers and alerts.

Adaptive RSI (ARSI)# Adaptive RSI (ARSI) - Dynamic Momentum Oscillator
Adaptive RSI is an advanced momentum oscillator that dynamically adjusts its calculation period based on real-time market volatility and cycle analysis. Unlike traditional RSI that uses fixed periods, ARSI continuously adapts to market conditions, providing more accurate overbought/oversold signals and reducing false signals during varying market phases.
## How It Works
At its core, ARSI calculates an adaptive period ranging from 8 to 28 bars using two key components: volatility measurement through Average True Range (ATR) and cycle detection via price momentum analysis. The logic is straightforward:
- **High volatility periods** trigger shorter calculation periods for enhanced responsiveness to rapid price movements
- **Low volatility periods** extend the calculation window for smoother, more reliable signals
- **Market factor** combines volatility and cycle analysis to determine optimal RSI period in real-time
When RSI crosses above 70, the market enters overbought territory. When it falls below 30, oversold conditions emerge. The indicator also features extreme levels at 80/20 for stronger reversal signals and midline crossovers at 50 for trend confirmation.
The adaptive mechanism ensures the oscillator remains sensitive during critical market movements while filtering out noise during consolidation phases, making it superior to static RSI implementations across different market conditions.
## Features
- **True Adaptive Calculation**: Dynamic period adjustment from 8-28 bars based on market volatility
- **Multiple Signal Types**: Overbought/oversold, extreme reversals, and midline crossovers
- **Configurable Parameters**: RSI length, adaptive sensitivity, ATR period, min/max bounds
- **Smart Smoothing**: Adjustable EMA smoothing from 1-21 periods to reduce noise
- **Visual Clarity**: Gradient colors, area fills, and signal dots for immediate trend recognition
- **Real-time Information**: Live data table showing current RSI, adaptive period, and market factor
- **Flexible Source Input**: Apply to any price source (close, hl2, ohlc4, etc.)
- **Professional Alerts**: Six built-in alert conditions for automated trading systems
## Signal Generation
ARSI generates multiple signal types for comprehensive market analysis:
**Primary Signals**: RSI crosses above 70 (overbought) or below 30 (oversold) - most reliable entry/exit points
**Extreme Signals**: RSI reaches 80+ (extreme overbought) or 20- (extreme oversold) - potential reversal zones
**Trend Signals**: RSI crosses above/below 50 midline - confirms directional momentum
**Reversal Signals**: Price action contradicts extreme RSI levels - early turning point detection
The adaptive period changes provide additional confirmation - signals accompanied by significant period shifts often carry higher probability of success.
## Visual Implementation
The indicator employs sophisticated visual elements for instant market comprehension:
- **Gradient RSI Line**: Color intensity reflects both value and momentum direction
- **Dynamic Zones**: Overbought/oversold areas with customizable fill colors
- **Signal Markers**: Triangular indicators mark key reversal and continuation points
- **Information Panel**: Real-time display of RSI value, adaptive period, market factor, and signal status
- **Background Coloring**: Subtle fills indicate current market state without chart clutter
## Parameter Configuration
**RSI Settings**:
- RSI Length: Base calculation period (default: 14)
- Adaptive Sensitivity: Response aggressiveness to volatility changes (default: 1.0)
- ATR Length: Volatility measurement period (default: 14)
- Min/Max Period: Adaptive calculation boundaries (default: 8/28)
- Smoothing Length: Final noise reduction filter (default: 3)
**Level Settings**:
- Overbought/Oversold: Standard signal levels (default: 70/30)
- Extreme Levels: Enhanced reversal zones (default: 80/20)
- Midline Display: 50-level trend confirmation toggle
**Visual Settings**:
- Line Width: RSI line thickness (1-5)
- Area Fills: Zone highlighting toggle
- Gradient Colors: Dynamic color intensity
- Signal Dots: Entry/exit marker display
## Alerts
ARSI includes six comprehensive alert conditions:
- **ARSI Overbought** - RSI crosses above overbought level
- **ARSI Oversold** - RSI crosses below oversold level
- **ARSI Bullish Cross** - RSI crosses above 50 midline
- **ARSI Bearish Cross** - RSI crosses below 50 midline
- **ARSI Extreme Bull** - Potential bullish reversal from extreme oversold
- **ARSI Extreme Bear** - Potential bearish reversal from extreme overbought
## Use Cases
**Trend Following**: Adaptive periods naturally adjust during trend acceleration and consolidation phases
**Mean Reversion**: Enhanced overbought/oversold signals with volatility-based confirmation
**Breakout Trading**: Extreme level breaches often precede significant directional moves
**Risk Management**: Multiple signal types allow for layered entry/exit strategies
**Multi-Timeframe Analysis**: Works effectively across various timeframes and asset classes
## Trading Applications
**Swing Trading**: Excels during trend transitions with adaptive sensitivity to changing conditions
**Day Trading**: Enhanced responsiveness during volatile sessions while filtering consolidation noise
**Position Trading**: Longer smoothing periods provide stable signals for broader market analysis
**Scalping**: Minimal smoothing with high sensitivity captures short-term momentum shifts
The indicator performs well across stocks, forex, commodities, and cryptocurrencies, though parameter optimization may be required for specific market characteristics.
## Settings Summary
**Display Settings**:
- RSI Length: Moving average baseline period
- Adaptive Sensitivity: Volatility response factor
- ATR Length: Volatility measurement window
- Min/Max Period: Adaptive calculation boundaries
- Smoothing Length: Noise reduction filter
**Level Configuration**:
- Overbought/Oversold: Primary signal thresholds
- Extreme Levels: Secondary reversal zones
- Midline Display: Trend confirmation toggle
**Visual Options**:
- Line Width: RSI line appearance
- Area Fills: Zone highlighting
- Gradient Colors: Dynamic visual feedback
- Signal Dots: Entry/exit markers
## Disclaimer
This indicator is provided for educational and informational purposes only. It is not financial advice. Trading involves substantial risk of loss and is not suitable for all investors. Past performance is not indicative of future results. Always conduct thorough testing and risk assessment before live implementation. The adaptive nature of this indicator requires understanding of its behavior across different market conditions for optimal results.

Adaptive Volume-Weighted RSI (AVW-RSI)Concept Summary
The AVW-RSI is a modified version of the Relative Strength Index (RSI), where each price change is weighted by the relative trading volume for that period. This means periods of high volume (typically driven by institutions or “big money”) have a greater influence on the RSI calculation than periods of low volume.
Why AVW-RSI Helps Traders
Avoids Weak Signals During Low Volume
Standard RSI may show overbought/oversold zones even during low-volume periods (e.g., during lunch hours or after news).
AVW-RSI gives less weight to these periods, avoiding misleading signals.
Amplifies Strong Momentum Moves
If RSI is rising during high volume, it's more likely driven by institutional buying—AVW-RSI reflects that stronger by weighting the RSI component.
Filters Out Retail Noise
By prioritizing high-volume candles, it naturally discounts fakeouts caused by thin markets or retail-heavy moves.
Highlights Institutional Entry/Exit
Useful for spotting hidden accumulation/distribution that classic RSI would miss.
How It Works (Calculation Logic)
Traditional RSI Formula Recap
RSI = 100 - (100 / (1 + RS))
RS = Average Gain / Average Loss (over N periods)
Modified Step – Apply Volume Weight
For each period
Gain_t = max(Close_t - Close_{t-1}, 0)
Loss_t = max(Close_{t-1} - Close_t, 0)
Weight_t = Volume_t / AvgVolume(N)
WeightedGain_t = Gain_t * Weight_t
WeightedLoss_t = Loss_t * Weight_t
Weighted RSI
AvgWeightedGain = SMA(WeightedGain, N)
AvgWeightedLoss = SMA(WeightedLoss, N)
RS = AvgWeightedGain / AvgWeightedLoss
AVW-RSI = 100 - (100 / (1 + RS))
Visual Features on Chart
Line Color Gradient
Color gets darker as volume weight increases, signaling stronger conviction.
Overbought/Oversold Zones
Traditional: 70/30
Suggested AVW-RSI zones: Use dynamic thresholds based on historical volatility (e.g., 80/20 for high-volume coins).
Volume Spike Flags
Mark RSI turning points that occurred during volume spikes with a special dot/symbol.
Trading Strategies with AVW-RSI
1. Weighted RSI Divergence
Regular RSI divergence becomes more powerful when volume is high.
AVW-RSI divergence with volume spike is a strong signal of reversal.
2. Trend Confirmation
RSI crossing above 50 during rising volume is a good entry signal.
RSI crossing below 50 with high volume is a strong exit or short trigger.
3. Breakout Validation
Price breaking resistance + AVW-RSI > 60 with volume = Confirmed breakout.
Price breaking but AVW-RSI < 50 or on low volume = Potential fakeout.
Example Use Case
Stock XYZ is approaching a resistance zone. A trader sees:
Standard RSI: 65 → suggests strength.
Volume is 3x the average.
AVW-RSI: 78 → signals strong momentum with institutional backing.
The trader enters confidently, knowing this isn't just low-volume hype.
Limitations / Tips
Works best on liquid assets (Forex majors, large-cap stocks, BTC/ETH).
Should be used alongside price action and volume analysis—not standalone.
Periods of extremely high volume (news events) might need smoothing to avoid spikes.

Fibonacci - RSI OscillatorIndicator Overview
The Fibonacci RSI Oscillator calculates the Relative Strength Index (RSI) based on a dynamically adjusting level derived from recent price action and a fixed Fibonacci ratio (0.236). This differs from standard RSI, which is calculated directly on the closing price. The objective is to measure momentum relative to a level that adapts to recent peaks and valleys.
Core Calculation Mechanism
Peak/Valley Tracking: The script identifies the highest high (state_peak) and lowest low (state_valley) since the last detected change in short-term directional bias (state_dir).
Dynamic Level Calculation: A level (state_dyn_level) is calculated using a fixed 0.236 Fibonacci ratio relative to the tracked peak and valley:
If bias is up: state_dyn_level = state_peak - (state_peak - state_valley) * 0.236
If bias is down: state_dyn_level = state_valley + (state_peak - state_valley) * 0.236
This level adjusts automatically when a new peak or valley is established in the current directional bias. If price crosses the dynamic level against the current bias, the bias flips, and the level recalculates.
Optional Source Smoothing: The calculated state_dyn_level can optionally be smoothed using a user-selected moving average (SMA, EMA, WMA, HMA, RMA) before the RSI calculation.
RSI Calculation: The standard RSI formula is applied to the (optionally smoothed) state_dyn_level series to produce the primary oscillator value (val_primary_osc).
Signal Line: A moving average (type and length configurable) is calculated on the val_primary_osc to generate the val_sig_line.
Key Features & Components
Dynamic Fibonacci Level: The core input for the RSI calculation, based on recent peaks/valleys and the 0.236 ratio.
Fibonacci Level RSI: The primary oscillator line representing the RSI of the dynamic level.
Signal Line: A moving average of the primary RSI line.
Overbought/Oversold Levels: User-defined threshold lines.
Optional Source Smoothing: Configurable MA smoothing applied to the dynamic level before RSI calculation.
Gradient RSI Color : Option to color the primary RSI line based on its value relative to OB/Mid/OS levels.
Zone & OB/OS Fills: Visual fills for the 0-50 / 50-100 zones and specific fills when the RSI enters OB/OS territory.
Background Gradient: Optional vertical background color gradient based on the RSI's position between 0 and 100.
Configurable Parameters: Inputs for lengths, MA types, OB/OS levels, colors, line widths, and feature toggles.
Visual Elements Explained
Fibonacci Level RSI Line: The main plotted oscillator (color/gradient/width configurable).
Signal Line: The moving average of the RSI line (color/width/MA type configurable).
OB/OS Lines: Horizontal lines plotted at the set OB/OS levels (color/width configurable).
Mid-Line (50): Horizontal line plotted at 50 (color/width configurable).
Zone Fills:
Background fill between 0-50 and 50-100 (colors configurable).
Conditional fill between the RSI line and the 50 line when RSI > OB level or RSI < OS level (colors configurable).
Background Gradient: Optional background coloring where transparency varies vertically with the RSI level (base colors and transparency range configurable).
Configuration Options
Users can adjust the following parameters in the indicator settings:
Smoothing: Enable/disable dynamic level smoothing; set length and MA type.
RSI: Set the RSI calculation length.
Signal Line: Set the signal line smoothing length and MA type.
Levels: Define Overbought and Oversold numeric thresholds.
Visuals: Configure colors and widths for the RSI line, signal line, OB/OS lines, mid-line, zone fills, and OB/OS fills.
Gradients: Enable/disable and configure colors for the RSI line gradient; enable/disable and configure colors/transparency for the background gradient.
Interpretation Notes
The oscillator reflects the momentum of the dynamic Fibonacci level, not directly the price. Divergences, OB/OS readings, and signal line crossovers should be interpreted in this context.
The behavior may differ from standard RSI, potentially offering a smoother output or highlighting different momentum patterns depending on market structure and volatility.
As with any indicator, signals should be used in conjunction with other analysis methods and risk management practices. It is not designed as a standalone trading system.
Risk Disclaimer:
Trading involves significant risk. This indicator is provided for analytical purposes only and does not constitute financial advice. Past performance is not indicative of future results. Use sound risk management practices and never trade with capital you cannot afford to lose.

Machine Learning RSI ║ BullVisionOverview:
Introducing the Machine Learning RSI with KNN Adaptation – a cutting-edge momentum indicator that blends the classic Relative Strength Index (RSI) with machine learning principles. By leveraging K-Nearest Neighbors (KNN), this indicator aims at identifying historical patterns that resemble current market behavior and uses this context to refine RSI readings with enhanced sensitivity and responsiveness.
Unlike traditional RSI models, which treat every market environment the same, this version adapts in real-time based on how similar past conditions evolved, offering an analytical edge without relying on predictive assumptions.
Key Features:
🔁 KNN-Based RSI Refinement
This indicator uses a machine learning algorithm (K-Nearest Neighbors) to compare current RSI and price action characteristics to similar historical conditions. The resulting RSI is weighted accordingly, producing a dynamically adjusted value that reflects historical context.
📈 Multi-Feature Similarity Analysis
Pattern similarity is calculated using up to five customizable features:
RSI level
RSI momentum
Volatility
Linear regression slope
Price momentum
Users can adjust how many features are used to tailor the behavior of the KNN logic.
🧠 Machine Learning Weight Control
The influence of the machine learning model on the final RSI output can be fine-tuned using a simple slider. This lets you blend traditional RSI and machine learning-enhanced RSI to suit your preferred level of adaptation.
🎛️ Adaptive Filtering
Additional smoothing options (Kalman Filter, ALMA, Double EMA) can be applied to the RSI, offering better visual clarity and helping to reduce noise in high-frequency environments.
🎨 Visual & Accessibility Settings
Custom color palettes, including support for color vision deficiencies, ensure that trend coloring remains readable for all users. A built-in neon mode adds high-contrast visuals to improve RSI visibility across dark or light themes.
How It Works:
Similarity Matching with KNN:
At each candle, the current RSI and optional market characteristics are compared to historical bars using a KNN search. The algorithm selects the closest matches and averages their RSI values, weighted by similarity. The more similar the pattern, the greater its influence.
Feature-Based Weighting:
Similarity is determined using normalized values of the selected features, which gives a more refined result than RSI alone. You can choose to use only 1 (RSI) or up to all 5 features for deeper analysis.
Filtering & Blending:
After the machine learning-enhanced RSI is calculated, it can be optionally smoothed using advanced filters to suppress short-term noise or sharp spikes. This makes it easier to evaluate RSI signals in different volatility regimes.
Parameters Explained:
📊 RSI Settings:
Set the base RSI length and select your preferred smoothing method from 10+ moving average types (e.g., EMA, ALMA, TEMA).
🧠 Machine Learning Controls:
Enable or disable the KNN engine
Select how many nearest neighbors to compare (K)
Choose the number of features used in similarity detection
Control how much the machine learning engine affects the RSI calculation
🔍 Filtering Options:
Enable one of several advanced smoothing techniques (Kalman Filter, ALMA, Double EMA) to adjust the indicator’s reactivity and stability.
📏 Threshold Levels:
Define static overbought/oversold boundaries or reference dynamically adjusted thresholds based on historical context identified by the KNN algorithm.
🎨 Visual Enhancements:
Select between trend-following or impulse coloring styles. Customize color palettes to accommodate different types of color blindness. Enable neon-style effects for visual clarity.
Use Cases:
Swing & Trend Traders
Can use the indicator to explore how current RSI readings compare to similar market phases, helping to assess trend strength or potential turning points.
Intraday Traders
Benefit from adjustable filters and fast-reacting smoothing to reduce noise in shorter timeframes while retaining contextual relevance.
Discretionary Analysts
Use the adaptive OB/OS thresholds and visual cues to supplement broader confluence zones or market structure analysis.
Customization Tips:
Higher Volatility Periods: Use more neighbors and enable filtering to reduce noise.
Lower Volatility Markets: Use fewer features and disable filtering for quicker RSI adaptation.
Deeper Contextual Analysis: Increase KNN lookback and raise the feature count to refine pattern recognition.
Accessibility Needs: Switch to Deuteranopia or Monochrome mode for clearer visuals in specific color vision conditions.
Final Thoughts:
The Machine Learning RSI combines familiar momentum logic with statistical context derived from historical similarity analysis. It does not attempt to predict price action but rather contextualizes RSI behavior with added nuance. This makes it a valuable tool for those looking to elevate traditional RSI workflows with adaptive, research-driven enhancements.

PumpC RSI NTZ BarsPumpC RSI NTZ Bars — Slope-Aware RSI Momentum Overlay
The PumpC RSI NTZ Bars indicator builds on the classic RSI by combining it with slope detection and custom bar highlighting, helping traders quickly identify strong momentum breakouts while avoiding sideways chop — the (NTZ) or No Trade Zone .
What is (NTZ)?
(NTZ) stands for No Trade Zone — the neutral RSI area between bullish and bearish thresholds. In this zone, RSI lacks directional strength, which often reflects indecision or consolidation in price. This indicator helps visually separate the chop from true momentum, so you can trade the breakout, not the noise .
Core Features
Dynamic RSI-Based Bar Coloring with Slope Awareness
Bars change color based on RSI value and its slope:
Bright Green: RSI ≥ Bullish Threshold and sloping upward
Teal Green: RSI ≥ Bullish Threshold but sloping downward
Bright Red: RSI ≤ Bearish Threshold and sloping downward
Orange: RSI ≤ Bearish Threshold but sloping upward
White: RSI is between thresholds (NTZ)
Slope Detection Logic
RSI slope is used to confirm directional bias and filter out weak or fading momentum.
Clean Visual Integration
Choose how signals appear: full bar color, border-only style, background shading, or a mix of all three.
RSI Smoothing Option
Optional smoothing to reduce noise — especially useful on faster timeframes.
Built-In Alerts
RSI crossing above the bullish threshold with an upward slope
RSI crossing below the bearish threshold with a downward slope
User Inputs & Customization Options
RSI Length: Default 14
RSI Source: Default Close
Smooth RSI: On or Off
Smoothing Length: Default 2
Bullish Threshold: Default 60
Bearish Threshold: Default 40
Bar Highlight Style: Full Bar or Border Only
Display Mode: Bar Color, Background, or Both
How to Use It
Step 1 – Adjust Your RSI Settings:
Start by setting the RSI Length (default is 14) and choosing which price source to use — typically close , but you can experiment with hl2 , ohlc4 , etc.
You can also turn on smoothing if you want to reduce noise, especially on fast timeframes like the 1m or 5m chart.
Step 2 – Define Your No Trade Zone (NTZ):
The NTZ is the space between the bullish and bearish thresholds (default 60 and 40).
This is where momentum is weak and price is often ranging or chopping. You don’t want to trade in this zone — you're waiting for RSI to break out of it with conviction.
Step 3 – Choose Your Visual Style:
You can choose to: Highlight the entire candle (Full Bar)
Just highlight the outline (Border Only)
Add a background color behind the chart
Or use a combination of the above This makes the signal easy to see without changing your whole chart look.
Step 4 – Read the Colors for Quick Clarity:
Bright Green / Bright Red = Strong Momentum (with RSI slope confirmation)
Teal / Orange = Momentum is weakening — RSI value is above/below threshold but losing slope strength
White = RSI is in the No Trade Zone (NTZ) — not enough strength to trade
Use this color feedback to stay out during weak periods and act when the trend gains strength.
Step 5 – Use Alerts for Clean Signals:
Set alerts when RSI breaks out of the NTZ with slope confirmation .
These are high-quality signals you can use to trigger your setups or review potential entries.
Disclaimer
This indicator is for educational and informational purposes only and should not be considered financial advice. Always combine tools like this with proper market context and risk management.
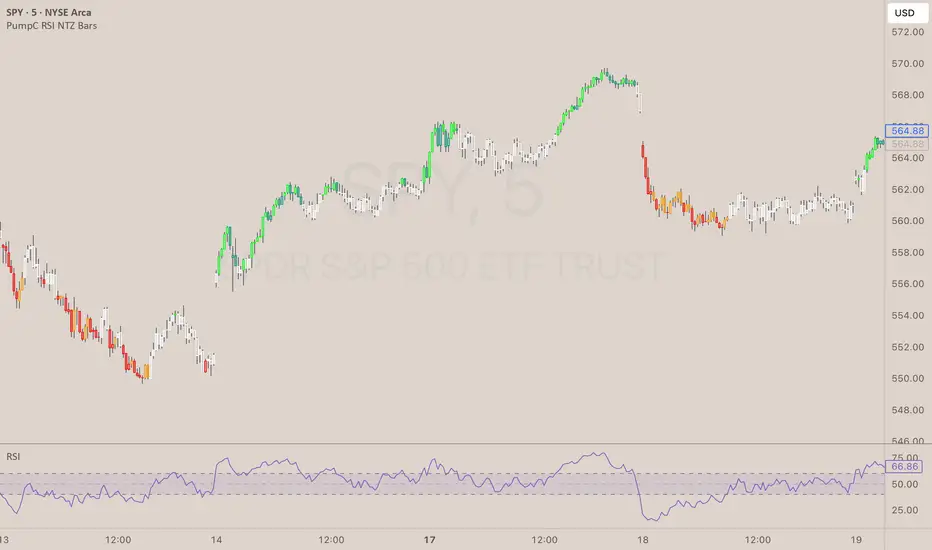
Normalized MACD with RSI & Stoch RSI + SignalsNormalized MACD with RSI & Stoch RSI Indicator
Overview:
This indicator combines three popular momentum indicators (MACD, RSI, and Stochastic RSI) into a single cohesive, normalized view, making it easier for traders to interpret market momentum and potential buy/sell signals. It specifically addresses an important issue—the different scale ranges of indicators—by normalizing MACD values to match the 0–100 scale of RSI and Stochastic RSI.
Here’s a clear and concise description of your updated Pine Script indicator:
⸻
Normalized MACD with RSI & Stoch RSI Indicator
Overview:
This indicator combines three popular momentum indicators (MACD, RSI, and Stochastic RSI) into a single cohesive, normalized view, making it easier for traders to interpret market momentum and potential buy/sell signals. It specifically addresses an important issue—the different scale ranges of indicators—by normalizing MACD values to match the 0–100 scale of RSI and Stochastic RSI.
⸻
Key Components:
① MACD (Normalized):
• The Moving Average Convergence Divergence (MACD) originally has an unlimited numerical range.
• Normalization Method:
• Uses a custom tanh(x) function implemented directly in Pine Script:
\tanh(x) = \frac{e^{x}-e^{-x}}{e^{x}+e^{-x}}
• MACD values are scaled using this method to a range of 0–100, with the neutral line at exactly 50.
• Interpretation:
• Values above 50 indicate bullish momentum.
• Values below 50 indicate bearish momentum.
② RSI (Relative Strength Index):
• Measures market momentum on a 0–100 scale.
• Traditional RSI interpretation:
• Overbought conditions: RSI > 70–80.
• Oversold conditions: RSI < 30–20.
③ Stochastic RSI:
• Combines RSI and Stochastic Oscillator to give short-term, highly sensitive signals.
• Helps identify immediate market extremes:
• Above 80 → Short-term overbought.
• Below 20 → Short-term oversold.
⸻
How the Indicator Works:
• Visualization:
• All three indicators (Normalized MACD, RSI, Stochastic RSI) share the same 0–100 scale.
• Clear visual lines and reference levels:
• Midline at 50 indicates neutral momentum.
• Dashed lines at 20 and 80 clearly mark oversold/overbought zones.
• Trading Signals (Recommended approach):
• Bullish Signal (Potential Buy):
• Normalized MACD crosses above 50.
• RSI below or approaching oversold zone (below 30–20).
• Stochastic RSI below 20, indicating short-term oversold conditions.
• Bearish Signal (Potential Sell):
• Normalized MACD crosses below 50.
• RSI above or approaching overbought zone (above 70–80).
• Stochastic RSI above 80, indicating short-term overbought conditions.
⸻
Why Use This Indicator?
• Harmonized Signals:
Normalization of MACD significantly improves clarity and comparability with RSI and Stochastic RSI, providing a unified momentum picture.
• Intuitive Analysis:
Traders can rapidly and intuitively identify momentum shifts without needing multiple indicator windows.
• Improved Decision-Making:
Clear visual references and signals help reduce subjective interpretation, potentially improving trading outcomes.
⸻
Suggested Usage:
• Combine with traditional support

Adaptive RSI with Real-Time Divergence [AIBitcoinTrend]👽 Adaptive RSI Trailing Stop (AIBitcoinTrend)
The Adaptive RSI Trailing Stop is an indicator that integrates Gaussian-weighted RSI calculations with real-time divergence detection and a dynamic ATR-based trailing stop. This advanced approach allows traders to monitor momentum shifts, identify divergences early, and manage risk with adaptive trailing stop levels that adjust to price action.
👽 What Makes the Adaptive RSI with Signals and Trailing Stop Unique?
Unlike traditional RSI indicators, this version applies a Gaussian-weighted smoothing algorithm, making it more responsive to price action while reducing noise. Additionally, the trailing stop feature dynamically adjusts based on volatility and trend conditions, allowing traders to:
Detects real-time divergences (bullish/bearish) with a smart pivot-based system.
Filter noise with Gaussian weighting, ensuring smoother RSI transitions.
Utilize crossover-based trailing stop activation, for systematic trade management.
👽 The Math Behind the Indicator
👾 Gaussian Weighted RSI Calculation
Traditional RSI calculations rely on simple averages of gains and losses. Instead, this indicator weights recent price changes using a Gaussian distribution, prioritizing more relevant data points while maintaining smooth transitions.
Key Features:
Exponential decay ensures recent price changes are weighted more heavily.
Reduces short-term noise while maintaining responsiveness.
👾 Real-Time Divergence Detection
The indicator detects bullish and bearish divergences using pivot points on RSI compared to price action.
👾 Dynamic ATR-Based Trailing Stop
Bullish Trailing Stop: Activates when RSI crosses above 20 and dynamically adjusts based on low - ATR multiplier.
Bearish Trailing Stop: Activates when RSI crosses below 80 and adjusts based on high + ATR multiplier
This allows traders to:
Lock in profits systematically by adjusting stop-losses dynamically.
Stay in trades longer while maintaining adaptive risk management.
👽 How It Adapts to Market Movements
✔️ Gaussian Filtering ensures smooth RSI transitions while preventing excessive lag.
✔️ Real-Time Divergence Alerts provide early trade signals based on price-RSI discrepancies.
✔️ ATR Trailing Stop dynamically expands or contracts based on market volatility.
✔️ Crossover-Based Activation enables the stop-loss system only when RSI confirms a momentum shift.
👽 How Traders Can Use This Indicator
👾 Divergence Trading
Traders can use real-time divergence detection to anticipate reversals before they happen.
Bullish Divergence Setup:
Look for RSI making a higher low, while price makes a lower low.
Enter long when RSI confirms upward momentum.
Bearish Divergence Setup:
Look for RSI making a lower high, while price makes a higher high.
Enter short when RSI confirms downward momentum.
👾 Trailing Stop Signals
Bullish Signal and Trailing Stop Activation:
When RSI crosses above 20, a trailing stop is placed using low - ATR multiplier.
If price crosses below the stop, it exits the trade and removes the stop.
Bearish Signal and Trailing Stop Activation:
When RSI crosses below 80, a trailing stop is placed using high + ATR multiplier.
If price crosses above the stop, it exits the trade and removes the stop.
This makes trend-following strategies more efficient, while ensuring proper risk management.
👽 Why It’s Useful for Traders
✔️ Dynamic and Adaptive: Adjusts to changing market conditions automatically.
✔️ Noise Reduction: Gaussian-weighted RSI reduces short-term price distortions.
✔️ Comprehensive Strategy Tool: Combines momentum detection, divergence analysis, and automated risk management into a single indicator.
✔️ Works Across Markets & Timeframes: Suitable for stocks, forex, crypto, and futures trading.
👽 Indicator Settings
RSI Length: Defines the lookback period for RSI smoothing.
Gaussian Sigma: Controls how much weight is given to recent data points.
Enable Signal Line: Option to display an RSI-based moving average.
Divergence Lookback: Configures how far back pivot points are detected.
Crossover/crossunder values for signals: Set the crossover/crossunder values that triggers signals.
ATR Multiplier: Adjusts trailing stop sensitivity to market volatility.
Disclaimer: This indicator is designed for educational purposes and does not constitute financial advice. Please consult a qualified financial advisor before making investment decisions.

Bollinger Bands + RSI [Uncle Sam Trading]The Bollinger Bands + RSI indicator combines two popular technical analysis tools, Bollinger Bands (BB) and the Relative Strength Index (RSI), into a unified framework designed to assess both market volatility and momentum. This indicator provides both visual signals on the chart, and allows you to set alerts. It is intended to help traders identify potential overbought/oversold conditions, trend reversals, and to refine trade entry and exit points.
Key Features:
Bollinger Bands: The indicator plots Bollinger Bands, which consist of a basis line (typically a 20-period Simple Moving Average), an upper band (basis + 2 standard deviations), and a lower band (basis - 2 standard deviations). The bands dynamically adjust to market volatility, widening during periods of increased volatility and contracting during periods of decreased volatility.
Relative Strength Index (RSI): The RSI, a momentum oscillator, is plotted in a separate pane below the price chart. It measures the magnitude of recent price changes to evaluate overbought or oversold conditions in the price of a stock or other asset. Traditional interpretation uses 70 and 30 as overbought and oversold levels, respectively.
Overbought/Oversold Zones Highlighting: This indicator uniquely highlights overbought and oversold zones directly on the price chart based on the RSI values. When the RSI is above the overbought level (default 70), a red-shaded area is displayed. When the RSI is below the oversold level (default 30), a green-shaded area is displayed. These visual cues enhance the identification of potential trend reversals.
Buy and Sell Signals: The indicator generates buy signals when the price crosses above the lower Bollinger Band and the RSI is below the oversold level (if the RSI filter is enabled). Sell signals are generated when the price crosses below the upper Bollinger Band and the RSI is above the overbought level (if the RSI filter is enabled). These signals are plotted as green upward-pointing triangles (buy) and red downward-pointing triangles (sell) on the chart.
Customizable Parameters: Users can adjust various settings, including:
Bollinger Bands Length: The number of periods used to calculate the moving average and standard deviation.
Bollinger Bands Standard Deviation: The multiplier used to determine the distance of the upper and lower bands from the basis.
RSI Length: The number of periods used to calculate the RSI.
RSI Overbought/Oversold Levels: The threshold values that define overbought and oversold conditions for the RSI.
Use RSI Filter for Signals: Enable/disable the RSI filter for buy and sell signals.
Colors: The colors of the Bollinger Bands, RSI, overbought/oversold levels, and zone highlights can be customized to suit user preferences.
Alerts: The indicator supports customizable alerts for various conditions, including:
Buy Signal: Triggered when a buy signal is generated.
Sell Signal: Triggered when a sell signal is generated.
Price Crossed Upper BB: Triggered when the price crosses above the upper Bollinger Band.
Price Crossed Lower BB: Triggered when the price crosses below the lower Bollinger Band.
RSI Overbought: Triggered when the RSI crosses above the overbought level.
RSI Oversold: Triggered when the RSI crosses below the oversold level.
How to Use:
The Bollinger Bands + RSI indicator can be used in various ways, including:
Identifying Potential Trend Reversals: Price crosses above the lower band coupled with an oversold RSI (and highlighted zone) may signal a bullish reversal. Conversely, a price cross below the upper band with an overbought RSI (and highlighted zone) may indicate a bearish reversal.
Confirming Trend Strength: In an uptrend, the price may "ride" the upper band, while in a downtrend, it may "ride" the lower band.
Exit Signals: Crossing the opposite band while in a trade, particularly with confirming RSI signals, is often used to identify potential exit points.
Combined with Other Analysis: This indicator works well in conjunction with other technical analysis tools, such as trend lines, support/resistance levels, chart patterns, and moving average-based strategies.
Disclaimer:
This indicator is for educational and informational purposes only and should not be considered as financial advice. Trading involves risk, and past performance is not indicative of future results. Always conduct thorough research and consider your risk tolerance before making any trading decisions.

Waldo RSI Overlay :oWaldo RSI Overlay :o Indicator Guide
Welcome to the guide for the Waldo RSI Overlay :o indicator on TradingView. This tool enhances your trading analysis through RSI-based overlays for trend analysis, divergence detection, and breakout/breakdown signals when used with its companion indicator, Waldo RSI :o.
Key Features:
RSI Overlay:
• RSI Source: Choose from:
o ON RSI: Uses the RSI values directly to detect pivots, focusing on RSI highs and lows for trend analysis.
o ON HIGH, ON CLOSE, ON LOW, ON OPEN:
These options base pivot detection on price action at those specific points, offering an alternative market structure view.
• RSI Settings:
o Source: Default is (H+L)/2, but you can select any price for RSI calculation.
o Length: Default RSI length is 7, which you can adjust for sensitivity.
Trend Lines:
• Show Trend Lines: Toggle to display trend lines based on pivot points.
• Zigzag Length: Sets the sensitivity of pivot point detection.
• Confirm Length: Ensures the validity of pivot points (default is 3).
• Colors: Customize colors for Higher Highs (HH), Lower Highs (LH), Higher Lows (HL), and Lower Lows (LL).
• Transparency and Line Width: Control how trend lines and fills appear.
• Label Size: Adjust the size of labels identifying pivot points.
Divergences:
• Classic Divergences:
o Show Classic Div: Enable to highlight regular divergences where price and RSI move in opposite directions.
o Colors: Define colors for bullish and bearish divergence lines and labels.
o Transparency and Line Width: Adjust the visual impact of divergence signals.
• Hidden Divergences:
o Similar settings as classic, but these highlight divergences indicating trend continuation.
Breakout/Breakdown:
• Show Breakout/Breakdown: When activated, this feature signals when the price breaks through previous highs or lows. To activate these breakouts, you need the companion indicator Waldo RSI :o, select the SRC in the External section, and select the crossovers for each one.
This combination provides RSI confirmation for breakout/breakdown events.
Overbought/Oversold Zones:
• Show Overbought and Oversold Zones: Bars are colored when RSI exceeds 70 (purple) or falls below 30 (blue), indicating potential market extremes.
Moving Averages (Optional):
• Show Moving Averages: Option to overlay two moving averages for trend confirmation.
• Source, Type, Length: Customize each MA's configuration.
Ghost Lines (Optional):
• Ghost Lines: When enabled, trend lines extend for only a specified period (Ghost Length) instead of indefinitely.
How to Use the Indicator:
1. Setup:
o Configure RSI settings by choosing the RSI Source and adjusting the RSI Length to suit your trading style.
o Set the Zigzag Length and Confirm Length for trend line sensitivity based on market volatility.
2. Trend Analysis:
o Look at the colored horizontal lines and fills for HH, LH, HL, LL to discern market structure and potential reversal points.
3. Divergence Detection:
o Identify divergences where price and RSI diverge. Regular divergences might signal trend exhaustion, while hidden ones could indicate trend persistence.
4. Breakout/Breakdown Signals:
o Ensure you have both the Waldo RSI Overlay :o and Waldo RSI :o indicators applied. Green triangles below bars signal breakouts; red ones above indicate breakdowns, based on price movement with RSI confirmation from the companion indicator.
5. Overbought/Oversold:
o Use these colored zones to spot potential momentum shifts or reversal areas.
6. Moving Averages on RSI:
o If used, these can help confirm trends or identify crossover signals for additional trade confirmation.
7. Ghost Lines:
o For a less cluttered chart, enable this to limit how far trend lines extend.
Tips for Usage:
• Always combine this indicator with other analytical tools for better confirmation. No single indicator should guide all decisions.
• Adjust settings according to the asset's behavior and your trading timeframe.
• Regularly review your settings as market dynamics change.
Remember, trading involves risk, and past performance doesn't predict future outcomes. Use this indicator within a comprehensive trading strategy.

MA RSI MACD Signal SuiteThis Pine Script™ is designed for use in Trading View and generates trading signals based on moving average (MA) crossovers, RSI (Relative Strength Index) signals, and MACD (Moving Average Convergence Divergence) indicators. It provides visual markers on the chart and can be configured to suit various trading strategies.
1. Indicator Overview
The indicator includes signals for:
Moving Averages (MA): It tracks crossovers between different types of moving averages.
RSI: Signals based on RSI crossing certain levels or its signal line.
MACD: Buy and sell signals generated by MACD crossovers.
2. Inputs and Customization
Moving Averages (MAs):
You can customize up to 6 moving averages with different types, lengths, and colors.
MA Type: Choose from different types of moving averages:
SMA (Simple Moving Average)
EMA (Exponential Moving Average)
HMA (Hull Moving Average)
SMMA (RMA) (Smoothed Moving Average)
WMA (Weighted Moving Average)
VWMA (Volume Weighted Moving Average)
T3, DEMA, TEMA
Source: Select the price to base the MA on (e.g., close, open, high, low).
Length: Define the number of periods for each moving average.
Examples:
MA1: Exponential Moving Average (EMA) with a period of 9
MA2: Exponential Moving Average (EMA) with a period of 21
RSI Settings:
RSI is calculated based on a user-defined period and is used to identify potential overbought or oversold conditions.
RSI Length: Lookback period for RSI (default 14).
Overbought Level: Defines the overbought threshold for RSI (default 70).
Oversold Level: Defines the oversold threshold for RSI (default 30).
You can also adjust the smoothing for the RSI signal line and customize when to trigger buy and sell signals based on the RSI crossing these levels.
MACD Settings:
MACD is used for identifying changes in momentum and trends.
Fast Length: The period for the fast moving average (default 12).
Slow Length: The period for the slow moving average (default 26).
Signal Length: The period for the signal line (default 9).
Smoothing Method: Choose between SMA or EMA for both the MACD and the signal line.
3. Signal Logic
Moving Average (MA) Crossover Signals:
Crossover: A bullish signal is generated when a fast MA crosses above a slow MA.
Crossunder: A bearish signal is generated when a fast MA crosses below a slow MA.
The crossovers are plotted with distinct colors, and the chart will display markers for these crossover events.
RSI Signals:
Oversold Crossover: A bullish signal when RSI crosses over its signal line below the oversold level (30).
Overbought Crossunder: A bearish signal when RSI crosses under its signal line above the overbought level (70).
RSI signals are divided into:
Aggressive (Early) Entries: Signals when RSI is crossing the oversold/overbought levels.
Conservative Entries: Signals when RSI confirms a reversal after crossing these levels.
MACD Signals:
Buy Signal: Generated when the MACD line crosses above the signal line (bullish crossover).
Sell Signal: Generated when the MACD line crosses below the signal line (bearish crossunder).
Additionally, the MACD histogram is used to identify momentum shifts:
Rising to Falling Histogram: Alerts when the MACD histogram switches from rising to falling.
Falling to Rising Histogram: Alerts when the MACD histogram switches from falling to rising.
4. Visuals and Alerts
Plotting:
The script plots the following on the price chart:
Moving Averages (MA): The selected MAs are plotted as lines.
Buy/Sell Shapes: Triangular markers are displayed for buy and sell signals generated by RSI and MACD.
Crossover and Crossunder Markers: Crosses are shown when two MAs crossover or crossunder.
Alerts:
Alerts can be configured based on the following conditions:
RSI Signals: Alerts for oversold or overbought crossover and crossunder events.
MACD Signals: Alerts for MACD line crossovers or momentum shifts in the MACD histogram.
Alerts are triggered when specific conditions are met, such as:
RSI crosses over or under the oversold/overbought levels.
MACD crosses the signal line.
Changes in the MACD histogram.
5. Example Usage
1. Trend Reversal Setup:
Buy Signal: Use the RSI oversold crossover and MACD bullish crossover to identify potential entry points in a downtrend.
Sell Signal: Use the RSI overbought crossunder and MACD bearish crossunder to identify potential exit points or short entries in an uptrend.
2. Momentum Strategy:
Combine MACD and RSI signals to identify the strength of a trend. Use MACD histogram analysis and RSI levels for confirmation.
3. Moving Average Crossover Strategy:
Focus on specific MA crossovers, such as the 9-period EMA crossing above the 21-period EMA, for buy signals. When a longer-term MA (e.g., 50-period) crosses a shorter-term MA, it may indicate a strong trend change.
6. Alerts Conditions
The script includes several alert conditions, which can be triggered and customized based on the user’s preferences:
RSI Oversold Crossover: Alerts when RSI crosses over the signal line below the oversold level (30).
RSI Overbought Crossunder: Alerts when RSI crosses under the signal line above the overbought level (70).
MACD Buy/Sell Crossover: Alerts when the MACD line crosses the signal line for a buy or sell signal.
7. Conclusion
This script is highly customizable and can be adjusted to suit different trading strategies. By combining MAs, RSI, and MACD, traders can gain multiple perspectives on the market, enhancing their ability to identify potential buy and sell opportunities.

MTF RSI CandlesThis Pine Script indicator is designed to provide a visual representation of Relative Strength Index (RSI) values across multiple timeframes. It enhances traditional candlestick charts by color-coding candles based on RSI levels, offering a clearer picture of overbought, oversold, and sideways market conditions. Additionally, it displays a hoverable table with RSI values for multiple predefined timeframes.
Key Features
1. Candle Coloring Based on RSI Levels:
Candles are color-coded based on predefined RSI ranges for easy interpretation of market conditions.
RSI Levels:
75-100: Strongest Overbought (Green)
65-75: Stronger Overbought (Dark Green)
55-65: Overbought (Teal)
45-55: Sideways (Gray)
35-45: Oversold (Light Red)
25-35: Stronger Oversold (Dark Red)
0-25: Strongest Oversold (Bright Red)
2. Multi-Timeframe RSI Table:
Displays RSI values for the following timeframes:
1 Min, 2 Min, 3 Min, 4 Min, 5 Min
10 Min, 15 Min, 30 Min, 1 Hour, 1 Day, 1 Week
Helps traders identify RSI trends across different time horizons.
3. Hoverable RSI Values:
Displays the RSI value of any candle when hovering over it, providing additional insights for analysis.
Inputs
1. RSI Length:
Default: 14
Determines the calculation period for the RSI indicator.
2. RSI Levels:
Configurable thresholds for RSI zones:
75-100: Strongest Overbought
65-75: Stronger Overbought
55-65: Overbought
45-55: Sideways
35-45: Oversold
25-35: Stronger Oversold
0-25: Strongest Oversold
How It Works:
1. RSI Calculation:
The RSI is calculated for the current timeframe using the input RSI Length.
It is also computed for 11 additional predefined timeframes using request.security.
2. Candle Coloring:
Candles are colored based on their RSI values and the specified RSI levels.
3. Hoverable RSI Values:
Each candle displays its RSI value when hovered over, via a dynamically created label.
Multi-Timeframe Table:
A table at the bottom-left of the chart displays RSI values for all predefined timeframes, making it easy to compare trends.
Usage:
1. Trend Identification:
Use candle colors to quickly assess market conditions (overbought, oversold, or sideways).
2. Timeframe Analysis:
Compare RSI values across different timeframes to determine long-term and short-term momentum.
3. Signal Confirmation:
Combine RSI signals with other indicators or patterns for higher-confidence trades.
Best Practices
Use this indicator in conjunction with volume analysis, support/resistance levels, or trendline strategies for better results.
Customize RSI levels and timeframes based on your trading strategy or market conditions.
Limitations
RSI is a lagging indicator and may not always predict immediate market reversals.
Multi-timeframe analysis can lead to conflicting signals; consider your trading horizon.

Volume-Based RSI Color Indicator with MAsVolume-Based RSI Color Indicator with MAs
Overview
This script combines the Relative Strength Index (RSI) with volume analysis to provide an enhanced perspective on market conditions. By dynamically coloring the RSI line based on overbought/oversold conditions and volume thresholds, this indicator helps traders quickly identify high-probability reversal zones. Additionally, it incorporates short-term and long-term moving averages (MAs) of the RSI for trend analysis, making it a versatile tool for scalping and swing trading strategies.
Key Features
Dynamic RSI Color Coding:
The RSI line changes color based on two conditions:
Overbought/High Volume: RSI is above the overbought threshold (default: 70) and volume exceeds the average volume by a user-defined multiplier (default: 2.0). The line turns red, indicating potential reversal zones.
Oversold/High Volume: RSI is below the oversold threshold (default: 30) and volume exceeds the average volume by the multiplier. The line turns green, suggesting potential buying opportunities.
Neutral Conditions: Default blue color for all other scenarios.
Volume Integration:
Unlike standard RSI indicators, this script incorporates volume data to refine signals, helping traders avoid false signals in low-volume environments.
RSI Moving Averages:
Two moving averages of the RSI (short-term and long-term) provide trend context:
200-period MA: Highlights the long-term trend in RSI values.
20-period MA: Shows short-term fluctuations for quick decision-making.
Both MAs can be calculated using Simple or Exponential methods, giving users flexibility.
Visual Aids:
Horizontal lines at the overbought (70) and oversold (30) levels help define the boundaries of expected price action extremes.
How It Works
The script calculates the RSI over a user-defined length (default: 14).
Volume data is compared to its moving average to determine if it exceeds the user-defined high-volume threshold.
When RSI and volume conditions align, the RSI line is dynamically colored to indicate potential overbought/oversold zones.
The RSI moving averages provide additional context to confirm trends or reversals.
How to Use
Identify Reversal Zones:
Look for green RSI signals in oversold conditions to identify potential buying opportunities.
Look for red RSI signals in overbought conditions to identify potential selling opportunities.
Use Moving Averages for Confirmation:
When the RSI is above its 200-period MA, the long-term trend is bullish; consider only long trades.
When the RSI is below its 200-period MA, the trend is bearish; consider only short trades.
Combine with Other Tools:
This indicator works best when used alongside price action analysis, candlestick patterns, or support/resistance levels.
Originality
This script is unique in combining volume analysis with RSI and RSI-specific moving averages. While many indicators focus on RSI or volume separately, this script marries these two key metrics to filter out weak signals and improve trade decision accuracy.
Chart Recommendations
Clean Chart: Use this indicator on a clean chart without additional overlays for maximum clarity.
Timeframes: Works well on intraday charts (e.g., 5m, 15m) for scalping and on higher timeframes (e.g., 1H, 4H, Daily) for swing trading.
Disclaimer
This indicator is a tool to aid trading decisions and should not be used in isolation. Always consider other factors such as market conditions, news events, and risk management.
