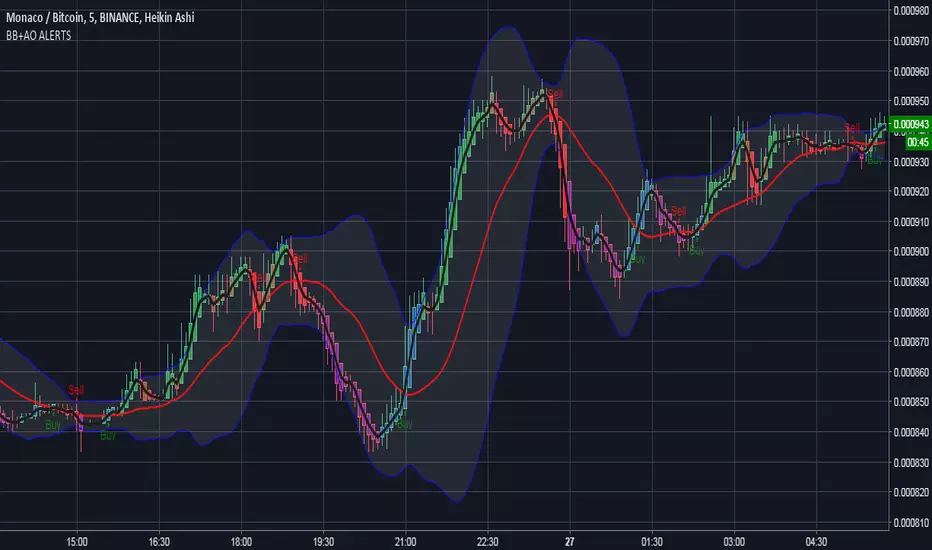
BB+AO ALERTSto be used with AO indicator, based on forex strat --
www.forexstrategiesresources.com
works on 1/3/5/15/30 candles, buy signals are best when the black 3 fast ema crosses up through the red mid band
Tìm kiếm tập lệnh với "scalping"
MTF Bollinger Bands (2SD & 3SD)
개요
1분봉이나 5분봉 등 하위 타임프레임에서 스캘핑을 할 때, 차트를 변경하지 않고 상위 타임프레임(기본 4시간)의 볼린저 밴드 위치를 확인하기 위해 제작했습니다.
주요 기능
MTF (Multi-Timeframe): 현재 보고 있는 차트와 상관없이 설정한 타임프레임의 볼린저 밴드를 표시합니다. (기본값: 4시간)
듀얼 밴드 시각화 (Dual Zone): 표준편차 2(2SD)와 표준편차 3(3SD)을 동시에 계산합니다.
2SD 영역: 2SD와 3SD의 배경색이 겹치도록 설계하여, 중심부(2SD)가 시각적으로 더 진하게 보입니다. 이는 주요 지지/저항 구간을 직관적으로 보여줍니다.
3SD 영역: 외곽은 연하게 표시되어 과매수/과매도 구간을 식별하기 좋습니다.
끊김 없는 라인: gaps_off 처리를 통해 타임프레임 변경 시 선이 끊기지 않고 부드럽게 연결됩니다.
설정 가이드
Timeframe: 기준이 될 상위 시간대를 선택하세요. (기본: 240분/4시간)
Multiplier: 표준편차 배수를 변경할 수 있습니다. (기본: 2.0 / 3.0)
Transparency: 배경 투명도를 조절해 밴드의 진하기를 변경하세요.
==========================================
Overview
Designed for traders who need to monitor Higher Timeframe (HTF) volatility while scalping on Lower Timeframes (LTF). This indicator overlays HTF Bollinger Bands on your current chart without the need to switch tabs.
Key Features
MTF Capability: Displays Bollinger Bands from any user-defined timeframe. (Default: 4 Hours).
Dual Zone Visualization: Plots both 2 Standard Deviations (2SD) and 3 Standard Deviations (3SD).
Visual Depth: The script utilizes an overlapping fill method. The inner 2SD band appears darker as it layers on top of the 3SD background, clearly highlighting the primary support/resistance zone.
Extreme Zones: The outer 3SD band remains lighter, indicating extreme overbought/oversold conditions.
Seamless Plotting: Uses gaps_off to ensure lines remain continuous across different timeframes.
Settings
Timeframe: Select the target HTF. (Default: 240 / 4H)
Multiplier: Adjust the standard deviation multipliers. (Default: 2.0 & 3.0)
Style: Customize colors and transparency to fit your chart theme.

My Exclusive Support & Resistance Strategyndicator Name:
Market Maker Pro: Multi-TF S&R & Hidden Signals (CALL/PUT)
Description:
This is a professional-grade institutional trading indicator designed to identify "Market Maker" entries by combining Volume-Weighted Average Price (VWAP), EMA Crossovers, and Multi-Timeframe Support & Resistance levels.
The indicator is optimized for traders who seek high-probability entries (CALL/PUT) on any timeframe, from 1-minute scalping to 4-hour swing trading.
Key Features:
Institutional Support & Resistance (4H & 1H): Automatically plots high-impact levels from the 4-hour and 1-hour charts. These appear as short, clean lines (12 bars) to keep the chart clutter-free.
Hidden Market Maker Logic: Uses a background combination of EMA 20 and EMA 50 crossovers, filtered by the VWAP (the "Fair Value" for big banks).
Precision Signals (CALL/PUT): * CALL Signal: Triggered only when EMA 20 crosses above EMA 50 while the price is trading above the VWAP.
PUT Signal: Triggered only when EMA 20 crosses below EMA 50 while the price is trading below the VWAP.
Multi-Timeframe Adaptive: Seamlessly works across all timeframes (1m, 5m, 15m, 1h, 4h).
Visual Confidence: High-visibility labels and background highlights ensure you never miss a confirmed institutional entry.
How to Trade:
Identify the Wall: Look for the thick lines (4H levels) to identify major reversal zones.
Wait for the Signal: Look for the CALL or PUT label.
Confirm with VWAP: The signal only appears if the price is on the correct side of the institutional volume (VWAP), giving you a "Market Maker" edge.

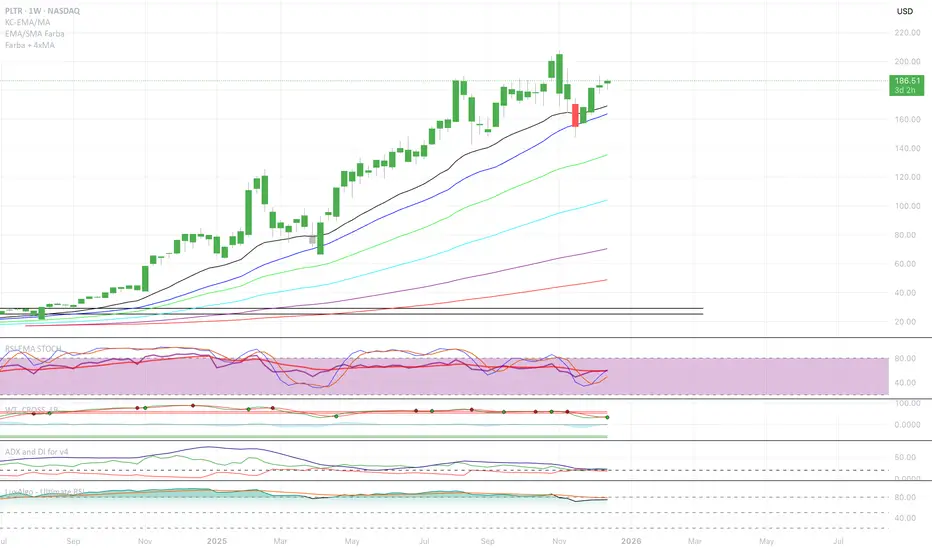
EMA SMA Rhythmic Lite Public V1.1 by SRTEMA SMA Rhythmic Lite Public V1.1 by SRT
A clean, lightweight trend-rhythm engine designed for traders of all levels. Built on a robust combination of EMAs and SMAs, this indicator provides clear directional bias signals while remaining fully non-repainting.
Key Features:
Multi-Timeframe Friendly: Works seamlessly on M1 to Daily (D) charts. MA stacking and signal logic automatically adapt to any timeframe.
Bias Detection: Determines bullish, bearish, or neutral market conditions using a 4-MA stack.
Engulfing Bar (EB) & Long-Tail Body (LTB) Detection: Highlights strong price action setups, filtered by body size and ATR-based thresholds.
Flush Markers: Visual cues showing where price aligns with MA stack for trend confirmation.
Bias Table: Displays current MA bias and presence of LTB on the chart for at-a-glance clarity.
Advanced Alerts:
Flush Alerts: Trigger when MA stack aligns with price, signaling trend continuation.
Combo Alerts: Trigger when EB or LTB appears in alignment with MA bias.
LTB-only Alerts: For monitoring significant price action reversals.
Customizable Visualization: Colors, widths, and visibility of all MAs, labels, and flush dots can be tailored to your preference.
Why Lite?
This is the most lightweight version in the SRT rhythm series, optimized for any timeframe, from scalping to swing trading. Perfect for traders who want a clear bias engine without unnecessary complexity.
If you like this EMA SMA Rhythmic Lite, you may also explore:
▶ H1 Bias Rhythmic Lite Public (Free)
▶ SRT Premium Series
Invite-only advanced indicators with stronger bias enforcement and execution frameworks.

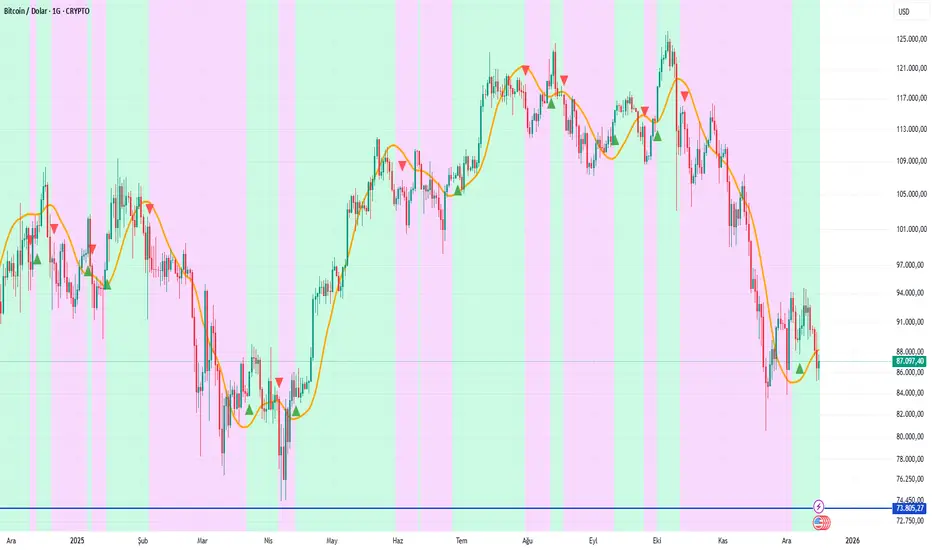
Impulse Trend Suite (LITE) v4🚀 Impulse Trend Suite (LITE) — v4
Smart trend visualization with precise flip arrows. A lightweight, momentum-filtered trend tool designed to stay clean, avoid repeated signals, and keep you focused only on real market direction.
📌 Core Features
Trend flip arrows (no spam, 1 signal per turn)
Continuous background zones (gap-free trend shading)
Adaptive Baseline + ATR structure channel
RSI + MACD momentum filter (suppresses weak signals)
Trend Status Panel (UP, DOWN, NEUTRAL)
🔍 Quick Guide
BUY setup = green arrow + green background
SELL setup = red arrow + red background
Stay in the move while color doesn’t change
ATR channel helps avoid chasing overextended candles
========================================================
📈 Works on Forex, Stocks, Crypto, Indices, Metals
⌚ Scalping • Intraday • Swing • Long-term
==========================================================
⚠️ Backtest before trading live.
Happy trading and many pips!

Adaptive Z-Score Oscillator [QuantAlgo]🟢 Overview
The Adaptive Z-Score Oscillator transforms price action into statistical significance measurements by calculating how many standard deviations the current price deviates from its moving average baseline, then dynamically adjusting threshold levels based on historical distribution patterns. Unlike traditional oscillators that rely on fixed overbought/oversold levels, this indicator employs percentile-based adaptive thresholds that automatically calibrate to changing market volatility regimes and statistical characteristics. By offering both adaptive and fixed threshold modes alongside multiple moving average types and customizable smoothing, the indicator provides traders and investors with a robust framework for identifying extreme price deviations, mean reversion opportunities, and underlying trend conditions through the visualization of price behavior within a statistical distribution context.
🟢 How It Works
The indicator begins by establishing a dynamic baseline using a user-selected moving average type applied to closing prices over the specified length period, then calculates the standard deviation to measure price dispersion:
basis = ma(close, length, maType)
stdev = ta.stdev(close, length)
The core Z-Score calculation quantifies how many standard deviations the current price sits above or below the moving average basis, creating a normalized oscillator that facilitates cross-asset and cross-timeframe comparisons:
zScore = stdev != 0 ? (close - basis) / stdev : 0
smoothedZ = ma(zScore, smooth, maType)
The adaptive threshold mechanism employs percentile calculations over a historical lookback period to determine statistically significant extreme zones. Rather than using fixed levels like ±2.0, the indicator identifies where a specified percentage of historical Z-Score readings have fallen, automatically adjusting to market regime changes:
upperThreshold = adaptive ? ta.percentile_linear_interpolation(smoothedZ, percentilePeriod, upperPercentile) : fixedUpper
lowerThreshold = adaptive ? ta.percentile_linear_interpolation(smoothedZ, percentilePeriod, lowerPercentile) : fixedLower
The visualization architecture creates a four-tier coloring system that distinguishes between extreme conditions (beyond the adaptive thresholds) and moderate conditions (between the midpoint and threshold levels), providing visual gradation of statistical significance through opacity variations and immediate recognition of distribution extremes.
🟢 How to Use This Indicator
▶ Overbought and Oversold Identification:
The indicator identifies potential overbought conditions when the smoothed Z-Score crosses above the upper threshold, indicating that price has deviated to a statistically extreme level above its mean. Conversely, oversold conditions emerge when the Z-Score crosses below the lower threshold, signaling statistically significant downward deviation. In adaptive mode (default), these thresholds automatically adjust to the asset's historical behavior, i.e., during high volatility periods, the thresholds expand to accommodate wider price swings, while during low volatility regimes, they contract to capture smaller deviations as significant. This dynamic calibration reduce false signals that plague fixed-level oscillators when market character shifts between volatile and ranging conditions.
▶ Mean Reversion Trading Applications:
The Z-Score framework excels at identifying mean reversion opportunities by highlighting when price has stretched too far from its statistical equilibrium. When the oscillator reaches extreme bearish levels (below the lower threshold with deep red coloring), it suggests price has become statistically oversold and may snap back toward the mean, presenting potential long entry opportunities for mean reversion traders. Symmetrically, extreme bullish readings (above the upper threshold with bright green coloring) indicate potential short opportunities or long exit points as price becomes statistically overbought. The moderate zones (lighter colors between midpoint and threshold) serve as early warning areas where traders can prepare for potential reversals, while exits from extreme zones (crossing back inside the thresholds) often provide confirmation that mean reversion is underway.
▶ Trend and Distribution Analysis:
Beyond discrete overbought/oversold signals, the histogram's color pattern and shape reveal the underlying trend structure and distribution characteristics. Sustained periods where the Z-Score oscillates primarily in positive territory (green bars) indicate a bullish trend where price consistently trades above its moving average baseline, even if not reaching extreme levels. Conversely, predominant negative readings (red bars) suggest bearish trend conditions. The distribution shape itself provides insight into market behavior, e.g., a narrow, centered distribution clustering near zero indicates tight ranging conditions with price respecting the mean, while a wide distribution with frequent extreme readings reveals volatile trending or choppy conditions. Asymmetric distributions skewed heavily toward one side demonstrate persistent directional bias, whereas balanced distributions suggest equilibrium between bulls and bears.
▶ Built-in Alerts:
Seven alert conditions enable automated monitoring of statistical extremes and trend transitions. Enter Overbought and Enter Oversold alerts trigger when the Z-Score crosses into extreme zones, providing early warnings of potential reversal setups. Exit Overbought and Exit Oversold alerts signal when price begins reverting from extremes, offering confirmation that mean reversion has initiated. Zero Cross Up and Zero Cross Down alerts identify transitions through the neutral line, indicating shifts between above-mean and below-mean price action that can signal trend changes. The Extreme Zone Entry alert fires on any extreme threshold penetration regardless of direction, allowing unified monitoring of both overbought and oversold opportunities.
▶ Color Customization:
Six visual themes (Classic, Aqua, Cosmic, Ember, Neon, plus Custom) accommodate different chart backgrounds and aesthetic preferences, ensuring optimal contrast and readability across trading platforms. The bar transparency control (0-90%) allows fine-tuning of visual prominence, with minimal transparency creating bold, attention-grabbing bars for primary analysis, while higher transparency values produce subtle background context when using the oscillator alongside other indicators. The extreme and moderate zone coloring system uses automatic opacity variation to create instant visual hierarchy, with darkest colors highlight the most statistically significant deviations demanding immediate attention, while lighter shades mark developing conditions that warrant monitoring but may not yet justify action. Optional candle coloring extends the Z-Score color scheme directly to the price candles on the main chart, enabling traders to instantly recognize statistical extremes and trend conditions without needing to reference the oscillator panel, creating a unified visual experience where both price action and statistical analysis share the same color language.

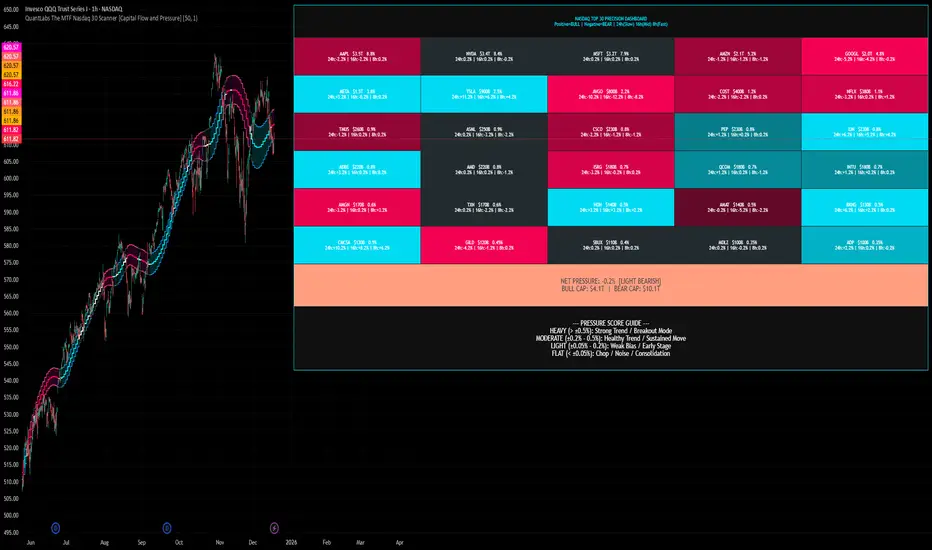
QuantLabs The MTF Nasdaq 30 Scanner [Capital Flow and Pressure]Trading the QQQ (Nasdaq) without knowing what the Generals (Apple, Nvidia, Microsoft) are doing is like driving at night with your headlights off. You might see the road right in front of you, but you'll miss the turn coming up.
The QuantLabs MTF Nasdaq 30 Scanner is not just a trend indicator, it is a professional-grade Market Dashboard that visualizes the heartbeat of the entire Nasdaq 100.
Why You Need This
Standard indicators lag. They tell you what happened after the move. This Heatmap tracks the Real-Time Capital Flow of the Top 30 companies that actually move the index ($Trillions in Market Cap).
Key Features
1. The "Spectacular" Precision Heatmap
Organized by Market Cap Size (AAPL/NVDA first).
Instantly spot divergent behavior. Is the market rallying, or is it just Nvidia holding everything up? The Heatmap reveals the truth instantly.
Colors: Neon Cyan (Bullish) vs Hot Pink (Bearish).
2. Triple Spectrum Technology (3-in-1 Timeframes) Why look at one timeframe when you can see three? Every cell in the dashboard displays the trend distance for:
8h (Fast): For scalping entries.
16h (Mid): For swing trends.
24h (Slow): For the major "Big Picture" bias.
Values denote % distance from the Flux Ribbon.
3. The "Net Pressure" Gauge (The Speedometer) A predictive summary footer that calculates the Weighted Pressure of the entire market.
HEAVY (> 0.5%): Strong Trend / Breakout Mode.
MODERATE (0.2% - 0.5%): Healthy, sustained move.
FLAT: Chop / Noise. Stay out.
It also shows exactly how much Capital ($Trillions) is sitting Bullish vs Bearish.
How to Trade with It
Check the "Net Pressure": If it says MODERATE BULLISH, you are looking for Longs only.
Scan the Top Row: Are the "Big 5" (AAPL, NVDA, MSFT...) aligned with the pressure?
Wait for Alignment: If the 8h, 16h, and 24h metrics all turn Cyan, that is a "Quantum Lock"—a high probability breakout signal.
Simple. Powerful. Neon. Add it to your chart and stop guessing the direction.
Credits: Built with 💜 by David James @ QuantLabs
Premarket High Low 4:00 at 9:30 AMThis indicator is designed for scalping in 2-minute intervals, taking into account that trading should occur after an SMA 13 / SMA 20 / SMA 200 compression.

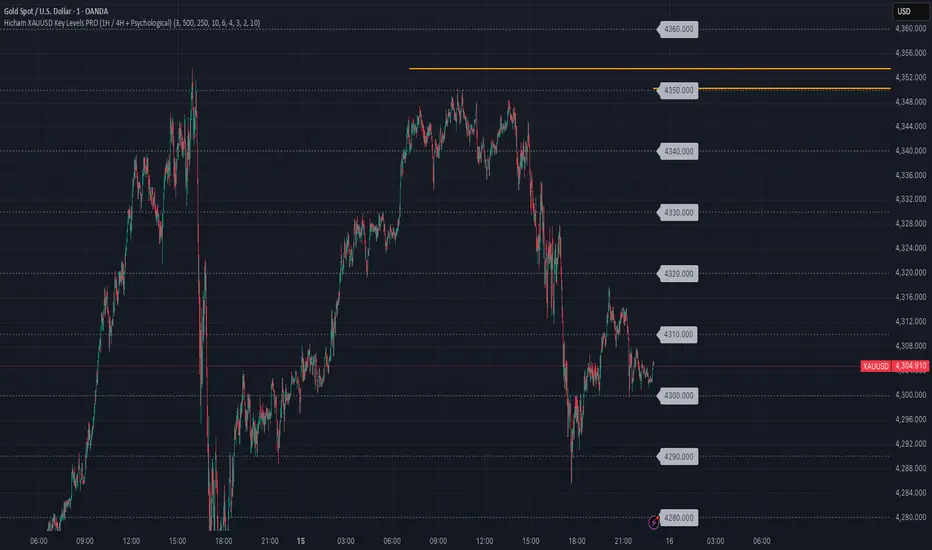
Hicham XAUUSD Key Levels PRO (Custom Series) V2🔑 XAUUSD Key Levels PRO | 1H / 4H Structure + Psychological Levels v2
This indicator is designed specifically for Gold (XAUUSD) traders who want clean, institutional-grade key levels without chart clutter.
It combines market structure levels with true psychological price levels used by institutions, making it ideal for scalping, intraday, and swing trading.
📌 Features
🔹 Market Structure Key Levels
Automatic 1H & 4H High / Low detection
Based on swing pivots (configurable strength)
Solid lines for clear structure visibility
🔹 Gold Psychological Levels (XAUUSD)
Major levels: every 500$ (strong institutional zones)
Medium levels: every 250$
Minor levels: every 10$
Dynamic levels around current price
No line spam, optimized performance
🔹 Visual Clarity
Solid / dashed / dotted line styles
Custom colors & line thickness
Optional price labels
Works perfectly on M1 → H4
🎯 Best Use Cases
Liquidity sweeps & reactions
Premium / discount zones
Stop-loss & take-profit placement
Confluence with BOS / CHoCH
London & New York sessions
⚙️ Fully Customizable
Toggle 1H / 4H levels
Adjust psychological level spacing
Enable / disable labels
Clean & lightweight (no lag)
⚠️ Notes
Optimized for XAUUSD (Gold)
Best results when combined with price action & structure
Not a trading signal indicator
If you want:
Session-based levels
Alerts on key levels
Smart Money Concepts integration
Feel free to comment or DM 👊
Happy trading 💛📈
Open-source script
In true TradingView spirit, the creator of this script has made it open-source, so that traders can review and verify its functionality. Kudos to the author! While you can use it for free, remember that republishing the code is subject to our House Rules.
hichamfata
Disclaimer
The information and publications are not meant to be, and do not constitute, financial, investment, trading, or other types of advice or recommendations supplied or endorsed by TradingView. Read more in the Terms of Use.

[TradingPulse] - Overlay+ PRO ScalpingTrade like a don on 1 min scalps.
sdäajdfkjsKLÖJfd#
sf
dasfd
asfa
dadf
affdsa
affda
adfs

Microstructure Participation & Acceptance Indicator📊 Microstructure Participation & Acceptance Indicator
An advanced participation-based filter combining VWAP distance analysis, volume delta detection, and real-time acceptance/rejection state identification—designed for smaller timeframe trading.
📊 FEATURES
VWAP Distance Normalization
Context-aware fair value measurement:
Automatically resets based on selected anchor (Session/Week/Month)
ATR-normalized distance calculation for universal application
Identifies when price is extended or compressed relative to equilibrium
Configurable extreme distance threshold (default: 1.5 ATR)
Adjustable source input (default: HLC3)
Volume Delta Proxy
Bull vs Bear participation tracking:
Calculates volume imbalance between bullish and bearish candles
EMA smoothing for cleaner signal generation (default: 9 periods)
Delta ratio measurement to identify dominant side
Expansion/compression detection to gauge momentum commitment
Configurable expansion threshold (default: 1.3x)
Acceptance/Rejection State Machine
Real-time market regime identification with six distinct states:
🟢 Accepted Long
Price moving away from VWAP with expanding bullish delta
Distance from VWAP increasing
Volume confirming the move
Indicates real buying pressure—trade WITH the move
🟢 Accepted Short
Price moving away from VWAP with expanding bearish delta
Distance from VWAP increasing
Volume confirming the move
Indicates real selling pressure—trade WITH the move
🟠 Fade Long
Price extended beyond threshold (>1.5 ATR above VWAP)
Delta not supporting the extension
Volume participation absent or diminishing
Potential mean-reversion short setup
🟠 Fade Short
Price extended beyond threshold (>1.5 ATR below VWAP)
Delta not supporting the extension
Volume participation absent or diminishing
Potential mean-reversion long setup
⚪ Chop
Price compressed near VWAP
Bollinger Bands tight (width compressed)
Delta neutral—no clear commitment
NO TRADE ZONE—wait for expansion
⚪ Neutral
Transitional state between regimes
Momentum shifting but not yet confirmed
Monitor for next acceptance signal
Bollinger Bands
Standard volatility measurement with TradingView default styling:
Adjustable period length (default: 20)
Configurable standard deviation multiplier (default: 2.0)
Visual fill between bands for volatility context
Used internally for chop/compression detection
Live Dashboard
Real-time metrics display (top-right corner):
Current market state with color coding
VWAP distance in ATR units
Delta ratio (bull/bear volume balance)
Delta state (Expanding/Compressing)
High-contrast design for instant readability
🎯 HOW TO USE
For Trend Trading:
Accepted Long/Short backgrounds indicate confirmed participation—stay with the trend
Strong moves typically travel 1-1.5 ATR from VWAP with delta support
Use VWAP as dynamic support/resistance
Combine with momentum indicators (MACD, RSI) for confluence
Price above VWAP + Accepted Long state = bullish bias
Price below VWAP + Accepted Short state = bearish bias
For Mean Reversion:
Fade Long/Short states signal overextension without participation
Price beyond 1.5 ATR from VWAP with weak delta = potential reversal
Look for price return to VWAP when extended
Bollinger Band extremes + Fade state = high-probability mean reversion setup
VWAP acts as mean reversion anchor during range-bound sessions
For Risk Management:
Chop state = avoid new entries
Bollinger Band compression + Chop = pre-expansion zone (wait for breakout)
Delta compression after strong move = early exhaustion warning
State transitions (Accepted → Neutral → Fade) = tighten stops
Signal Confirmation:
Strongest setups occur when multiple factors align:
BB breakout + Accepted state + price above/below VWAP
Price rejection at BB bands + Fade state
VWAP support/resistance hold + state transition
Delta expansion + distance increasing + trend direction
⚙️ SETTINGS
All components are fully customizable through organized input groups:
VWAP Distance Group:
VWAP source (default: HLC3)
Anchor period (Session/Week/Month)
ATR length for normalization (default: 14)
Extreme distance threshold in ATR multiples (default: 1.5)
Volume Delta Group:
Delta EMA length (default: 9)
Delta expansion threshold (default: 1.3)
Acceptance Logic Group:
Acceptance lookback period (default: 5)
Chop threshold in VWAP/ATR units (default: 0.3)
Bollinger Bands Group:
BB length (default: 20)
Standard deviation multiplier (default: 2.0)
Display Group:
Toggle state backgrounds
Toggle state change labels
Toggle VWAP line
Toggle Bollinger Bands
💡 EDUCATIONAL VALUE
This indicator teaches important concepts:
How institutional money identifies fair value (VWAP)
The difference between price movement and market acceptance
Why volume participation matters more than price action alone
How to distinguish between noise and committed directional moves
The relationship between volatility compression and expansion cycles
Why distance from equilibrium predicts mean reversion probability
⚠️ IMPORTANT NOTES
This indicator is for educational and informational purposes only
This is a filter, not a standalone trading system
No indicator is perfect—always use proper risk management
Past performance does not guarantee future results
Combine with your own analysis and risk tolerance
Test thoroughly on historical data before live trading
This is not financial advice—use at your own risk
🔧 TECHNICAL DETAILS
Pine Script Version 6
Overlay indicator (displays on price chart)
All calculations use standard, well-documented formulas
No repainting—all signals are confirmed on bar close
Compatible with all timeframes and instruments
Optimized for smaller timeframes (1-5 minute charts)
Minimal computational overhead
📝 CHANGELOG
Version 1.0
Initial release
VWAP distance normalization with ATR scaling
Volume delta proxy system (bull/bear EMA)
6-state acceptance/rejection state machine
Bollinger Bands integration
Real-time dashboard with live metrics
State change labels and background coloring
Full customization options
Developed for traders who need objective participation filters to distinguish high-probability setups from low-quality noise—without cluttering their charts with multiple indicator panels.

EMA/SMA Full color signal candles💡 What It Does:
The indicator calculates and plots the 21-period Exponential Moving Average (EMA) and the 30-period Simple Moving Average (SMA). It then analyzes the closing price of each candle and colors the entire candlestick (body and border) according to pre-defined trend conditions.
This visualization allows traders to identify strong trend environments versus periods of consolidation or indecision at a glance, removing the need to constantly check the price relationship manually.
🎨 Color Conditions and Meaning:
The indicator uses three distinct color states to signal the market's current momentum:
Color,Condition,Market Interpretation
🟢 GREEN,Closing Price is ABOVE both the 21 EMA AND the 30 SMA.,Strong Bullish Trend: Suggests high momentum and confirmation of an uptrend. Ideal for long bias.
🔴 RED,Closing Price is BELOW both the 21 EMA AND the 30 SMA.,Strong Bearish Trend: Suggests high downward pressure and confirmation of a downtrend. Ideal for short bias.
⚫ GRAY,"Closing Price is in any other state (e.g., between the two MAs, or under one and over the other).","Neutral / Consolidation: Indicates uncertainty, low momentum, or potential trend exhaustion/reversal. Caution is advised."
🔧 Customization Options:The indicator is fully customizable, allowing users to fine-tune the periods to match their preferred trading style (e.g., scalping, swing trading).Dĺžka EMA (Length EMA): Allows you to change the period for the Exponential Moving Average (default is 21).Dĺžka SMA (Length SMA): Allows you to change the period for the Simple Moving Average (default is 30).
I added also Extra 4 EMA lines to have extra edge.
AI-based Price action confluence dashboard# **AI-Based Price Action Confluence Dashboard - Publication Guide**
Here's a comprehensive introduction guide for your TradingView indicator publication:
***
## **📊 TITLE**
**AI-Based Price Action Confluence Dashboard**
***
## **🎯 SHORT DESCRIPTION** (For the summary field)
A sophisticated real-time confluence scoring system that analyzes multiple price action signals across 15-minute timeframes, providing traders with an AI-weighted scoring mechanism (0-6 scale) to identify high-probability trade setups through visual signal panels and intelligent path detection.
***
## **📝 FULL DESCRIPTION**
### **Overview**
The AI-Based Price Action Confluence Dashboard is an advanced technical indicator designed to eliminate guesswork in intraday trading by systematically scoring and displaying multiple price action signals in real-time. Unlike traditional single-indicator approaches, this dashboard employs a confluence methodology that combines multiple independent signals to provide stronger trade confirmations and reduce false signals.
This indicator is specifically optimized for **1-minute chart analysis** while monitoring **15-minute price structure**, making it ideal for day traders and scalpers who need precise entry timing with larger timeframe context.
***
### **🔑 Key Features**
**✅ Real-Time AI Confluence Scoring**
- Dynamic scoring system (0-6 points) for both bullish and bearish setups
- Visual meter display shows signal strength at a glance
- Color-coded backgrounds indicate confluence levels (strong, moderate, mixed)
**✅ Multi-Signal Analysis**
The dashboard tracks 6 distinct signal types:
1. **FTFC (First to Finish Close)** - Base & Bonus signals
2. **Long/Short Grab** - Liquidity sweep patterns (Path A)
3. **High/Low Hold** - Extended momentum confirmation (+2 bonus)
4. **2-Up/2-Down** - Clean breakout patterns (Path B)
5. **Breakaway** - First candle gap strategies
**✅ Intelligent Path Detection**
- Mutually exclusive path logic prevents signal conflicts
- Automatically identifies whether price is following a "sweep path" or "clean path"
- Unavailable paths are clearly marked with gray indicators
**✅ Visual Signal Panels**
- 🟢 Green Light = Bullish signal ACTIVE
- 🔴 Red Light = Bearish signal ACTIVE
- 🟡 Yellow Light = Signal BUILDING (conditions partially met)
- ⚪ White Light = Signal OFF
- ▪️ Gray Square = Path UNAVAILABLE (mutually exclusive)
**✅ Comprehensive Alert System**
- 10 different alert conditions covering all major signals
- Strong confluence alerts (5+ points)
- Individual signal completion alerts
- Customizable alert messages
***
### **📐 How It Works**
#### **The Confluence Methodology**
This indicator implements a sophisticated confluence trading approach where multiple independent price action signals are combined to identify high-probability setups. Each signal type contributes points to either the bullish or bearish score, with a maximum of 6 points per direction.
**Scoring Breakdown:**
**BULLISH SIGNALS:**
- FTFC Base (15m close > previous 15m close) = +1
- FTFC Bonus (price clears 15th candle high) = +1
- **PATH A (Sweep):** Long Grab = +1, High Hold Bonus = +2
- **PATH B (Clean):** 2-Up = +1, 2-Up Bonus = +1
- Breakaway (gap above first candle) = +1
**BEARISH SIGNALS:**
- FTFC Base (15m close < previous 15m close) = +1
- FTFC Bonus (price clears 15th candle low) = +1
- **PATH A (Sweep):** Short Grab = +1, Low Hold Bonus = +2
- **PATH B (Clean):** 2-Down = +1, 2-Down Bonus = +1
- Breakaway (gap below first candle) = +1
#### **Path Detection Logic**
The indicator automatically determines which path the market is following:
**PATH A: SWEEP PATH**
- Activated when previous 15m low (bull) or high (bear) is breached
- Indicates liquidity grab before reversal
- Includes powerful +2 bonus for "Hold" confirmations
- Mutually exclusive with Path B
**PATH B: CLEAN PATH**
- Activated when previous 15m low (bull) or high (bear) holds
- Indicates strong directional momentum without sweep
- Cleaner price action but smaller point potential
- Mutually exclusive with Path A
This mutual exclusivity prevents double-counting and ensures signal accuracy.
***
### **🎨 How to Use**
#### **Installation**
1. Add indicator to your 1-minute chart
2. The dashboard appears as a table overlay (default: top right)
3. No additional indicators required - this is a complete system
#### **Reading the Dashboard**
**Top Section - Confluence Meter:**
- Shows current bull/bear scores with visual dot meters
- Background color changes based on confluence strength:
- **Bright Green/Red** = 5+ points (strong directional bias)
- **Medium Green/Red** = 3+ points (moderate bias)
- **Orange** = 3+ points both sides (conflicting signals)
- **Gray** = Low confluence (choppy conditions)
**Signal Panels Section:**
- Each row shows a signal type with bull/bear lights side-by-side
- Active signals (🟢🔴) contribute to the total score
- Building signals (🟡) indicate potential setups forming
- Unavailable paths (▪️) show which exclusive path is blocked
#### **Trading Strategy**
**High-Probability Long Entries:**
- Bull score ≥ 5 AND bear score ≤ 1
- Multiple green lights active in signal panels
- PATH A or PATH B showing full completion
- Consider entry on pullback to key 15m level
**High-Probability Short Entries:**
- Bear score ≥ 5 AND bull score ≤ 1
- Multiple red lights active in signal panels
- PATH A or PATH B showing full completion
- Consider entry on rally to key 15m level
**Avoid Trading When:**
- Both scores are 3+ (conflicting signals)
- No path is showing active/building status
- Score is below 3 on both sides (low confluence)
#### **Risk Management**
- Use 15m swing high/low for stop placement
- Target opposing 15m level or previous session extremes
- Scale out at partial targets when confluence decreases
- Best results when combined with proper position sizing
***
### **⚙️ Customization**
**Dashboard Settings:**
- **Table Location:** Top Left, Top Right, Bottom Left, Bottom Right
- **Text Size:** Tiny, Small, Normal, Large
**Color Scheme:**
- **Bullish Color:** Customize green for bull signals (default: #00cc66)
- **Bearish Color:** Customize red for bear signals (default: #ff4444)
- **Building Color:** Customize yellow for forming signals (default: #ffaa00)
- **Inactive Color:** Customize gray for off signals (default: #555555)
- **Unavailable Color:** Customize dark gray for blocked paths (default: #333333)
All colors can be adjusted to match your chart theme or visual preferences.
***
### **🎯 Best Practices**
1. **Use on 1-minute charts only** - The indicator is calibrated for this timeframe
2. **Trade during liquid sessions** - Best results during NY/London overlap
3. **Wait for 3+ confluence** - Minimum threshold for trade consideration
4. **Watch path transitions** - Signal strength changes when paths flip
5. **Use alerts strategically** - Set alerts for 5+ confluence to catch strong setups
6. **Combine with volume** - High volume confirms signal validity
7. **Respect 15m structure** - Don't fight the larger timeframe bias
***
### **⚠️ Important Notes**
- This indicator is designed for **intraday trading only**
- Requires active monitoring during trading sessions
- Works best on liquid instruments (major forex pairs, indices, large-cap stocks)
- Not suitable for swing trading or position trading
- Past performance does not guarantee future results
- Always use proper risk management and position sizing
***
### **🏷️ Category**
**Oscillators** or **Volatility** (choose based on TradingView categories)
***
### **🏷️ Suggested Tags**
- confluence
- price action
- day trading
- scalping
- intraday
- signals
- dashboard
- multi-timeframe
- 1-minute
- 15-minute
***
### **📜 Disclaimer**
This indicator is a tool for technical analysis and should not be used as the sole basis for trading decisions. All trading involves risk, and you should never risk more than you can afford to lose. The developer assumes no responsibility for trading losses incurred through the use of this indicator. Always practice proper risk management and consider your own risk tolerance before trading.

HMA & RSI Delta Hybrid SignalsA lag-free trend follower combining Hull Moving Average (HMA) with RSI Momentum Delta to filter false signals and catch high-probability reversals.
# 🚀 HMA & RSI Delta Hybrid Signals
This indicator represents a hybrid approach to trend trading by combining the smoothness of the **Hull Moving Average (HMA)** with the explosive detection capabilities of **RSI Momentum Delta**.
Unlike standard indicators that rely solely on price crossovers, this tool confirms the trend direction with the *velocity* of the price change (Momentum Delta), reducing false signals in choppy markets.
### 🧠 How It Works?
**1. Trend Detection (HMA):**
The script uses the **Hull Moving Average**, known for being extremely fast and lag-free, to determine the overall market direction.
* **Orange Line:** Represents the HMA Trend. The slope determines if we are in an Uptrend or Downtrend.
**2. Momentum Confirmation (RSI Delta):**
Instead of looking at raw RSI levels (like 70 or 30), this algorithm calculates the **"Delta"** (Absolute change from the previous bar).
* It asks: *"Is the price moving in the trend direction with enough speed?"*
* If the RSI jumps significantly (determined by the `Delta Threshold`), it confirms a strong entry.
### 🎯 Signal Modes (Sensitivity)
You can choose between two modes depending on your trading style:
* **🛡️ Conservative Mode (Default):**
* Strict filtering.
* Requires the Trend to match the HMA direction AND the RSI Delta to exceed the specific threshold (e.g., 0.8).
* *Best for:* Avoiding false signals in sideways markets.
* **⚔️ Aggressive Mode:**
* Faster entries.
* Requires the Trend to match the HMA direction AND any positive momentum change in RSI.
* *Best for:* Scalping or catching the very beginning of a move.
### ✨ Key Features
* **Non-Repainting Signals:** Once a bar closes, the signal is fixed.
* **Non-Repeating:** It will not spam multiple "BUY" signals in a row; it waits for a trend change or reset.
* **Visual Trend:** Background color changes based on the HMA slope (Green for Bullish, Purple for Bearish).
* **Fully Customizable:** Adjust HMA length, RSI period, and Delta sensitivity.
---
**⚠️ DISCLAIMER:** This tool is for educational and analytical purposes only. Always manage your risk.
Manipulation Candle SystemThis indicator is based on One Candle Scalping Strategy by ProRealAlgos
## **Manipulation Candle System – Simple Explanation**
This indicator helps traders identify **potential market manipulation** during the **US stock market session (New York)** and highlights **key reversal signals**.
---
### **1. Daily ATR (Average True Range)**
* Measures the **average price movement** of the day.
* Helps determine if a move is **normal** or **abnormally large**.
* The indicator calculates **daily ATR** automatically.
* If 15 minute opening candle is more than 25% of Daily ATR, we can call it manipulation is happen .
---
### **2. 15-Minute Opening Candle Box**
* Highlights the **first 15-minute candle** of the US session.
* The box **extends for 2 hours** after the market opens.
* **Color indicates market condition**:
* **Red box** → the opening candle range is bigger than 25% of the daily ATR → potential **manipulation**.
* **Blue box** → the opening candle range is normal → **neutral session**.
* Helps traders visually spot when the market might be trying to **trap traders**.
---
### **3. 5-Minute Reversal Detection**
* Looks for **reversal candle patterns** on the 5-minute chart:
* Bullish engulfing or strong bullish pin → **buy reversal**.
* Bearish engulfing or strong bearish pin → **sell reversal**.
* Only checks during the **US session**, after 15 minute opening candle.
* Helps traders **time entries** in the direction of potential market reversals.
---
### **4. Buy / Sell Signals**
* Shows **triangle markers** on the chart:
* **Green triangle below candle** → buy signal.
* **Red triangle above candle** → sell signal.
* The signal text also indicates:
* `"BUY (Trap Reversal)"` → if the reversal occurs during manipulation.
* `"BUY (Normal Reversal)"` → if the reversal occurs during a neutral session.
* `"SELL (Trap Reversal)"` → if a sell reversal occurs during manipulation.
* `"SELL (Normal Reversal)"` → otherwise.
---
### **5. Info Table**
* Appears at the **top-right** of the chart.
* Shows:
1. Daily ATR value.
2. 15-minute opening candle range.
3. Session condition → `"MANIPULATION"` or `"NEUTRAL"`.
4. Current reversal signal text.
---
### **How a New Trader Can Use It**
1. Look at the **color of the opening box**:
* Red → be cautious, price may trap traders.
* Blue → normal market behavior.
2. Watch for **reversal signals** on the 5-minute chart.
3. Use the **info table** to confirm ATR, session bias, and signals.
4. Combine this with **risk management** before entering trades.

Smart Money Swing Strategy [All-in-One]# Pro Swing Trader 📈
A comprehensive swing trading indicator for TradingView that combines multiple confluence factors to identify high-probability trade setups with built-in risk management.
## 🎯 Overview
This indicator is designed for swing traders who want to catch momentum pullbacks with precision entries. It filters trades using multiple timeframe analysis, RSI zones, volume confirmation, and EMA trends to deliver only the highest-confidence setups.
### Key Features
✅ **Multi-Timeframe Confluence** - Confirms trades with higher timeframe analysis (Daily, 4H, etc.)
✅ **Smart Entry Signals** - Detects pullback-to-EMA reclaim patterns
✅ **Automatic Risk Management** - Calculates stops, targets, and R-multiples
✅ **Dynamic Stop Loss** - ATR trailing stop + break-even automation
✅ **Real-Time HUD Dashboard** - Live confluence scoring and trade metrics
✅ **Comprehensive Alerts** - Entry, TP1, TP2, and stop-loss notifications
✅ **Visual Trade Levels** - Clear on-chart stop-loss and take-profit lines
---
## 📊 How It Works
### Signal Logic
The indicator identifies two types of signals:
**Base Signals** (Small triangles):
- Price pulls back between Fast EMA and Slow EMA
- RSI is in the swing zone (40-60 by default)
- Price reclaims the Fast EMA with momentum
- Optional: Volume spike confirmation
**High-Confidence Signals** (Large triangles):
- All base signal criteria met
- Higher timeframe confirms the trend direction
- HTF RSI and slope alignment
- These are your primary trade signals
### Entry Conditions
#### Long Entry (🟢 HC L)
1. Fast EMA > Slow EMA (uptrend)
2. Previous candle closed between the EMAs (pullback)
3. Current candle crosses above and closes above Fast EMA (reclaim)
4. RSI between 40-60 (swing zone)
5. **HTF Confirmation**: Daily/4H price above EMA50, RSI > 50, positive slope
6. Optional: Volume > 1.5x 20-bar average
#### Short Entry (🔻 HC S)
1. Fast EMA < Slow EMA (downtrend)
2. Previous candle closed between the EMAs (pullback)
3. Current candle crosses below and closes below Fast EMA (reclaim)
4. RSI between 40-60 (swing zone)
5. **HTF Confirmation**: Daily/4H price below EMA50, RSI < 50, negative slope
6. Optional: Volume > 1.5x 20-bar average
---
## 🎛️ Settings & Parameters
### Trend Parameters
- **Fast EMA**: Default 20 - Quick trend detection
- **Slow EMA**: Default 50 - Major trend filter
- **Swing Lookback**: Default 10 - Bars to find swing high/low for stops
### RSI Settings
- **RSI Length**: Default 14
- **RSI Min**: Default 40 - Lower bound of swing zone
- **RSI Max**: Default 60 - Upper bound of swing zone
### Risk Management
- **Final TP Risk-Reward (R)**: Default 2.0 - Main profit target multiplier
- **TP1 R Multiple**: Default 1.0 - Partial profit target
- **Use Break-even Stop**: Move stop to entry after 1R profit
- **ATR Trailing Stop**: Dynamic stop based on ATR(14) x 2.0
### Filters
- **Require Volume Spike**: Optional volume confirmation filter
- **Use Higher TF Confirmation**: Enable multi-timeframe analysis
- **Higher TF**: Default "D" (Daily) - Can use 240 (4H), W (Weekly), etc.
---
## 📈 Dashboard (HUD)
The top-center dashboard shows real-time confluence status:
| Column | Meaning |
|--------|---------|
| **Trend** | Current trend direction (UP/DOWN/Flat) |
| **HTF** | Higher timeframe alignment (Bull/Bear/Flat) |
| **RSI Zone** | Is RSI in swing zone? (YES/NO) |
| **Volume** | Volume spike detected? (YES/NO) |
| **Signal** | Active signal type (HC LONG/HC SHORT/None) |
| **R Risk** | Current profit in R-multiples |
| **Stop** | Current stop-loss level |
| **TP1** | Partial take-profit status |
| **TP2** | Final take-profit status |
| **Conf %** | Overall confluence score (0-100%) |
### Confidence Score Breakdown
- **20%** - Trend present (up or down)
- **30%** - HTF confirmation aligned (or 15% if HTF off)
- **20%** - RSI in swing zone
- **10%** - Volume spike
- **20%** - High-confidence signal triggered
**Scoring**:
- 🟢 70%+ = High probability setup
- 🟡 40-69% = Moderate setup
- 🔴 <40% = Low probability
---
## 🔔 Alert Setup
The indicator includes 8 alert conditions:
### Entry Alerts
- **HC LONG ENTRY** - High-confidence long signal triggered
- **HC SHORT ENTRY** - High-confidence short signal triggered
### Profit Target Alerts
- **LONG TP1 Reached** - Hit partial profit (1R by default)
- **LONG Final TP Reached** - Hit final target (2R by default)
- **SHORT TP1 Reached** - Hit partial profit
- **SHORT Final TP Reached** - Hit final target
### Stop Loss Alerts
- **LONG Stop/BE/Trail Level Hit** - Long position stopped out
- **SHORT Stop/BE/Trail Level Hit** - Short position stopped out
### How to Set Up Alerts
1. Click "Add Alert" on TradingView
2. Choose this indicator from the dropdown
3. Select desired alert condition
4. Set alert to trigger "Once Per Bar Close"
5. Customize notification method (popup/email/webhook)
---
## 📋 Trading Workflow
### 1. Wait for High-Confidence Signal
Look for the large **HC L** or **HC S** triangle on chart close.
### 2. Verify Confluence
Check the HUD dashboard:
- Confidence score should be 70%+
- HTF status should show alignment
- RSI Zone should be "YES"
### 3. Entry
Enter the trade at market or on next candle open.
### 4. Set Stop Loss
Use the **initial stop** shown in the HUD (red line on chart):
- **Longs**: Below the swing low (10-bar lookback)
- **Shorts**: Above the swing high (10-bar lookback)
### 5. Set Take Profits
- **TP1**: 1R (50% position close) - Yellow line
- **TP2**: 2R (remaining 50% close) - Green line
### 6. Manage the Trade
- Monitor the **R Risk** column to track profit
- Stop moves to break-even automatically after 1R (if enabled)
- ATR trailing stop engages dynamically (red line adjusts)
- Exit if price hits dynamic stop level
---
## 🎨 Visual Guide
### On-Chart Elements
**Triangles**:
- Small lime/red triangles = Base signals (lower confidence)
- Large lime/red triangles = High-confidence signals (trade these!)
**Lines**:
- 🟢 Green line = Fast EMA (20)
- 🟠 Orange line = Slow EMA (50)
- 🔴 Red line = Dynamic stop-loss level
- 🟡 Yellow line = TP1 level
- 🟢 Green line = TP2 (final target)
**HUD Colors**:
- 🟢 Green = Bullish/Active/Good
- 🔴 Red = Bearish/Inactive/Warning
- 🟡 Yellow = Neutral/Caution
- 🔵 Blue = Informational
- ⚫ Gray = Disabled/Off
---
## 💡 Strategy Tips
### Best Practices
1. **Only trade High-Confidence signals** - Ignore base signals unless very experienced
2. **Respect the HTF** - Don't fight the higher timeframe trend
3. **Use proper position sizing** - Risk 1-2% of account per trade
4. **Partial profits work** - Take 50% off at TP1, let rest run to TP2
5. **Let winners run** - Trailing stop helps capture extended moves
6. **Be patient** - Quality over quantity; wait for 70%+ confluence
### Optimal Timeframes
- **Primary Chart**: 1H, 4H, Daily (swing trading)
- **HTF Setting**: One level higher than your chart
- If trading 1H → Set HTF to 4H or D
- If trading 4H → Set HTF to D or W
- If trading Daily → Set HTF to W
### Market Conditions
**Best Performance**:
- Trending markets with healthy pullbacks
- Clear support/resistance zones
- Moderate volatility
**Avoid Trading**:
- Extremely choppy/sideways markets
- Major news events (unless experienced)
- Low confidence scores (<40%)
---
## ⚙️ Advanced Customization
### Aggressive Setup (More Signals)
```
Fast EMA: 12
Slow EMA: 26
RSI Min: 35
RSI Max: 65
Use HTF Confirmation: OFF
Require Volume Spike: OFF
```
### Conservative Setup (Fewer, Higher Quality)
```
Fast EMA: 20
Slow EMA: 50
RSI Min: 45
RSI Max: 55
Use HTF Confirmation: ON
Require Volume Spike: ON
Final TP R: 3.0
```
### Scalping Adaptation (Not Recommended)
```
Fast EMA: 9
Slow EMA: 21
Swing Lookback: 5
TP1 R: 0.5
Final TP R: 1.0
```
---
## ⚠️ Risk Disclaimer
**IMPORTANT**: This indicator is for educational and informational purposes only.
- Past performance does not guarantee future results
- No indicator is 100% accurate
- Always use proper risk management
- Never risk more than you can afford to lose
- Consider using a demo account first
- Seek professional financial advice if needed
Trading involves substantial risk of loss and is not suitable for all investors.
---
## 🔧 Troubleshooting
### "No signals appearing"
- Check if HTF confirmation is enabled but market isn't aligned
- Verify RSI zone isn't too restrictive
- Ensure volume spike isn't filtering out all setups
- Try adjusting EMA lengths for your asset
### "Too many false signals"
- Enable HTF confirmation
- Tighten RSI zone (e.g., 45-55)
- Enable volume spike requirement
- Only trade 70%+ confidence setups
### "Stops too tight/wide"
- Adjust Swing Lookback length
- Modify ATR multiplier for trailing stop
- Consider the asset's volatility
### "Alerts not working"
- Ensure alert is set to "Once Per Bar Close"
- Check indicator is added to the chart
- Verify TradingView notification settings
---
## 📚 Version History
**v1.0 (Current)**
- Initial release
- Multi-timeframe confluence system
- Dynamic risk management
- Real-time HUD dashboard
- Comprehensive alert system
- ATR trailing stops
- Break-even automation
---
## 🤝 Support & Feedback
If you find this indicator helpful:
- ⭐ Star the script on TradingView
- 💬 Share your results and feedback
- 🐛 Report bugs or suggest improvements
- 📖 Share with other traders
---
## 📖 Additional Resources
### Recommended Reading
- "The New Trading for a Living" by Dr. Alexander Elder
- "Swing Trading Using Multiple Timeframes" - Educational articles
- Risk management and position sizing guides
### Learn More About
- Multiple timeframe analysis
- EMA crossover strategies
- RSI divergence and zones
- ATR-based stops
- R-multiple profit management
---
## 📝 License
This indicator is provided as-is for personal trading use.
**Usage Rights**:
- ✅ Use for personal trading
- ✅ Modify for personal use
- ❌ Resell or redistribute
- ❌ Claim as original work
---
## 🎓 Quick Start Checklist
- Add indicator to TradingView chart
- Set your preferred timeframe (1H/4H/Daily)
- Configure HTF setting (one level higher)
- Review default parameters
- Set up entry alerts (HC LONG/SHORT)
- Set up TP and SL alerts
- Test on historical data
- Paper trade first
- Start with small position sizes
- Track your results
---
**Happy Trading! 📊💰**
*Remember: Discipline, patience, and risk management are the keys to long-term success.*

Heikin Ashi + Real Price OverlayHeikin-Ashi + Real Price Overlay
This indicator combines the smooth trend visualization of Heikin-Ashi candles with the true market price for precise execution.
Features:
Heikin-Ashi Candles: Provides a clear, smoothed view of market trends and momentum.
Real Close Price Overlay: Plots the actual closing price as a line on top of HA candles, ensuring accurate entry, exit, and stop placement.
Trend-Based Coloring: The real price line is colored according to HA trend (green for bullish, red for bearish), making trend bias instantly visible.
Lightweight and ideal for scalping, day trading, or any strategy where trend bias + exact price matters.
Use Case:
Use HA candles to identify market bias and momentum.
Use the real price line for precise entries, exits, and stop levels.
Perfect for traders who want the clarity of HA without sacrificing real price accuracy.

Hicham XAUUSD Key Levels PRO (1H / 4H + Psychological)🔑 XAUUSD Key Levels PRO | 1H / 4H Structure + Psychological Levels
This indicator is designed specifically for Gold (XAUUSD) traders who want clean, institutional-grade key levels without chart clutter.
It combines market structure levels with true psychological price levels used by institutions, making it ideal for scalping, intraday, and swing trading.
📌 Features
🔹 Market Structure Key Levels
Automatic 1H & 4H High / Low detection
Based on swing pivots (configurable strength)
Solid lines for clear structure visibility
🔹 Gold Psychological Levels (XAUUSD)
Major levels: every 500$ (strong institutional zones)
Medium levels: every 250$
Minor levels: every 10$
Dynamic levels around current price
No line spam, optimized performance
🔹 Visual Clarity
Solid / dashed / dotted line styles
Custom colors & line thickness
Optional price labels
Works perfectly on M1 → H4
🎯 Best Use Cases
Liquidity sweeps & reactions
Premium / discount zones
Stop-loss & take-profit placement
Confluence with BOS / CHoCH
London & New York sessions
⚙️ Fully Customizable
Toggle 1H / 4H levels
Adjust psychological level spacing
Enable / disable labels
Clean & lightweight (no lag)
⚠️ Notes
Optimized for XAUUSD (Gold)
Best results when combined with price action & structure
Not a trading signal indicator
If you want:
Session-based levels
Alerts on key levels
Smart Money Concepts integration
Feel free to comment or DM 👊
Happy trading 💛📈
UNDETECTED FX - 250 Pip LevelsIndicator Description – UNDETECTED FX: 250-Pip Psychological Levels
This indicator automatically plots major 250-pip psychological levels on XAUUSD and highlights the price zones around them. These levels act as strong reaction points where liquidity, reversals, and institutional activity commonly occur.
What the Indicator Does
✔ Plots every 250-pip level starting from a user-defined base (e.g., 4050 → 4075 → 4100 → 4125 → …)
✔ Each level is represented by a thick black horizontal line for maximum visual clarity
✔ Around every 250-pip level, the indicator draws a liquidity zone
Top of zone: +200 pips
Bottom of zone: –200 pips
(configured as ± zoneHalf in settings)
✔ Uses extend: both, so levels stretch across the entire chart and stay fixed, no matter how far you scroll
✔ Zones are filled with a customizable color for clear premium/discount visualization
✔ The indicator never repaints and requires no updates after drawing — all levels are fixed on their price coordinates
Why It’s Useful
🔹 Helps quickly identify institutional levels where gold often reacts
🔹 Acts as a framework for scalping, intraday trading, and swing bias
🔹 Makes it easy to spot liquidity sweeps, rejections, and premium/discount areas
🔹 Clearly shows market structure breaks around key psychological levels
🔹 Forces discipline by creating predefined, fixed levels for trading decisions
Best Use Case
XAUUSD scalpers
Intraday traders who rely on precision entries
Traders who use psychological levels, liquidity grabs, or smart-money concepts
Anyone wanting a clean, non-cluttered chart with high-impact levels only

Market Regime# MARKET REGIME IDENTIFICATION & TRADING SYSTEM
## Complete User Guide
---
## 📋 TABLE OF CONTENTS
1. (#overview)
2. (#regimes)
3. (#indicator-usage)
4. (#entry-signals)
5. (#exit-signals)
6. (#regime-strategies)
7. (#confluence)
8. (#backtesting)
9. (#optimization)
10. (#examples)
---
## OVERVIEW
### What This System Does
This is a **complete market regime identification and trading system** that:
1. **Identifies 6 distinct market regimes** automatically
2. **Adapts trading tactics** to each regime
3. **Provides high-probability entry signals** with confluence scoring
4. **Shows optimal exit points** for each trade
5. **Can be backtested** to validate performance
### Two Components Provided
1. **Indicator** (`market_regime_indicator.pine`)
- Visual regime identification
- Entry/exit signals on chart
- Dynamic support/resistance
- Info tables with live data
- Use for manual trading
2. **Strategy** (`market_regime_strategy.pine`)
- Fully automated backtestable version
- Same logic as indicator
- Position sizing and risk management
- Performance metrics
- Use for backtesting and automation
---
## THE 6 MARKET REGIMES
### 1. 🟢 BULL TRENDING
**Characteristics:**
- Strong uptrend
- Price above SMA50 and SMA200
- ADX > 25 (strong trend)
- Higher highs and higher lows
- DI+ > DI- (bullish momentum)
**What It Means:**
- Market has clear upward direction
- Buyers in control
- Pullbacks are buying opportunities
- Strongest regime for long positions
**How to Trade:**
- ✅ **BUY dips to EMA20 or SMA20**
- ✅ Enter when RSI < 60 on pullback
- ✅ Hold through minor corrections
- ❌ Don't short against the trend
- ❌ Don't sell too early
**Expected Behavior:**
- Pullbacks are shallow (5-10%)
- Bounces are strong
- Support at moving averages holds
- Volume increases on rallies
---
### 2. 🔴 BEAR TRENDING
**Characteristics:**
- Strong downtrend
- Price below SMA50 and SMA200
- ADX > 25 (strong trend)
- Lower highs and lower lows
- DI- > DI+ (bearish momentum)
**What It Means:**
- Market has clear downward direction
- Sellers in control
- Rallies are selling opportunities
- Strongest regime for short positions
**How to Trade:**
- ✅ **SELL rallies to EMA20 or SMA20**
- ✅ Enter when RSI > 40 on bounce
- ✅ Hold through minor bounces
- ❌ Don't buy against the trend
- ❌ Don't cover shorts too early
**Expected Behavior:**
- Rallies are weak (5-10%)
- Selloffs are strong
- Resistance at moving averages holds
- Volume increases on declines
---
### 3. 🔵 BULL RANGING
**Characteristics:**
- Bullish bias but consolidating
- Price near or above SMA50
- ADX < 20 (weak trend)
- Trading in range
- Choppy price action
**What It Means:**
- Uptrend is pausing
- Accumulation phase
- Support and resistance zones clear
- Lower volatility
**How to Trade:**
- ✅ **BUY at support zone**
- ✅ Enter when RSI < 40
- ✅ Take profits at resistance
- ⚠️ Smaller position sizes
- ⚠️ Tighter stops
**Expected Behavior:**
- Range-bound oscillations
- Support bounces repeatedly
- Resistance rejections common
- Eventually breaks higher (usually)
---
### 4. 🟠 BEAR RANGING
**Characteristics:**
- Bearish bias but consolidating
- Price near or below SMA50
- ADX < 20 (weak trend)
- Trading in range
- Choppy price action
**What It Means:**
- Downtrend is pausing
- Distribution phase
- Support and resistance zones clear
- Lower volatility
**How to Trade:**
- ✅ **SELL at resistance zone**
- ✅ Enter when RSI > 60
- ✅ Take profits at support
- ⚠️ Smaller position sizes
- ⚠️ Tighter stops
**Expected Behavior:**
- Range-bound oscillations
- Resistance holds repeatedly
- Support bounces are weak
- Eventually breaks lower (usually)
---
### 5. ⚪ CONSOLIDATION
**Characteristics:**
- No clear direction
- Range compression
- Very low ADX (< 15 often)
- Price inside tight range
- Neutral sentiment
**What It Means:**
- Market is coiling
- Building energy for next move
- Indecision between buyers/sellers
- Calm before the storm
**How to Trade:**
- ✅ **WAIT for breakout direction**
- ✅ Enter on high-volume breakout
- ✅ Direction becomes clear
- ❌ Don't trade inside the range
- ❌ Avoid choppy scalping
**Expected Behavior:**
- Narrow range
- Low volume
- False breakouts possible
- Explosive move when it breaks
---
### 6. 🟣 CHAOS (High Volatility)
**Characteristics:**
- Extreme volatility
- No clear direction
- Erratic price swings
- ATR > 2x average
- Unpredictable
**What It Means:**
- Market panic or euphoria
- News-driven moves
- Emotion dominates logic
- Highest risk environment
**How to Trade:**
- ❌ **STAY OUT!**
- ❌ No positions
- ❌ Wait for stability
- ✅ Protect existing positions
- ✅ Reduce risk
**Expected Behavior:**
- Large intraday swings
- Gaps up/down
- Stop hunts
- Whipsaws
- Eventually calms down
---
## INDICATOR USAGE
### Visual Elements
#### 1. Background Colors
- **Light Green** = Bull Trending (go long)
- **Light Red** = Bear Trending (go short)
- **Light Teal** = Bull Ranging (buy dips)
- **Light Orange** = Bear Ranging (sell rallies)
- **Light Gray** = Consolidation (wait)
- **Purple** = Chaos (stay out!)
#### 2. Regime Labels
- Appear when regime changes
- Show new regime name
- Positioned at highs (bullish) or lows (bearish)
#### 3. Entry Signals
- **Green "LONG"** labels = Buy here
- **Red "SHORT"** labels = Sell here
- Number shows confluence score (X/5 signals)
- Hover for details (stop, target, RSI, etc.)
#### 4. Exit Signals
- **Orange "EXIT LONG"** = Close long position
- **Orange "EXIT SHORT"** = Close short position
- Shows exit reason in tooltip
#### 5. Support/Resistance Lines
- **Green line** = Dynamic support (buy zone)
- **Red line** = Dynamic resistance (sell zone)
- Adapts to regime automatically
#### 6. Moving Averages
- **Blue** = SMA 20 (short-term trend)
- **Orange** = SMA 50 (medium-term trend)
- **Purple** = SMA 200 (long-term trend)
### Information Tables
#### Top Right Table (Main Info)
Shows real-time market conditions:
- **Current Regime** - What regime we're in
- **Bias** - Long, Short, Breakout, or Stay Out
- **ADX** - Trend strength (>25 = strong)
- **Trend** - Strong, Moderate, or Weak
- **Volatility** - High or Normal
- **Vol Ratio** - Current vs average volatility
- **RSI** - Momentum (>70 overbought, <30 oversold)
- **vs SMA50/200** - Price position relative to MAs
- **Support/Resistance** - Exact price levels
- **Long/Short Signals** - Confluence scores (X/5)
#### Bottom Right Table (Regime Guide)
Quick reference for each regime:
- What action to take
- What strategy to use
- Color-coded for quick identification
---
## ENTRY SIGNALS EXPLAINED
### Confluence Scoring System (5 Factors)
Each entry signal is scored 0-5 based on how many factors align:
#### For LONG Entries:
1. ✅ **Regime Alignment** - In Bull Trending or Bull Ranging
2. ✅ **RSI Pullback** - RSI between 35-50 (not overbought)
3. ✅ **Near Support** - Price within 2% of dynamic support
4. ✅ **MACD Turning Up** - Momentum shifting bullish
5. ✅ **Volume Confirmation** - Above average volume
#### For SHORT Entries:
1. ✅ **Regime Alignment** - In Bear Trending or Bear Ranging
2. ✅ **RSI Rejection** - RSI between 50-65 (not oversold)
3. ✅ **Near Resistance** - Price within 2% of dynamic resistance
4. ✅ **MACD Turning Down** - Momentum shifting bearish
5. ✅ **Volume Confirmation** - Above average volume
### Confluence Requirements
**Minimum Confluence** (default = 2):
- 2/5 = Entry signal triggered
- 3/5 = Good signal
- 4/5 = Strong signal
- 5/5 = Excellent signal (rare)
**Higher confluence = Higher probability = Better trades**
### Specific Entry Patterns
#### 1. Bull Trending Entry
```
Requirements:
- Regime = Bull Trending
- Price pulls back to EMA20
- Close above EMA20 (bounce)
- Up candle (close > open)
- RSI < 60
- Confluence ≥ 2
```
#### 2. Bear Trending Entry
```
Requirements:
- Regime = Bear Trending
- Price rallies to EMA20
- Close below EMA20 (rejection)
- Down candle (close < open)
- RSI > 40
- Confluence ≥ 2
```
#### 3. Bull Ranging Entry
```
Requirements:
- Regime = Bull Ranging
- RSI < 40 (oversold)
- Price at or below support
- Up candle (reversal)
- Confluence ≥ 1 (more lenient)
```
#### 4. Bear Ranging Entry
```
Requirements:
- Regime = Bear Ranging
- RSI > 60 (overbought)
- Price at or above resistance
- Down candle (rejection)
- Confluence ≥ 1 (more lenient)
```
#### 5. Consolidation Breakout
```
Requirements:
- Regime = Consolidation
- Price breaks above/below range
- Volume > 1.5x average (explosive)
- Strong directional candle
```
---
## EXIT SIGNALS EXPLAINED
### Three Types of Exits
#### 1. Regime Change Exits (Automatic)
- **Long Exit**: Regime changes to Bear Trending or Chaos
- **Short Exit**: Regime changes to Bull Trending or Chaos
- **Reason**: Market character changed, strategy no longer valid
#### 2. Support/Resistance Break Exits
- **Long Exit**: Price breaks below support by 2%
- **Short Exit**: Price breaks above resistance by 2%
- **Reason**: Key level violated, trend may be reversing
#### 3. Momentum Exits
- **Long Exit**: RSI > 70 (overbought) AND down candle
- **Short Exit**: RSI < 30 (oversold) AND up candle
- **Reason**: Overextension, take profits
### Stop Loss & Take Profit
**Stop Loss** (Automatic in strategy):
- Placed at Entry - (ATR × 2)
- Adapts to volatility
- Protected from whipsaws
- Typically 2-4% for stocks, 5-10% for crypto
**Take Profit** (Automatic in strategy):
- Placed at Entry + (Stop Distance × R:R Ratio)
- Default 2.5:1 reward:risk
- Example: $2 risk = $5 reward target
- Allows winners to run
---
## TRADING EACH REGIME
### BULL TRENDING - Most Profitable Long Environment
**Strategy: Buy Every Dip**
**Entry Rules:**
1. Wait for pullback to EMA20 or SMA20
2. Look for RSI < 60
3. Enter when candle closes above MA
4. Confluence should be 2+
**Stop Loss:**
- Below the recent swing low
- Or 2 × ATR below entry
**Take Profit:**
- At previous high
- Or 2.5:1 R:R minimum
**Position Size:**
- Can use full size (2% risk)
- High win rate regime
**Example Trade:**
```
Price: $100, pulls back to $98 (EMA20)
Entry: $98.50 (close above EMA)
Stop: $96.50 (2 ATR)
Target: $103.50 (2.5:1)
Risk: $2, Reward: $5
```
---
### BEAR TRENDING - Most Profitable Short Environment
**Strategy: Sell Every Rally**
**Entry Rules:**
1. Wait for bounce to EMA20 or SMA20
2. Look for RSI > 40
3. Enter when candle closes below MA
4. Confluence should be 2+
**Stop Loss:**
- Above the recent swing high
- Or 2 × ATR above entry
**Take Profit:**
- At previous low
- Or 2.5:1 R:R minimum
**Position Size:**
- Can use full size (2% risk)
- High win rate regime
**Example Trade:**
```
Price: $100, rallies to $102 (EMA20)
Entry: $101.50 (close below EMA)
Stop: $103.50 (2 ATR)
Target: $96.50 (2.5:1)
Risk: $2, Reward: $5
```
---
### BULL RANGING - Buy Low, Sell High
**Strategy: Range Trading (Long Bias)**
**Entry Rules:**
1. Wait for price at support zone
2. Look for RSI < 40
3. Enter on reversal candle
4. Confluence should be 1-2+
**Stop Loss:**
- Below support zone
- Tighter than trending (1.5 ATR)
**Take Profit:**
- At resistance zone
- Don't hold through resistance
**Position Size:**
- Reduce to 1-1.5% risk
- Lower win rate than trending
**Example Trade:**
```
Range: $95-$105
Entry: $96 (at support, RSI 35)
Stop: $94 (below support)
Target: $104 (at resistance)
Risk: $2, Reward: $8 (4:1)
```
---
### BEAR RANGING - Sell High, Buy Low
**Strategy: Range Trading (Short Bias)**
**Entry Rules:**
1. Wait for price at resistance zone
2. Look for RSI > 60
3. Enter on rejection candle
4. Confluence should be 1-2+
**Stop Loss:**
- Above resistance zone
- Tighter than trending (1.5 ATR)
**Take Profit:**
- At support zone
- Don't hold through support
**Position Size:**
- Reduce to 1-1.5% risk
- Lower win rate than trending
**Example Trade:**
```
Range: $95-$105
Entry: $104 (at resistance, RSI 65)
Stop: $106 (above resistance)
Target: $96 (at support)
Risk: $2, Reward: $8 (4:1)
```
---
### CONSOLIDATION - Wait for Breakout
**Strategy: Breakout Trading**
**Entry Rules:**
1. Identify consolidation range
2. Wait for VOLUME SURGE (1.5x+ avg)
3. Enter on close outside range
4. Direction must be clear
**Stop Loss:**
- Opposite side of range
- Or 2 ATR
**Take Profit:**
- Measure range height, project it
- Example: $10 range = $10 move expected
**Position Size:**
- Reduce to 1% risk
- 50% false breakout rate
**Example Trade:**
```
Consolidation: $98-$102 (4-point range)
Breakout: $102.50 (high volume)
Entry: $103
Stop: $100 (back in range)
Target: $107 (4-point range projected)
Risk: $3, Reward: $4
```
---
### CHAOS - STAY OUT!
**Strategy: Preservation**
**What to Do:**
- ❌ NO new positions
- ✅ Close existing positions if near entry
- ✅ Tighten stops on profitable trades
- ✅ Reduce position sizes dramatically
- ✅ Wait for regime to stabilize
**Why It's Dangerous:**
- Stop hunts are common
- Whipsaws everywhere
- News-driven volatility
- No technical reliability
- Even "perfect" setups fail
**When Does It End:**
- Volatility ratio drops < 1.5
- ADX starts rising (direction appears)
- Price respects support/resistance again
- Usually 1-5 days
---
## CONFLUENCE SYSTEM
### How It Works
The system scores each potential entry on 5 factors. More factors aligning = higher probability.
### Confluence Requirements by Regime
**Trending Regimes** (strictest):
- Minimum 2/5 required
- 3/5 = Good
- 4-5/5 = Excellent
**Ranging Regimes** (moderate):
- Minimum 1-2/5 required
- 2/5 = Good
- 3+/5 = Excellent
**Consolidation** (breakout only):
- Volume is most critical
- Direction confirmation
- Less confluence needed
### Adjusting Minimum Confluence
**If too few signals:**
- Lower from 2 to 1
- More trades, lower quality
**If too many false signals:**
- Raise from 2 to 3
- Fewer trades, higher quality
**Recommendation:**
- Start at 2
- Adjust based on win rate
- Aim for 55-65% win rate
---
## STRATEGY BACKTESTING
### Loading the Strategy
1. Copy `market_regime_strategy.pine`
2. Open Pine Editor in TradingView
3. Paste and "Add to Chart"
4. Strategy Tester tab opens at bottom
### Initial Settings
```
Risk Per Trade: 2%
ATR Stop Multiplier: 2.0
Reward:Risk Ratio: 2.5
Trade Longs: ✓
Trade Shorts: ✓
Trade Trending Only: ✗ (test both)
Avoid Chaos: ✓
Minimum Confluence: 2
```
### What to Look For
**Good Results:**
- Win Rate: 50-60%
- Profit Factor: 1.8-2.5
- Net Profit: Positive
- Max Drawdown: <20%
- Consistent equity curve
**Warning Signs:**
- Win Rate: <45% (too many losses)
- Profit Factor: <1.5 (barely profitable)
- Max Drawdown: >30% (too risky)
- Erratic equity curve (unstable)
### Testing Different Regimes
**Test 1: Trending Only**
```
Trade Trending Only: ✓
Result: Higher win rate, fewer trades
```
**Test 2: All Regimes**
```
Trade Trending Only: ✗
Result: More trades, potentially lower win rate
```
**Test 3: Long Only**
```
Trade Longs: ✓
Trade Shorts: ✗
Result: Works in bull markets
```
**Test 4: Short Only**
```
Trade Longs: ✗
Trade Shorts: ✓
Result: Works in bear markets
```
---
## SETTINGS OPTIMIZATION
### Key Parameters to Adjust
#### 1. Risk Per Trade (Most Important)
- **0.5%** = Very conservative
- **1.0%** = Conservative (recommended for beginners)
- **2.0%** = Moderate (recommended)
- **3.0%** = Aggressive
- **5.0%** = Very aggressive (not recommended)
**Impact:** Higher risk = higher returns BUT bigger drawdowns
#### 2. Reward:Risk Ratio
- **2:1** = More wins needed, hit target faster
- **2.5:1** = Balanced (recommended)
- **3:1** = Fewer wins needed, hold longer
- **4:1** = Very patient, best in trending
**Impact:** Higher R:R = can have lower win rate
#### 3. Minimum Confluence
- **1** = More signals, lower quality
- **2** = Balanced (recommended)
- **3** = Fewer signals, higher quality
- **4** = Very selective
- **5** = Almost never triggers
**Impact:** Higher = fewer but better trades
#### 4. ADX Thresholds
- **Trending: 20-30** (default 25)
- Lower = detect trends earlier
- Higher = only strong trends
- **Ranging: 15-25** (default 20)
- Lower = identify ranging earlier
- Higher = only weak trends
#### 5. Trend Period (SMA)
- **20-50** = Short-term trends
- **50** = Medium-term (default, recommended)
- **100-200** = Long-term trends
**Impact:** Longer period = slower regime changes, more stable
### Optimization Workflow
**Step 1: Baseline**
- Use all default settings
- Test on 3+ years
- Record: Win Rate, PF, Drawdown
**Step 2: Risk Optimization**
- Test 1%, 1.5%, 2%, 2.5%
- Find best risk-adjusted return
- Balance profit vs drawdown
**Step 3: R:R Optimization**
- Test 2:1, 2.5:1, 3:1
- Check which maximizes profit factor
- Consider holding time
**Step 4: Confluence Optimization**
- Test 1, 2, 3
- Find sweet spot for win rate
- Aim for 55-65% win rate
**Step 5: Regime Filter**
- Test with/without trend filter
- Test with/without chaos filter
- Find what works for your asset
---
## REAL TRADING EXAMPLES
### Example 1: Bull Trending - SPY
**Setup:**
- Regime: BULL TRENDING
- Price pulls back from $450 to $445
- EMA20 at $444
- RSI drops to 45
- Confluence: 4/5
**Entry:**
- Price closes at $445.50 (above EMA20)
- LONG signal appears
- Enter at $445.50
**Risk Management:**
- Stop: $443 (2 ATR = $2.50)
- Target: $451.75 (2.5:1 = $6.25)
- Risk: $2.50 per share
- Position: 80 shares (2% of $10k = $200 risk)
**Outcome:**
- Price rallies to $452 in 3 days
- Target hit
- Profit: $6.50 × 80 = $520
- Return: 2.6 × risk (excellent)
---
### Example 2: Bear Ranging - AAPL
**Setup:**
- Regime: BEAR RANGING
- Range: $165-$175
- Price rallies to $174
- Resistance at $175
- RSI at 68
- Confluence: 3/5
**Entry:**
- Rejection candle at $174
- SHORT signal appears
- Enter at $173.50
**Risk Management:**
- Stop: $176 (above resistance)
- Target: $166 (support)
- Risk: $2.50
- Position: 80 shares
**Outcome:**
- Price drops to $167 in 2 days
- Target hit
- Profit: $6.50 × 80 = $520
- Return: 2.6 × risk
---
### Example 3: Consolidation Breakout - BTC
**Setup:**
- Regime: CONSOLIDATION
- Range: $28,000 - $30,000
- Compressed for 2 weeks
- Volume declining
**Breakout:**
- Price breaks $30,000
- Volume surges 200%
- Close at $30,500
- LONG signal
**Entry:**
- Enter at $30,500
**Risk Management:**
- Stop: $29,500 (back in range)
- Target: $32,000 (range height = $2k)
- Risk: $1,000
- Position: 0.2 BTC ($200 risk on $10k)
**Outcome:**
- Price runs to $33,000
- Target exceeded
- Profit: $2,500 × 0.2 = $500
- Return: 2.5 × risk
---
### Example 4: Avoiding Chaos - Tesla
**Setup:**
- Regime: BULL TRENDING
- LONG position from $240
- Elon tweets something crazy
- Regime changes to CHAOS
**Action:**
- EXIT signal appears
- Close position immediately
- Current price: $242 (small profit)
**Outcome:**
- Next 3 days: wild swings
- High $255, Low $230
- By staying out, avoided:
- Potential stop out
- Whipsaw losses
- Stress
**Result:**
- Small profit preserved
- Capital protected
- Re-enter when regime stabilizes
---
## ALERTS SETUP
### Available Alerts
1. **Bull Trending Regime** - Market goes bullish
2. **Bear Trending Regime** - Market goes bearish
3. **Chaos Regime** - High volatility, stay out
4. **Long Entry Signal** - Buy opportunity
5. **Short Entry Signal** - Sell opportunity
6. **Long Exit Signal** - Close long
7. **Short Exit Signal** - Close short
### How to Set Up
1. Click **⏰ (Alert)** icon in TradingView
2. Select **Condition**: Choose indicator + alert type
3. **Options**: Popup, Email, Webhook, etc.
4. **Message**: Customize notification
5. Click **Create**
### Recommended Alert Strategy
**For Active Traders:**
- Long Entry Signal
- Short Entry Signal
- Long Exit Signal
- Short Exit Signal
**For Position Traders:**
- Bull Trending Regime (enter longs)
- Bear Trending Regime (enter shorts)
- Chaos Regime (exit all)
**For Conservative:**
- Only regime change alerts
- Manually review entries
- More selective
---
## TIPS FOR SUCCESS
### 1. Start Small
- Paper trade first
- Then 0.5% risk
- Build to 1-2% over time
### 2. Follow the Regime
- Don't fight it
- Adapt your style
- Different tactics for each
### 3. Trust the Confluence
- 4-5/5 = Best trades
- 2-3/5 = Good trades
- 1/5 = Skip unless desperate
### 4. Respect Exits
- Don't hope and hold
- Cut losses quickly
- Take profits at targets
### 5. Avoid Chaos
- Seriously, just stay out
- Protect your capital
- Wait for clarity
### 6. Keep a Journal
- Record every trade
- Note regime and confluence
- Review weekly
- Learn patterns
### 7. Backtest Thoroughly
- 3+ years minimum
- Multiple market conditions
- Different assets
- Walk-forward test
### 8. Be Patient
- Best setups are rare
- 1-3 trades per week is normal
- Quality over quantity
- Compound over time
---
## COMMON QUESTIONS
**Q: How many trades per month should I expect?**
A: Depends on timeframe and settings. Daily chart: 5-15 trades/month. 4H chart: 15-30 trades/month.
**Q: What's a good win rate?**
A: 55-65% is excellent. 50-55% is good. Below 50% needs adjustment.
**Q: Should I trade all regimes?**
A: Beginners: Only trending. Intermediate: Trending + ranging. Advanced: All except chaos.
**Q: Can I use this on any timeframe?**
A: Best on Daily and 4H. Works on 1H with more noise. Not recommended <1H.
**Q: What if I'm in a trade and regime changes?**
A: Exit immediately (if using indicator) or let strategy handle it automatically.
**Q: How do I know if I'm over-optimizing?**
A: If results are perfect on one period but fail on another. Use walk-forward testing.
**Q: Should I always take 5/5 confluence trades?**
A: Yes, but they're rare (1-2/month). Don't wait only for these.
**Q: Can I combine this with other indicators?**
A: Yes, but keep it simple. RSI, MACD already included. Maybe add volume profile.
**Q: What assets work best?**
A: Liquid stocks, major crypto, futures. Avoid forex spot (use futures), penny stocks.
**Q: How long to hold positions?**
A: Trending: Days to weeks. Ranging: Hours to days. Breakout: Days. Let the regime guide you.
---
## FINAL THOUGHTS
This system gives you:
- ✅ Clear market context (regime)
- ✅ High-probability entries (confluence)
- ✅ Defined exits (automatic signals)
- ✅ Adaptable tactics (regime-specific)
- ✅ Backtestable results (strategy version)
**Success requires:**
- 📚 Understanding each regime
- 🎯 Following the signals
- 💪 Discipline to wait
- 🧠 Emotional control
- 📊 Proper risk management
**Start your journey:**
1. Load the indicator
2. Watch for 1 week (no trading)
3. Identify regime patterns
4. Paper trade for 1 month
5. Go live with small size
6. Scale up as you gain confidence
**Remember:** The market will always be here. There's no rush. Master one regime at a time, and you'll be profitable in all conditions!
Good luck! 🚀

Wyckoff Method - Comprehensive Analysis# WYCKOFF METHOD - QUICK REFERENCE CHEAT SHEET
## 🟢 STRONGEST BUY SIGNALS
### 1. SPRING ⭐⭐⭐⭐⭐
- **What:** False breakdown below support on LOW volume
- **Look for:** Quick reversal, close above support
- **Entry:** When price closes back in range
- **Stop:** Below spring low
- **Target:** Top of range minimum
### 2. SOS (Sign of Strength) ⭐⭐⭐⭐
- **What:** Breakout above resistance on HIGH volume
- **Look for:** Wide spread up bar, strong close
- **Entry:** On breakout or wait for LPS pullback
- **Stop:** Below range top
- **Target:** Height of range projected up
### 3. SHAKEOUT ⭐⭐⭐⭐
- **What:** Sharp move below support with HIGH volume, immediate reversal
- **Look for:** Long lower wick, closes strong
- **Entry:** When price reclaims support
- **Stop:** Below shakeout low
- **Target:** Previous resistance
---
## 🔴 STRONGEST SELL SIGNALS
### 1. UTAD (Upthrust After Distribution) ⭐⭐⭐⭐⭐
- **What:** False breakout above resistance, quick rejection
- **Look for:** Spike high, weak close, often high volume
- **Entry:** When price closes back in range
- **Stop:** Above UTAD high
- **Target:** Bottom of range minimum
### 2. SOW (Sign of Weakness) ⭐⭐⭐⭐
- **What:** Breakdown below support on HIGH volume
- **Look for:** Wide spread down bar, weak close
- **Entry:** On breakdown or wait for LPSY rally
- **Stop:** Above range bottom
- **Target:** Height of range projected down
### 3. UPTHRUST ⭐⭐⭐⭐
- **What:** Move above resistance on LOW volume, weak close
- **Look for:** Long upper wick, closes in lower half
- **Entry:** When resistance holds
- **Stop:** Above upthrust high
- **Target:** Support level
---
## 📊 ACCUMULATION PHASES (Bottom Formation)
```
PHASE A: Stopping the Downtrend
├─ PS (Preliminary Support) - First buying
├─ SC (Selling Climax) - Panic bottom ⚠️ KEY EVENT
├─ AR (Automatic Rally) - Relief bounce
└─ ST (Secondary Test) - Retest SC low
PHASE B: Building the Cause
├─ Trading range forms
├─ Multiple tests of support
├─ Volume decreasing
└─ Absorption occurring
PHASE C: The Test
├─ SPRING - False breakdown ⚠️ KEY EVENT
└─ TEST - Support holds on low volume
PHASE D: Dominance Emerges
├─ SOS - Breakout ⚠️ KEY EVENT
├─ LPS - Last Point of Support (pullback)
└─ BU - Backup
PHASE E: Markup
└─ New uptrend, strong momentum
```
**Background Color:** Blue → Green (getting brighter)
**Action:** Buy in Phase C/D, Hold through Phase E
---
## 📊 DISTRIBUTION PHASES (Top Formation)
```
PHASE A: Stopping the Uptrend
├─ PSY (Preliminary Supply) - First selling
├─ BC (Buying Climax) - Euphoric top ⚠️ KEY EVENT
├─ AR (Automatic Reaction) - Sharp drop
└─ ST (Secondary Test) - Retest BC high
PHASE B: Building the Cause
├─ Trading range forms
├─ Multiple tests of resistance
├─ Demand being absorbed
└─ Volume patterns change
PHASE C: The Test
└─ UTAD - False breakout ⚠️ KEY EVENT
PHASE D: Dominance Emerges
├─ SOW - Breakdown ⚠️ KEY EVENT
└─ LPSY - Last Point of Supply (rally to exit)
PHASE E: Markdown
└─ New downtrend, strong selling
```
**Background Color:** Orange → Red (getting darker)
**Action:** Sell in Phase C/D, Stay out during Phase E
---
## 💰 VOLUME SPREAD ANALYSIS (VSA)
| Signal | Meaning | Color | Implication |
|--------|---------|-------|-------------|
| **ND** (No Demand) | Up bar, LOW volume | 🟠 Orange | Weakness - uptrend ending |
| **NS** (No Supply) | Down bar, LOW volume | 🔵 Blue | Strength - downtrend ending |
| **SV** (Stopping Volume) | VERY HIGH volume, narrow spread | 🟣 Purple | Potential reversal |
| **UT** (Upthrust) | Above resistance, LOW vol, weak close | 🔴 Red | Sell signal |
| **SO** (Shakeout) | Below support, HIGH vol, strong close | 🟢 Green | Buy signal |
---
## 🎯 VOLUME INTERPRETATION
| Volume Level | Bar Color | Meaning |
|--------------|-----------|---------|
| **VERY HIGH** (>2x average) | Dark Green/Red | Climax, potential reversal |
| **HIGH** (>1.5x average) | Light Green/Red | Strong interest |
| **NORMAL** | Gray | Average trading |
| **LOW** (<0.7x average) | Faint Gray | Testing, no interest |
---
## ⚖️ EFFORT vs RESULT
| Scenario | Volume | Spread | Meaning |
|----------|--------|--------|---------|
| **High Effort, Low Result** | HIGH | Narrow | ⚠️ Potential reversal |
| **Low Effort, High Result** | LOW | Wide | ⚠️ Trend weakening |
| **High Effort, High Result** | HIGH | Wide | ✅ Strong trend |
| **Low Effort, Low Result** | LOW | Narrow | 😴 No interest |
---
## 📏 TRADING RULES
### ✅ DO:
- ✅ Wait for confirmation before entering
- ✅ Trade in direction of higher timeframe
- ✅ Use springs and UTAD as primary signals
- ✅ Measure trading range for targets
- ✅ Place stops outside the range
- ✅ Look for volume confirmation
- ✅ Check multiple timeframes
- ✅ Focus on Phase C and D events
### ❌ DON'T:
- ❌ Buy during Phase E Markdown
- ❌ Sell during Phase E Markup
- ❌ Trade against major trend
- ❌ Ignore volume signals
- ❌ Enter without clear stop loss
- ❌ Trade every signal
- ❌ Use on very low timeframes without practice
- ❌ Ignore the context
---
## 🎪 COMPOSITE OPERATOR (Smart Money)
### 💰 Green Money Symbol (Bottom)
- **Meaning:** Institutions accumulating
- **Location:** Demand zones, springs, tests
- **Action:** Follow the smart money - buy
### 💰 Red Money Symbol (Top)
- **Meaning:** Institutions distributing
- **Location:** Supply zones, UTAD, weak rallies
- **Action:** Follow the smart money - sell
---
## 📍 SUPPLY & DEMAND ZONES
### 🟢 Demand Zones (Green Boxes)
- **Created at:** SC, Spring, Shakeout
- **Represents:** Where smart money bought
- **Action:** Look for bounces
### 🔴 Supply Zones (Red Boxes)
- **Created at:** BC, UTAD, Upthrust
- **Represents:** Where smart money sold
- **Action:** Look for rejections
---
## 🎯 TARGET CALCULATION
### Measured Move Method
```
1. Measure trading range height
Example: Top at 120, Bottom at 100 = 20 points
2. Add to breakout point (accumulation)
Breakout at 120 + 20 = Target: 140
3. Or subtract from breakdown (distribution)
Breakdown at 100 - 20 = Target: 80
```
### Multiple Targets
- **Conservative:** 1x range height (100% probability reached)
- **Moderate:** 1.5x range height (70% probability)
- **Aggressive:** 2x range height (40% probability)
---
## ⏰ TIMEFRAME GUIDE
| Timeframe | Use For | Reliability | Recommended For |
|-----------|---------|-------------|-----------------|
| **Weekly** | Major trends | ⭐⭐⭐⭐⭐ | Position traders |
| **Daily** | Swing trades | ⭐⭐⭐⭐⭐ | Most traders |
| **4-Hour** | Active swing | ⭐⭐⭐⭐ | Active traders |
| **1-Hour** | Day trading | ⭐⭐⭐ | Experienced only |
| **15-Min** | Scalping | ⭐⭐ | Experts only |
**Golden Rule:** Always check one timeframe higher for context!
---
## 🚨 ALERT PRIORITY
### 🔔 MUST-HAVE ALERTS
1. Spring
2. UTAD
3. SOS
4. SOW
### 🔔 NICE-TO-HAVE ALERTS
5. Selling Climax (SC)
6. Buying Climax (BC)
7. Smart Money Accumulation
8. Smart Money Distribution
### 🔔 CONFIRMATION ALERTS
9. Phase E Markup
10. Phase E Markdown
---
## 💡 QUICK DECISION TREE
```
Is there a clear trading range?
├─ YES
│ ├─ Did price break BELOW support?
│ │ ├─ Volume LOW + Quick reversal = SPRING → BUY ✅
│ │ └─ Volume HIGH + Stays down = Breakdown → SELL ⚠️
│ │
│ └─ Did price break ABOVE resistance?
│ ├─ Volume LOW + Quick reversal = UTAD → SELL ✅
│ └─ Volume HIGH + Stays up = Breakout → BUY ⚠️
│
└─ NO
├─ Strong uptrend = Wait for re-accumulation
└─ Strong downtrend = Wait for re-distribution
```
---
## 📝 PRE-TRADE CHECKLIST
Before entering any trade:
- Identified the current Wyckoff phase
- Confirmed with volume analysis
- Checked higher timeframe trend
- Located supply/demand zones
- Identified clear entry point
- Set stop loss level
- Calculated target (risk:reward >1:2)
- Verified position size (risk 1-2%)
- Have at least 2 confirming signals
- Not trading against major trend
---
## 🧠 REMEMBER
**The Three Laws:**
1. **Supply & Demand** - Price is determined by imbalance
2. **Cause & Effect** - Range size predicts move size
3. **Effort & Result** - Volume should confirm price movement
**The Key Principle:**
> "Trade with the Composite Operator (smart money), not against them"
**Best Setups:**
1. Spring in accumulation (Phase C)
2. UTAD in distribution (Phase C)
3. SOS breakout (Phase D)
4. SOW breakdown (Phase D)
**When in Doubt:**
- ❓ Stay out
- 📈 Use higher timeframe
- 📚 Review the documentation
- 🎯 Wait for clearer signal
---
## 📱 INDICATOR SETTINGS QUICK SETUP
**For Stocks/Crypto (Good Volume Data):**
- Volume MA Length: 20
- High Volume Multiplier: 1.5
- Climax Volume: 2.0
- Swing Length: 5
**For Forex (Limited Volume Data):**
- Volume MA Length: 20
- High Volume Multiplier: 1.3
- Climax Volume: 1.8
- Swing Length: 7
- Turn OFF "Volume Confirmation"
**For Day Trading:**
- Swing Length: 3
- All other settings: Default
**For Position Trading:**
- Swing Length: 7-10
- Volume MA Length: 30
- Use Daily/Weekly charts
---
## 🎓 SKILL PROGRESSION
### Beginner (Month 1-2)
- Focus on: SC, Spring, SOS
- Timeframe: Daily only
- Goal: Identify phases correctly
### Intermediate (Month 3-6)
- Add: All accumulation events
- Timeframe: Daily + 4H
- Goal: Trade springs profitably
### Advanced (Month 6-12)
- Add: Distribution events, VSA
- Timeframe: Multiple timeframes
- Goal: Trade complete cycles
### Expert (Year 2+)
- Master: All events, all timeframes
- Combine: With other methodologies
- Goal: Consistent profitability
---
**Print this sheet and keep it next to your trading desk!**
*Remember: Quality over quantity. Wait for the best setups.*
# Wyckoff Method - Comprehensive Analysis Indicator
## Complete Implementation Guide for TradingView Pine Script
---
## TABLE OF CONTENTS
1. (#overview)
2. (#installation)
3. (#theory)
4. (#components)
5. (#signals)
6. (#strategies)
7. (#settings)
8. (#alerts)
9. (#patterns)
10. (#troubleshooting)
---
## OVERVIEW
This indicator implements Richard Wyckoff's complete trading methodology, including:
- **All 5 Phases** of Accumulation and Distribution
- **18+ Wyckoff Events** (PS, SC, AR, ST, Spring, SOS, LPS, BC, UTAD, SOW, etc.)
- **Volume Spread Analysis (VSA)** principles
- **Supply & Demand Zone** detection
- **Composite Operator** logic (Smart Money tracking)
- **Effort vs Result** analysis
- **Three Wyckoff Laws**: Supply/Demand, Cause/Effect, Effort/Result
---
## INSTALLATION
### Step 1: Copy the Code
1. Open the `wyckoff_comprehensive.pine` file
2. Select all code (Ctrl+A / Cmd+A)
3. Copy to clipboard (Ctrl+C / Cmd+C)
### Step 2: Add to TradingView
1. Go to TradingView.com
2. Open any chart
3. Click "Pine Editor" at the bottom of the screen
4. Click "New" or "Open"
5. Paste the entire code
6. Click "Save" and give it a name
7. Click "Add to Chart"
### Step 3: Verify Installation
You should see:
- Labels on the chart (PS, SC, Spring, SOS, etc.)
- Background colors indicating phases
- Volume analysis in the lower pane
- A table in the top-right corner showing current phase
---
## WYCKOFF METHOD THEORY
### The Three Fundamental Laws
#### 1. **Law of Supply and Demand**
- Price rises when demand exceeds supply
- Price falls when supply exceeds demand
- The indicator tracks volume vs price movement to identify imbalances
#### 2. **Law of Cause and Effect**
- A period of accumulation (cause) leads to markup (effect)
- A period of distribution (cause) leads to markdown (effect)
- Trading ranges build "cause" for future price movement
#### 3. **Law of Effort vs Result**
- **Effort** = Volume (energy put into the market)
- **Result** = Price movement (spread of the bar)
- High effort with low result = potential reversal
- Low effort with high result = trend weakness
### The Five Phases
#### **ACCUMULATION CYCLE**
**Phase A: Stopping the Downtrend**
- Preliminary Support (PS): First sign of buying
- Selling Climax (SC): Panic selling exhaustion
- Automatic Rally (AR): Bounce from SC
- Secondary Test (ST): Test of SC low on lower volume
**Phase B: Building the Cause**
- Trading range develops
- Supply being absorbed by composite operator
- Multiple tests of support and resistance
- Volume generally decreases
**Phase C: The Test (Spring)**
- False breakdown below support
- Traps late sellers
- Quick reversal on low volume
- Last chance to accumulate before markup
**Phase D: Dominance Emerges**
- Sign of Strength (SOS): Break above resistance
- Last Point of Support (LPS): Pullback opportunity
- Backup (BU): Final consolidation
- Demand clearly exceeds supply
**Phase E: Markup**
- New uptrend established
- Price moves rapidly higher
- Phase E can last months/years
- Original trading range becomes support
#### **DISTRIBUTION CYCLE**
**Phase A: Stopping the Uptrend**
- Preliminary Supply (PSY): First sign of selling
- Buying Climax (BC): Euphoric buying exhaustion
- Automatic Reaction (AR): Sharp selloff from BC
- Secondary Test (ST): Test of BC high on lower volume
**Phase B: Building the Cause**
- Trading range at top
- Demand being absorbed by composite operator
- Multiple tests of support and resistance
**Phase C: The Test (UTAD)**
- Upthrust After Distribution
- False breakout above resistance
- Traps late buyers
- Quick reversal
**Phase D: Dominance Emerges**
- Sign of Weakness (SOW): Break below support
- Last Point of Supply (LPSY): Rally opportunity to exit
- Supply clearly exceeds demand
**Phase E: Markdown**
- New downtrend established
- Price moves rapidly lower
- Original trading range becomes resistance
---
## INDICATOR COMPONENTS
### 1. EVENT LABELS
#### Accumulation Events (Green labels)
- **PS** = Preliminary Support
- **SC** = Selling Climax (largest label, most important)
- **AR** = Automatic Rally
- **ST** = Secondary Test
- **SPRING** = Spring (critical buy signal)
- **TEST** = Test of support
- **SOS** = Sign of Strength (breakout)
- **LPS** = Last Point of Support
- **BU** = Backup
#### Distribution Events (Red labels)
- **PSY** = Preliminary Supply
- **BC** = Buying Climax (largest label, most important)
- **AR** = Automatic Reaction
- **ST** = Secondary Test
- **UTAD** = Upthrust After Distribution (critical sell signal)
- **SOW** = Sign of Weakness
- **LPSY** = Last Point of Supply
#### VSA Events (Small colored labels)
- **ND** (Orange) = No Demand - weakness
- **NS** (Blue) = No Supply - strength
- **SV** (Purple) = Stopping Volume
- **UT** (Red) = Upthrust - weakness
- **SO** (Green) = Shakeout - strength
#### Composite Operator (💰 symbols)
- Green 💰 at bottom = Smart Money Accumulation
- Red 💰 at top = Smart Money Distribution
### 2. BACKGROUND COLORS
- **Light Blue** = Phase A (Accumulation)
- **Light Orange** = Phase A (Distribution)
- **Very Light Green** = Phase C (Accumulation Testing)
- **Very Light Red** = Phase C (Distribution Testing)
- **Light Green** = Phase D (Accumulation Strength)
- **Light Red** = Phase D (Distribution Weakness)
- **Green** = Phase E (Markup - Bull trend)
- **Red** = Phase E (Markdown - Bear trend)
### 3. SUPPLY & DEMAND ZONES
- **Green boxes** = Demand zones (where smart money accumulated)
- **Red boxes** = Supply zones (where smart money distributed)
- Zones extend 20 bars into the future
- Price reactions at these zones are significant
### 4. VOLUME PANEL
- **Dark Green/Red bars** = Very High Volume (climax)
- **Light Green/Red bars** = High Volume
- **Gray bars** = Normal Volume
- **Faint Gray bars** = Low Volume
- **Blue line** = Volume Moving Average
### 5. INFORMATION TABLE (Top Right)
Displays real-time analysis:
- **Current Phase** (A, B, C, D, or E)
- **Status** (description of what's happening)
- **Volume** (Very High, High, Normal, Low)
- **Spread** (Wide, Normal, Narrow)
- **Effort/Result** (Poor, Normal, Good)
- **Range** (YES if in trading range)
- **Bias** (BULLISH, BEARISH, or NEUTRAL)
---
## HOW TO READ THE SIGNALS
### STRONG BUY SIGNALS (in order of strength)
1. **SPRING** (strongest)
- False breakdown below support
- Look for: Low volume, quick reversal, close above support
- Entry: When price closes back above support level
- Stop: Below the spring low
2. **SOS (Sign of Strength)**
- Break above trading range resistance
- Look for: High volume, wide spread up bar
- Entry: On breakout or pullback to LPS
- Stop: Below trading range
3. **Shakeout (SO)**
- Similar to spring but more violent
- Look for: High volume, penetration of support, strong close
- Entry: When price reclaims support
- Stop: Below shakeout low
4. **LPS (Last Point of Support)**
- Pullback after SOS
- Look for: Low volume, shallow pullback
- Entry: When support holds
- Stop: Below LPS
5. **No Supply (NS)**
- Down bar on very low volume
- Indicates lack of selling pressure
- Confirms accumulation phase
### STRONG SELL SIGNALS (in order of strength)
1. **UTAD (Upthrust After Distribution)** (strongest)
- False breakout above resistance
- Look for: High volume spike, rejection, close below resistance
- Entry: When price closes back below resistance
- Stop: Above UTAD high
2. **SOW (Sign of Weakness)**
- Break below trading range support
- Look for: High volume, wide spread down bar
- Entry: On breakdown or rally to LPSY
- Stop: Above trading range
3. **Upthrust (UT)**
- Move above resistance on low volume, weak close
- Look for: Low volume, close in lower half of bar
- Entry: When resistance becomes resistance again
- Stop: Above upthrust high
4. **LPSY (Last Point of Supply)**
- Rally after SOW
- Look for: Low volume, weak rally
- Entry: When rally fails
- Stop: Above LPSY
5. **No Demand (ND)**
- Up bar on very low volume
- Indicates lack of buying pressure
- Confirms distribution phase
### NEUTRAL/WARNING SIGNALS
- **High Effort, Low Result** = Potential reversal coming
- **Stopping Volume** = Trend may be ending
- **Absorption** = Large volume with small movement (accumulation/distribution)
---
## TRADING STRATEGY EXAMPLES
### Strategy 1: Accumulation Range Breakout
**Setup:**
1. Identify trading range (blue background in Phase B)
2. Wait for Spring or Test (Phase C)
3. Wait for SOS breakout (Phase D)
**Entry:**
- Option A: Buy on SOS breakout
- Option B: Wait for LPS pullback (better risk/reward)
**Stop Loss:**
- Below the spring low or trading range bottom
**Target:**
- Measure height of trading range (cause)
- Project upward from breakout point (effect)
- Minimum target = range height
**Example:**
```
Trading Range: 100 to 120 (20 point range)
SOS Breakout at: 120
Target: 120 + 20 = 140 minimum
```
### Strategy 2: Distribution Range Breakdown
**Setup:**
1. Identify trading range after uptrend
2. Wait for UTAD (Phase C)
3. Wait for SOW breakdown (Phase D)
**Entry:**
- Option A: Sell on SOW breakdown
- Option B: Wait for LPSY rally (better risk/reward)
**Stop Loss:**
- Above the UTAD high or trading range top
**Target:**
- Measure height of trading range
- Project downward from breakdown point
- Minimum target = range height
### Strategy 3: Spring Trading
**Setup:**
1. Strong downtrend followed by range
2. Price breaks below range bottom
3. Volume is LOW on breakdown
4. Price quickly reverses and closes above support
**Entry:**
- When candle closes above support level
- Or on retest of support
**Stop Loss:**
- Below spring low (usually tight)
**Target:**
- Top of trading range
- Previous swing high
**Risk/Reward:**
- Typically 1:3 or better
### Strategy 4: Smart Money Tracking
**Setup:**
1. Look for 💰 symbols in demand zones
2. Multiple accumulation signals (PS, SC, ST, Test)
3. Volume decreasing during range
**Entry:**
- At next demand zone test
- On SOS breakout
**Confirmation:**
- Background turning green (Phase D/E)
- Table shows "BULLISH" bias
### Strategy 5: VSA Reversal
**Setup:**
1. Strong trend in place
2. Stopping Volume (SV) appears at extreme
3. Followed by No Demand (ND) or No Supply (NS)
**Entry:**
- When trend breaks down/up
- On retest of extreme
**Example (Bullish):**
```
Downtrend → Stopping Volume → No Supply → Up bar
Entry: Buy when price moves above SV bar
```
---
## SETTINGS & CUSTOMIZATION
### Volume Analysis Settings
**Volume MA Length** (default: 20)
- Shorter = More sensitive to volume changes
- Longer = Smoother, less noise
- Recommended: 15-25 for most timeframes
**High Volume Multiplier** (default: 1.5)
- Threshold for "high volume"
- Lower = More signals
- Higher = Only extreme volume
- Recommended: 1.3-2.0
**Climax Volume Multiplier** (default: 2.0)
- Threshold for climax events (SC, BC)
- Should be significantly higher than normal
- Recommended: 2.0-3.0
### Phase Detection Settings
**Swing Detection Length** (default: 5)
- How many bars to look left/right for swing points
- Shorter = More swings detected (more noise)
- Longer = Fewer swings (cleaner, might miss some)
- Recommended: 3-7
**Range Expansion Threshold** (default: 1.5)
- Multiplier for "wide spread" bars
- Higher = Only very wide bars qualify
- Recommended: 1.3-2.0
**Volume Confirmation** (default: ON)
- Requires volume confirmation for events
- Turn OFF for very low volume instruments
- Keep ON for stocks, forex, crypto
### Display Options
Toggle on/off:
- ✅ **Show Accumulation/Distribution Phases** - Background colors
- ✅ **Show Wyckoff Events** - All labeled events
- ✅ **Show Volume Spread Analysis** - VSA labels
- ✅ **Show Supply/Demand Zones** - Boxes on chart
- ✅ **Show Composite Operator Signals** - 💰 symbols
### Color Customization
- **Bullish Color** - All accumulation events
- **Bearish Color** - All distribution events
- **Neutral Color** - Range/neutral signals
---
## ALERT SETUP
### Available Alerts
1. **Selling Climax (SC)** - Potential bottom forming
2. **Spring** - Strong buy signal
3. **Sign of Strength (SOS)** - Bullish breakout
4. **Buying Climax (BC)** - Potential top forming
5. **UTAD** - Strong sell signal
6. **Sign of Weakness (SOW)** - Bearish breakdown
7. **Phase E Markup** - Uptrend confirmed
8. **Phase E Markdown** - Downtrend confirmed
9. **Smart Money Accumulation** - Institutions buying
10. **Smart Money Distribution** - Institutions selling
### How to Set Up Alerts
1. Click the "⏰" icon on TradingView
2. Select "Create Alert"
3. Condition: Choose the indicator and alert type
4. Example: "Wyckoff Method - Spring"
5. Set notification preferences (popup, email, webhook)
6. Click "Create"
### Recommended Alert Strategy
**Conservative Trader:**
- Spring
- SOS
- UTAD
- SOW
**Aggressive Trader:**
- Add: SC, BC, Smart Money signals
**Long-term Investor:**
- Phase E Markup
- Phase E Markdown
- Smart Money Accumulation
---
## COMMON PATTERNS
### Pattern 1: Classic Accumulation
```
Phase A: Downtrend → PS → SC → AR → ST
Phase B: Range building (4-12 weeks typical)
Phase C: Spring (false breakdown)
Phase D: SOS → LPS → BU
Phase E: Markup (new uptrend)
```
**What to do:**
- Mark the range boundaries
- Wait for spring
- Buy on LPS or SOS
- Hold through markup
### Pattern 2: Classic Distribution
```
Phase A: Uptrend → PSY → BC → AR → ST
Phase B: Range building (topping process)
Phase C: UTAD (false breakout)
Phase D: SOW → LPSY
Phase E: Markdown (new downtrend)
```
**What to do:**
- Mark the range boundaries
- Wait for UTAD
- Sell on LPSY or SOW
- Stay out during markdown
### Pattern 3: Re-Accumulation
```
Uptrend → Trading Range → Spring → Uptrend continues
```
- Occurs during existing uptrend
- Shorter accumulation period
- Often no clear SC (trend is already up)
- Spring is the key signal
### Pattern 4: Re-Distribution
```
Downtrend → Trading Range → UTAD → Downtrend continues
```
- Occurs during existing downtrend
- Shorter distribution period
- Often no clear BC (trend is already down)
- UTAD is the key signal
### Pattern 5: Failed Breakout
**Bullish Failed Breakout:**
```
Range → Breakdown → Immediate reversal (Spring)
```
- Price breaks support
- Volume is LOW
- Immediate strong reversal
- Very bullish
**Bearish Failed Breakout:**
```
Range → Breakout → Immediate reversal (UTAD)
```
- Price breaks resistance
- Volume may be high initially
- Quick rejection and reversal
- Very bearish
---
## TIMEFRAME RECOMMENDATIONS
### Daily Charts (Most Reliable)
- Best for swing trading
- Clear phases and events
- Less noise
- Recommended for beginners
### 4-Hour Charts
- Good for active swing traders
- Faster signals than daily
- Still reliable
### 1-Hour Charts
- For day traders
- More false signals
- Need to filter carefully
- Use in conjunction with higher timeframe
### 15-Minute / 5-Minute
- Only for experienced traders
- High noise level
- Many false signals
- Use daily chart for context
**Golden Rule:** Always check higher timeframe first!
---
## MULTI-TIMEFRAME ANALYSIS
### Top-Down Approach (Recommended)
1. **Weekly Chart** - Identify major trend and phase
2. **Daily Chart** - Find current accumulation/distribution
3. **4H Chart** - Identify entry timing
4. **Entry Timeframe** - Execute trade
### Example Analysis:
**Weekly:** Phase E Markup (bullish)
**Daily:** Phase B Re-accumulation
**4-Hour:** Spring detected
**Action:** Buy on daily LPS
---
## WYCKOFF + OTHER INDICATORS
### Complementary Tools
1. **Moving Averages**
- 20/50 SMA for trend context
- Already plotted on indicator
2. **RSI**
- Divergences at SC/BC
- Confirms overbought/oversold
3. **MACD**
- Confirms trend change in Phase D
- Divergences support Wyckoff events
4. **Volume Profile**
- Identifies value areas
- Confirms supply/demand zones
5. **Order Flow / Footprint Charts**
- See institutional activity
- Confirms smart money signals
**Don't Over-Complicate:**
- Wyckoff is a complete system
- Other indicators are supplementary
- When in doubt, trust Wyckoff
---
## TROUBLESHOOTING
### Issue: Too Many Labels
**Solution:**
- Increase swing length (Settings → 7 or 10)
- Increase volume multipliers
- Turn off VSA labels if not needed
- Focus on major events only (SC, Spring, SOS, BC, UTAD, SOW)
### Issue: Missing Expected Events
**Solution:**
- Decrease swing length (Settings → 3)
- Decrease volume multipliers
- Turn OFF volume confirmation
- Check timeframe (use daily chart)
### Issue: False Signals
**Solution:**
- Use higher timeframe
- Wait for confirmation
- Don't trade against major trend
- Look for multiple signal convergence
### Issue: Can't See Background Colors
**Solution:**
- Check "Show Phases" is enabled
- Increase monitor brightness
- Colors are subtle by design (not to obscure price)
### Issue: Volume Shows Incorrectly
**Solution:**
- Ensure volume data is available for your symbol
- Some symbols have poor volume data
- Forex spot pairs have no real volume
- Use futures or stock markets for best results
### Issue: No Trading Range Detected
**Solution:**
- Market may be trending strongly
- Trading range might be too small
- Wait for price to consolidate
- Not all markets have clear ranges
---
## ADVANCED TIPS
### 1. Count Point & Figure Charts
- Wyckoff used P&F to measure "cause"
- Width of range × height = minimum move target
- Longer accumulation = larger markup
### 2. Watch for Absorption
- High volume + narrow spread = someone absorbing
- In downtrend = accumulation
- In uptrend = distribution
### 3. Multiple Timeframe Springs
- Spring on daily + spring on weekly = very strong
- Increases probability significantly
### 4. Failed Signals Are Signals Too
- Failed spring = weakness, expect lower
- Failed UTAD = strength, expect higher
### 5. Context is King
- Don't buy during Phase E Markdown
- Don't sell during Phase E Markup
- Respect the major trend
### 6. Volume Precedes Price
- Study volume changes first
- Price follows volume
- Decreasing volume in range = building energy
### 7. Composite Operator Mindset
- Think like institutions
- Where would smart money buy/sell?
- They need liquidity (retail traders)
---
## RISK MANAGEMENT
### Position Sizing
**Conservative:**
- Risk 1% per trade
- Wider stops at range boundaries
**Moderate:**
- Risk 1-2% per trade
- Stops below spring/above UTAD
**Aggressive:**
- Risk 2-3% per trade
- Tight stops
- Higher win rate needed
### Stop Loss Placement
**Accumulation:**
- Below spring low
- Below trading range bottom
- Below demand zone
**Distribution:**
- Above UTAD high
- Above trading range top
- Above supply zone
### Take Profit Strategy
**Method 1: Measured Move**
- Range height = minimum target
- 2x range height = extended target
**Method 2: Fibonacci Extensions**
- 1.0 = range height
- 1.618 = extended target
- 2.618 = maximum target
**Method 3: Trail the Stop**
- Move stop to breakeven at 1R
- Trail under swing lows in markup
- Lock in profits progressively
---
## BACKTESTING CHECKLIST
Before trading with real money:
- Backtest on 50+ historical examples
- Record all signals in trading journal
- Calculate win rate (aim for >50%)
- Calculate average R:R (aim for >1:2)
- Test on multiple instruments
- Test on multiple timeframes
- Test in different market conditions
- Verify signal consistency
- Practice on demo account
- Start small with real money
---
## RECOMMENDED READING
### Books
1. **"Studies in Tape Reading"** - Richard D. Wyckoff
2. **"The Richard D. Wyckoff Method"** - Rubén Villahermosa
3. **"Charting the Stock Market: The Wyckoff Method"** - Jack Hutson
4. **"Master the Markets"** - Tom Williams (VSA)
### Courses
1. Wyckoff Analytics - Official Wyckoff course
2. TradeVSA - Volume Spread Analysis
3. StockCharts - Wyckoff education
### Communities
1. Wyckoff Analytics Forum
2. Reddit r/Wyckoff
3. TradingView Wyckoff ideas section
---
## FREQUENTLY ASKED QUESTIONS
**Q: Can I use this on crypto?**
A: Yes, works well on major cryptocurrencies with good volume.
**Q: Does it work on forex?**
A: Yes, but use futures volume (like 6E for EUR/USD) for better accuracy.
**Q: What's the best timeframe?**
A: Daily chart for most traders. 4H for more active trading.
**Q: How long does accumulation last?**
A: Typically 2-12 weeks. Longer accumulation = bigger markup.
**Q: Can I automate this?**
A: You can use the alerts, but manual analysis is recommended.
**Q: What's the win rate?**
A: With proper filtering: 60-70% on major signals (Spring, UTAD, SOS, SOW).
**Q: Should I trade every signal?**
A: No. Focus on Spring, UTAD, SOS, and SOW in trending markets.
**Q: What if I see conflicting signals?**
A: Use higher timeframe for context. When in doubt, stay out.
**Q: How do I know which phase I'm in?**
A: Check the table in top-right corner. Also look at background color.
**Q: Can I use this for options trading?**
A: Yes, excellent for timing option entries (especially around Spring/UTAD).
---
## FINAL THOUGHTS
The Wyckoff Method is:
- **A complete trading system** (not just an indicator)
- **Based on 100+ years** of market wisdom
- **Used by institutions** and professional traders
- **Requires practice** and screen time
- **Highly effective** when applied correctly
**Success Tips:**
1. Start with daily charts
2. Focus on major events (SC, Spring, SOS, BC, UTAD, SOW)
3. Always check higher timeframe context
4. Wait for confirmation before entering
5. Manage risk properly
6. Keep a trading journal
7. Be patient - wait for the best setups
**Remember:**
- Not every range will have all events
- Some phases may be abbreviated
- Context and confluence matter most
- Practice makes perfect
---
## SUPPORT & UPDATES
For questions, improvements, or bug reports:
- Check TradingView script comments
- Join Wyckoff trading communities
- Study historical examples
- Practice on demo accounts
**Good luck and happy trading!**
---
*Disclaimer: This indicator is for educational purposes. Always do your own analysis and risk management. Past performance does not guarantee future results.*
# WYCKOFF VISUAL SETUP EXAMPLES
## ACCUMULATION SCHEMATIC #1 (Classic Bottom)
```
Price Chart View:
│ PHASE E
│ MARKUP
│ ╱
│ ╱
┌─SOS─────┤ ╱
│ │ ╱
┌───────────┤ ┌LPS │╱
│ PHASE B │ │ │
│ (Cause) └──┴──────┤
┌AR──┤ │
┌────┤ │ ┌─Spring │ PHASE D
│ └ST──┤ │ │
│ │ │ │
────SC────────┴─────────┴───────────┴──────────
│
PS
│ PHASE A
│
Downtrend
```
### PHASE A - Stopping the Downtrend
```
PS: │ High volume down bar
▼ First sign of support
■ Not bottom yet
SC: │ VERY HIGH volume
▼ Panic selling exhaustion
█ Long lower wick
█ This is the low
AR: │ Automatic rally
▲ Relief bounce
■ High volume acceptable
ST: │ Secondary test
▼ Low volume (KEY!)
■ Tests SC low
```
### PHASE B - Building the Cause
```
┌─────────┐
│ ~~~ │ Multiple tests
│ ~ ~ │ Volume decreases
│~ ~ │ Range gets tighter
└─────────┘
Duration: 2-12 weeks typical
The longer, the bigger the eventual move
```
### PHASE C - The Test (SPRING)
```
║ False breakdown
─────╨─────
▼ Low volume
█ Breaks below support
■
█ Quick reversal
▲ Closes ABOVE support
CRITICAL: Volume must be LOW
Close must be strong
Happens quickly (1-3 bars)
```
### PHASE D - Strength Emerges
```
SOS: ▲ Sign of Strength
────╥──── Break above resistance
║ High volume
║ Wide spread
LPS: ▼ Last Point Support
■ Pullback on LOW volume
▲ Great entry point
BU: ▲ Backup
■ Final consolidation
▲ Before markup
```
### PHASE E - Markup
```
╱
╱
╱ Strong uptrend
╱ High momentum
╱ Can last months/years
──╱──
```
---
## DISTRIBUTION SCHEMATIC #2 (Classic Top)
```
Price Chart View:
Uptrend
│
PSY
│ PHASE A
────BC────────┬─────────┬───────────┬──────────
│ │ UTAD │
│ PHASE B │ │ PHASE D
┌AR──┤ ┌LPSY │ │
│ │ │ └───────────┤
│ └──┴──────┐ │╲
└ST──┤ │ │ ╲
│ └───────────┤ ╲
└─SOW─────┤ │ ╲
│ │ ╲
│ PHASE C │ ╲
│ │ PHASE E
│ │ MARKDOWN
```
### PHASE A - Stopping the Uptrend
```
PSY: │ High volume up bar
▲ Preliminary supply
■ Selling starting
BC: │ VERY HIGH volume
▲ Buying climax
█ Euphoric top
█ Long upper wick
AR: │ Automatic reaction
▼ Sharp selloff
■ High volume
ST: │ Secondary test
▲ Low volume (KEY!)
■ Tests BC high
```
### PHASE C - The Test (UTAD)
```
▲ False breakout
────╥────
║ Breaks ABOVE resistance
║ Often high volume spike
▼
█ Rejection / weak close
█ Closes BELOW resistance
▼
CRITICAL: Closes weak
Quick rejection
Traps buyers
```
### PHASE D - Weakness Emerges
```
SOW: ▼ Sign of Weakness
────╨──── Break below support
║ High volume
║ Wide spread
LPSY: ▲ Last Point Supply
■ Rally on LOW volume
▼ Last chance to exit
```
---
## VOLUME PATTERNS (Critical to Understanding)
### ACCUMULATION Volume Pattern
```
Volume
│ SC
█
█ ST
■ ■ Spring
■ ■ ■ SOS LPS
──┴────┴────┴──────█───■────►
│ │ │ │ │
│ │ │ │ │
A A C D D
Pattern: HIGH → low → low → HIGH → low
Key: Volume DECREASES during range
INCREASES on breakout
```
### DISTRIBUTION Volume Pattern
```
Volume
│ BC
█
█ ST
■ ■ UTAD
■ ■ ■ SOW LPSY
──┴────┴────┴──────█───■────►
│ │ │ │ │
│ │ │ │ │
A A C D D
Pattern: HIGH → low → varies → HIGH → low
Key: Volume MAY increase on UTAD
Definitely HIGH on breakdown (SOW)
```
---
## REAL TRADE SETUPS
### Setup #1: SPRING BUY
```
Entry Conditions:
1. Clear trading range identified
2. Price breaks BELOW support
3. Volume is LOW (critical!)
4. Price reverses QUICKLY
5. Closes ABOVE support level
Entry: Next bar or on retest
Stop: Below spring low
Target: Top of range (minimum)
Example:
Support: $100
Spring low: $98 (low volume)
Close: $101
Entry: $102
Stop: $97.50
Target: $120 (range top)
Risk/Reward: 1:4
```
### Setup #2: UTAD SELL
```
Entry Conditions:
1. Clear trading range identified (after uptrend)
2. Price breaks ABOVE resistance
3. Often high volume spike
4. Price reverses QUICKLY
5. Closes BELOW resistance level
Entry: Next bar or on retest
Stop: Above UTAD high
Target: Bottom of range (minimum)
Example:
Resistance: $200
UTAD high: $205 (spike)
Close: $198
Entry: $197
Stop: $206
Target: $180 (range bottom)
Risk/Reward: 1:2
```
### Setup #3: SOS BREAKOUT
```
Entry Conditions:
1. Clear accumulation range
2. Spring already occurred (ideal)
3. Price breaks ABOVE resistance
4. HIGH volume on breakout
5. Wide spread up bar
Entry Option A: On breakout ($120)
Entry Option B: Wait for LPS pullback ($115)
Stop: Below range or LPS
Target: Range height projected up
Example:
Range: $100-$120 (20 points)
SOS breakout: $120
Entry A: $120
Stop: $115
Target 1: $140 (100%)
Target 2: $150 (150%)
```
---
## VSA SPECIFIC PATTERNS
### Pattern 1: No Demand (Weakness)
```
▲
■ Up bar
■ Low volume ◄── KEY
▲ Small body
Context: After uptrend
Meaning: Buyers exhausted
Action: Prepare to sell
```
### Pattern 2: No Supply (Strength)
```
▼
■ Down bar
■ Low volume ◄── KEY
▼ Small body
Context: After downtrend
Meaning: Sellers exhausted
Action: Prepare to buy
```
### Pattern 3: Stopping Volume
```
═ Very high volume
█ Narrow spread ◄── KEY
═ Price not moving
Context: At extremes
Meaning: Absorption
Action: Expect reversal
```
---
## COMMON MISTAKES (What NOT to Do)
### ❌ Mistake 1: Buying Prematurely
```
WRONG:
SC
▼
█ ← DON'T BUY HERE
CORRECT:
Spring
─────╨─────
▼
█ ← BUY HERE
▲
```
### ❌ Mistake 2: Ignoring Volume
```
WRONG: "It broke below support, must be spring"
─────╨───── High volume
█
This is a BREAKDOWN, not a spring!
CORRECT Spring:
─────╨───── LOW volume ✓
■ Quick reversal ✓
▲
```
### ❌ Mistake 3: Trading Against Trend
```
WRONG:
Markdown Phase E
╲
╲ ← Trying to buy here
╲
╲
CORRECT:
Wait for new accumulation to complete
```
---
## MULTI-TIMEFRAME EXAMPLE
### Weekly Chart: Phase E Markup (Bullish)
```
╱
╱
╱ Long-term uptrend
╱
───╱─────
```
### Daily Chart: Re-Accumulation Phase C
```
┌─────────┐
│ Spring │ ← We are here
│ ▼ │
─────┴────█────┴─────
▲
```
### 4-Hour Chart: Entry Timing
```
Last 48 hours:
─────╨───── Spring occurred
█
▲ ← Enter now
■
```
**Result:** Triple confirmation across timeframes = High probability trade
---
## PROFIT TARGETS (Visual Guide)
### Method 1: Basic Measured Move
```
Resistance: 120 ┐ ─────────
│
│ 20 points
│
Support: 100 ┘ ─────────
Breakout: 120
Target: 120 + 20 = 140
╱╱╱ 140 (Target)
╱╱╱
╱╱╱
──────◄ 120 (Breakout)
│
Range │ 20
│
──────┘ 100
```
### Method 2: Multiple Targets
```
╱╱╱ 150 (Target 3: 2.5x) - 20% position
╱╱╱
╱╱╱ 140 (Target 2: 2x) - 30% position
╱╱╱
─────◄╱ 130 (Target 1: 1x) - 50% position
│
10 │ 120 (Breakout)
│
─────┘ 110 (Support)
```
### Method 3: Trailing Stop
```
1. Move stop to breakeven at Target 1
2. Trail stop under swing lows
3. Let winners run
╱╱╱
╱ ╱╱ ← Trail stop here
╱╱ ╱
╱ ╱ ← Then here
─────◄──╱
← Start here (breakeven)
```
---
## TIMING ENTRIES (Exact Bar Patterns)
### Perfect Spring Entry
```
Bar 1: ▼ Breaks below (Low vol)
█
Bar 2: ▲ Reverses (Closes strong)
█ ◄─ ENTER HERE
Bar 3: ■ Confirms
▲
DON'T WAIT for Bar 3!
Enter on Bar 2 close
```
### Perfect UTAD Entry
```
Bar 1: ▲ Breaks above (Spike vol OK)
█
Bar 2: ▼ Reverses (Closes weak)
█ ◄─ ENTER HERE
Bar 3: ■ Confirms
▼
SHORT on Bar 2 close
Don't wait for more confirmation
```
---
## COMPOSITE OPERATOR PSYCHOLOGY
### What Smart Money Does (Follow Them)
**Accumulation:**
```
1. Create fear (PS, SC)
2. Shake out weak hands (Spring)
3. Absorb supply quietly (Phase B)
4. Test for remaining supply (Test)
5. Mark it up (SOS → Phase E)
💰 They buy LOW when retail panics
```
**Distribution:**
```
1. Create euphoria (PSY, BC)
2. Trap late buyers (UTAD)
3. Distribute to buyers (Phase B)
4. Test for remaining demand (ST)
5. Mark it down (SOW → Phase E)
💰 They sell HIGH when retail buys
```
### Where to Look for Smart Money
```
💰 Buy signals appear at:
- Demand zones (green boxes)
- Springs and shakeouts
- Tests of support
- After selling climax
💰 Sell signals appear at:
- Supply zones (red boxes)
- UTAD and upthrusts
- Weak rallies (LPSY)
- After buying climax
```
---
## PRACTICE EXERCISES
### Exercise 1: Identify the Phase
Look at any chart and ask:
1. Is there a trading range? (Phase B likely)
2. Did we just stop a trend? (Phase A)
3. Was there a spring/UTAD? (Phase C)
4. Is there a breakout? (Phase D)
5. Is trend running? (Phase E)
### Exercise 2: Volume Analysis
For each bar, note:
- Volume level (High/Normal/Low)
- Spread (Wide/Normal/Narrow)
- Effort vs Result (Matching? Diverging?)
### Exercise 3: Find Historical Springs
Go back 6 months:
- Mark all springs you can find
- Note the setup before each
- Track what happened after
- Calculate win rate
---
## FINAL VISUALIZATION: The Complete Cycle
```
ACCUMULATION → MARKUP → DISTRIBUTION → MARKDOWN → ACCUMULATION...
Distribution Accumulation
(Top) (Bottom)
┌───────────────┐ ┌───────────────┐
│ BC UTAD │ │ Spring SC │
│ │ │ │ │ │ │ │
────┴───┴───┴───────┴─╲ ╱────────┴───┴───┴────
╲ ╱
Markdown ╲ ╱ Markup
(Phase E) ╲ ╱ (Phase E)
╲ ╱
╲ ╱
╲ ╱
╲ ╱
V
The market cycles endlessly
Your job: Identify where you are in the cycle
Trade accordingly
```
---
**Remember:**
- 📊 Study charts daily
- 📝 Journal every setup
- 🎯 Wait for the best signals
- 💰 Follow smart money
- ⏰ Be patient
- 🚀 Let winners run
**The indicator does the heavy lifting - you make the decisions!**

INSTITUTIONAL VOLUME PROFILE + FIBONACCI + ENHANCED SIGNALS🎯 INSTITUTIONAL VOLUME PROFILE + FIBONACCI + ENHANCED SIGNALS
A professional-grade indicator combining Volume Profile analysis, Fibonacci retracements, Anchored VWAP, and intelligent signal filtering to identify high-probability institutional positioning and trade setups.
📊 CORE FEATURES
▸ Volume Profile with POC (Point of Control)
- Visualizes where institutional volume accumulated
- Identifies High Volume Nodes (HVN) as key support/resistance
- Shows Value Area (70% volume zone) for market equilibrium
▸ Dynamic Fibonacci Levels
- Auto-detects swing high/low for retracement levels
- Golden Pocket (0.618-0.65) highlight zone
- Bull/bear direction recognition
▸ Anchored VWAP
- Anchored to swing range start
- Institutional mean reversion baseline
- Real-time trend bias indicator
▸ Graded Signal System (A+/B/C)
- A+ Signals: High probability setups (VWAP cross + POC alignment)
- B Signals: Above-average quality (VWAP cross above POC)
- C Signals: Lower probability (counter-trend setups)
🎮 DISPLAY MODES
⚡ TRADING LIVE MODE
- Clean chart showing only A+ signals
- Minimal visual noise for active trading
- Perfect for intraday execution
📈 FULL OVERVIEW MODE
- Complete analysis with all zones visible
- Volume Profile + Fibonacci + Value Area
- All signal grades displayed
- Statistics dashboard
🔬 ADVANCED SIGNAL FILTERS
✓ Volume Confirmation
- Requires above-average volume on signals
- Filters out weak institutional participation
- Configurable volume multiple (default 1.2x)
✓ Momentum Filter
- Ensures price momentum aligns with signal direction
- Prevents counter-trend entries
- Configurable lookback period
✓ SR Proximity Upgrade ⭐ GAME CHANGER
- Automatically upgrades B/C signals to A+ when near key levels
- Detects proximity to POC and HVN zones
- Combines technical confluence for best setups
🔔 SMART ALERTS
▸ Configurable alerts for A+, B, or C signals
▸ Real-time notifications to your device
▸ No need to watch charts constantly
▸ "Once per bar close" prevents repainting
💡 HOW TO USE
FOR DAY TRADING:
1. Switch to "Trading Live" mode
2. Enable only A+ alerts
3. Set filters: Volume 1.5x, Momentum ON, Proximity 0.3%
4. Trade only A+ signals at key levels
FOR SWING TRADING:
1. Use "Full Overview" mode
2. Analyze Value Area and Fibonacci confluence
3. Set filters: Volume 1.2x, Momentum ON, Proximity 0.8%
4. Enter on A+ signals with multi-timeframe confirmation
FOR ANALYSIS:
1. Full Overview mode with all visuals enabled
2. Disable filters to see all raw signals
3. Study how institutions positioned at key zones
4. Plan trades around POC and Value Area
⚙️ RECOMMENDED SETTINGS
5-15 MIN CHARTS (Scalping):
- Lookback: 200-300 bars
- Volume: 1.5x, Momentum: 5 bars, Proximity: 0.3%
- Trading Live mode + A+ alerts only
1 HOUR CHARTS (Intraday):
- Lookback: 300 bars
- Volume: 1.3x, Momentum: 3 bars, Proximity: 0.5%
- Full Overview or Trading Live
4 HOUR CHARTS (Swing):
- Lookback: 300-500 bars
- Volume: 1.2x, Momentum: 3 bars, Proximity: 0.8%
- Full Overview mode
DAILY CHARTS (Position):
- Lookback: 300-500 bars
- Volume: 1.1x, Momentum: 2 bars, Proximity: 1.0%
- Full Overview mode
📈 KEY CONCEPTS
POC (Point of Control): Price level with highest volume - acts as magnet
Value Area: Zone containing 70% of volume - equilibrium range
HVN: High Volume Nodes - institutional accumulation zones
AVWAP: Anchored VWAP - institutional average entry price
Golden Pocket: 0.618-0.65 Fib zone - highest probability reversal area
🎯 TRADING STRATEGY TIPS
1. Wait for A+ signals - quality over quantity
2. Best setups occur at POC or Value Area boundaries
3. Use multiple timeframes for confirmation
4. Combine with your own risk management rules
5. Signals are high probability, not guaranteed - always use stops

SUPERTREND VALIDADO ADX EMAS VWAP # Modular Trading System - SuperTrend + ADX + Multi-Filter Confirmation
## Overview
Professional modular trading system designed for trend-following strategies on 4H timeframes. Features a clean, mobile-optimized interface with customizable filters and real-time status monitoring.
## Core Features
### Validated Components (Backtested)
- **SuperTrend (ATR 10, Multiplier 3.0)**: Primary trend direction filter with visual fill
- **ADX >23**: Trend strength confirmation (14-period)
- Proven performance: 52.11% win rate, 3.162 profit factor over 4 years
### Additional Filters (Optional)
- **DI Spread >9**: Directional movement confirmation
- **Volume > EMA20**: Volume confirmation above 20-period average
- **EMA System**: 7/21/50 with dynamic coloring
- **VWAP**: Daily volume-weighted average price
### Visual Elements
- **SuperTrend Line**: Green (bullish) / Red (bearish) with background fill
- **EMA 7**: Yellow when ADX >23, White when ADX ≤23
- **EMA 21**: Green (price above) / Red (price below)
- **EMA 50**: Blue reference line
- **VWAP**: Orange line
- **PDH/PDL**: Previous day high/low levels
- **EMA Cross Signals**: Small dots marking 7/21 crossovers
### Smart Money Concepts
- Automatic Previous Day High (PDH) / Previous Day Low (PDL) tracking
- Horizontal lines extending from current price
- Clear labeling for support/resistance levels
## Status Dashboard
Compact 2-column table (top-right) shows:
```
FILTERS | STATUS
1. ADX >23 | 47.6 OK / 18.2 NO
2. DI Spread >9 | Bullish / Bearish
3. SuperTrend | Bullish / Bearish
4. Volume >EMA20 | 1.25x OK / 0.14x NO
─────────────────────────────
SIGNAL | BUY / SELL / WAIT
```
Color-coded backgrounds:
- Green: Condition met
- Red: Condition not met
- Yellow: Waiting for confirmation
## Signal Logic
### Entry Conditions
**LONG**: All active filters must align
- SuperTrend bullish (green)
- ADX >23
- DI+ > DI- (if DI Spread enabled)
- Volume > EMA20 (if Volume enabled)
- Price > EMA21 and EMA7 > EMA21 (if EMAs enabled)
**SHORT**: All active filters must align
- SuperTrend bearish (red)
- ADX >23
- DI- > DI+ (if DI Spread enabled)
- Volume > EMA20 (if Volume enabled)
- Price < EMA21 and EMA7 < EMA21 (if EMAs enabled)
### Exit Conditions
- SuperTrend direction change
- Clear "EXIT" markers on chart
### Position Management
- One position per trend (no pyramiding)
- Prevents multiple entries in same direction
- "WAIT" status when conditions partially met
## Settings & Customization
### Filters (Enable/Disable)
**Core Filters:**
- ✓ SuperTrend (VALIDATED)
- ✓ ADX >23 (VALIDATED)
**Additional Filters:**
- ⚠️ DI Spread >9 (EXPERIMENTAL)
- ⚠️ Volume > EMA20 (EXPERIMENTAL)
- ⚠️ EMAs 7/21/50 (EXPERIMENTAL)
**Visual:**
- Show EMA 7/21 Crosses (dots)
### Parameters
**SuperTrend:**
- ATR Period: 10 (default)
- ATR Multiplier: 3.0 (default)
**ADX/DI:**
- ADX Length: 14 (default)
- ADX Threshold: 23 (default)
- DI Spread Threshold: 9 (default)
**Volume:**
- Volume EMA: 20 (default)
**EMAs:**
- Fast EMA: 7 (default)
- Medium EMA: 21 (default)
- Slow EMA: 50 (default)
## Alerts
Pre-configured alerts for:
- Long Signal (BUY - Entry confirmed)
- Short Signal (SELL - Entry confirmed)
- Exit Long (EXIT LONG - SuperTrend changed)
- Exit Short (EXIT SHORT - SuperTrend changed)
- EMA Cross Up (EMA 7 crossed above EMA 21)
- EMA Cross Down (EMA 7 crossed below EMA 21)
## Best Practices
### Recommended Setup (Validated System)
```
Enable ONLY:
- SuperTrend: ON
- ADX >23: ON
- All other filters: OFF
```
### Testing New Filters
1. Enable experimental filters
2. Backtest thoroughly before live trading
3. Compare performance metrics
4. Validate with demo account first
### Timeframe
- Optimized for: 4H charts
- Tested on: Bitcoin/USDT
- Works on: Any trending instrument
## Risk Management
This indicator provides entry/exit signals but does NOT include:
- Stop loss levels
- Take profit targets
- Position sizing
Always use proper risk management:
- Maximum 1-2% risk per trade
- Use stop losses
- Follow your trading plan
## Performance Notes
**Validated Backtest Results (SuperTrend + ADX only):**
- Win Rate: 52.11%
- Profit Factor: 3.162
- Return: +45.46% (4 years)
- Tested Period: 2020-2024
- Instrument: BTC/USDT 4H
**Important:** Adding additional filters changes the system. Results may vary. Always backtest your specific configuration before live trading.
## Mobile Optimization
- Compact table design
- Clear color coding
- Minimal chart clutter
- Large signal text
- Optimized for small screens
## Use Cases
✅ **Ideal for:**
- Trend-following strategies
- Swing trading (4H timeframe)
- Clear market conditions
- Systematic traders
❌ **NOT ideal for:**
- Scalping (too slow)
- Range-bound markets
- Counter-trend strategies
- Lateral/choppy conditions
## Credits & Methodology
Based on proven technical analysis principles:
- SuperTrend (volatility-based trend following)
- ADX (trend strength measurement)
- Directional Indicators (DI+/DI-)
- Volume analysis
- EMA systems
**Designed for:** Disciplined execution over frequent trading
**Philosophy:** Quality setups > Quantity of trades
## Disclaimer
This indicator is for educational purposes only. Past performance does not guarantee future results. Always:
- Test on demo account first
- Use proper risk management
- Never risk more than you can afford to lose
- Consult a financial advisor
Trading involves substantial risk. This tool does not constitute financial advice.
---
## Version History
**v2.0 (Current)**
- Modular filter system
- 2-column compact status table
- EMA 7 dynamic coloring (yellow when ADX >23)
- EMA 50 + VWAP added
- PDH/PDL levels
- EMA cross markers
- Improved signal logic
- One position per trend
- Multiple alert conditions
---
**For support, updates, or feedback, contact the developer.**
