Custom Bollinger Band Squeeze Screener [Pineify]Custom Bollinger Band Squeeze Screener
Key Features
Multi-symbol scanning: Analyze up to 6 tickers simultaneously.
Multi-timeframe flexibility: Screen across four selectable timeframes for each symbol.
Bollinger Band Squeeze algorithm: Detect volatility contraction and imminent breakouts.
Advanced ATR integration: Measure expansion and squeeze states with custom multipliers.
Customizable indicator parameters: Fine-tune Bollinger and ATR settings for tailored detection.
Visual table interface: Rapidly compare squeeze and expansion signals across all instruments.
How It Works
At the core, this screener leverages a unique blend of Bollinger Bands and Average True Range (ATR) to quantify volatility states for multiple assets and timeframes at once. For each symbol and every selected timeframe, the indicator calculates Bollinger Band width and compares it against ATR levels, offering real-time squeeze (consolidation) and expansion (breakout) signals.
Bollinger Band width is computed using standard deviations around a SMA basis.
ATR is calculated to gauge market volatility independent of price direction.
Squeeze: Triggered when BB width contracts below a multiple of ATR, forecasting lower volatility and set-up for a move.
Expansion: Triggered when BB width expands above a higher ATR multiple, signaling a high-volatility breakout.
Display: Results shown in an intuitive table, marking each status per ticker and TF.
Trading Ideas and Insights
Spot assets poised for volatility-driven breakouts.
Compare squeeze presence across timeframes for optimal entry timing.
Integrate screener results with price action or volume for high-confidence setups.
Use squeeze signals to avoid choppy or non-trending conditions.
Expand and diversify watchlists with multi-symbol coverage.
How Multiple Indicators Work Together
This script seamlessly merges Bollinger Bands and ATR with customized multipliers:
Bollinger Bands identify price consolidation and volatility squeeze zones.
ATR tailors the definition of squeeze and expansion, making signals adaptive to volatility regime changes.
By layering these with multi-symbol/multi-timeframe data, traders access a high-precision view of market readiness for trend acceleration or reversal.
The real synergy is in the screener's ability to visualize volatility states for a diverse asset selection, transforming traditional single-chart analysis into a broad market view.
Unique Aspects
Original implementation: Not a simple trend or scalping indicator; utilizes advanced volatility logic.
Fully multi-symbol and multi-timeframe support uncommon in most screeners.
Custom ATR multipliers for both squeeze and expansion allow traders to match their risk profile and market dynamics.
Visual clarity: Table structure promotes actionable insights and reduces decision fatigue.
How to Use
Add the indicator to your TradingView chart (supports any asset class including crypto, forex, stocks).
Select up to six symbols (tickers) and set your preferred timeframes.
Adjust Bollinger Band Length/Deviation and ATR multipliers to refine squeeze/expansion criteria.
Review the screener table: Look for "SQZ" (squeeze) or "EXP" (expansion) cells for entry/exit ideas.
Combine screener information with other technical or fundamental signals for trade confirmation.
Customization
Symbols: Choose any tickers for scanning.
Timeframes: Select short- to long-term intervals to match your trading style.
Bollinger Band parameters: Modify length and deviation for sensitivity.
ATR multipliers: Set low or high values to adjust squeeze/expansion triggers.
Table size and layout: Adapt display for optimal workflow.
Conclusion
The Bollinger Band Squeeze Screener Pineify delivers an innovative, SEO-friendly multi-asset solution for volatility and trend detection. Harness its original algorithmic design to uncover powerful breakout opportunities and optimize your portfolio. Whether you trade crypto with dynamic volatility or scan stocks for momentum, this tool supercharges your TradingView workflow.
Tìm kiếm tập lệnh với "screener"

Market Structures Screener | Flux Charts💎 GENERAL OVERVIEW
Introducing our new Market Structures Screener! This screener can provide information about the latest market structures in up to 5 tickers. You can also customize the styling of the screener.
Features of the new Market Structures Screener :
Find Latest Market Structures Across 5 Tickers
Break Of Structure (BOS)
Change of Character (CHoCH)
Change of Character+ (CHoCH+)
Customizable Algoritm / Styling
📌 HOW DOES IT WORK ?
Sometimes specific market structures form and break as the market fills buy & sell orders. Formed Change of Character (CHoCH) and Break of Structure (BOS) often mean that market will change direction, and they can be spotted by inspecting low & high pivot points of the chart.
This screener then finds market structures across 5 different tickers, and shows the latest information about them.
🚩UNIQUENESS
Formed market structures can be strong hints about the current direction and the state of the market, and our screener has the ability to detect Change Of Character structures of the market with higher sensitivity (CHoCH+), so you will miss less hints. This screener will then show the elapsed time of the found BOS, CHoCH and CHoCH+ structures.
⚙️SETTINGS
1. Tickers
You can set up to 5 tickers for the screener to scan market structures here. You can also enable / disable them and set their individual timeframes.

Liquidity Grab Screener | Flux Charts💎 GENERAL OVERVIEW
Introducing our new Liquidity Grab Screener! This screener can provide information about the latest liquidity grabs in up to 5 tickers. You can also customize the algorithm that finds the liquidity grabs and the styling of the screener.
Features of the new Liquidity Grab Screener :
Find Latest Liquidity Grabs Accross 5 Tickers
Price, Size, Status Information
Customizable Algoritm / Styling
📌 HOW DOES IT WORK ?
Liquidity grabs occur when one of the latest pivots has a false breakout. Then, if the wick to body ratio of the bar is higher than 0.5 (can be changed from the settings) a bubble is plotted.
The bubble size is determined by the wick to body ratio of the candle.
This screener then finds liquidity grabs accross 5 different tickers, and shows the latest information about them.
Price -> The price when the liquidity grab happened.
Size -> Size of the liquidity grab, determined by the wick-body ratio.
Status -> Shows the elapsed time of the liquidity grab.
🚩UNIQUENESS
Liquidity grabs can be useful when determining candles that have executed a lot of market orders, and planning your trades accordingly. This screener will find liquidity grabs from up to 5 tickers and give information about their price, size and status. The screener also lets you customize the pivot length and the wick-body ratio for liquidity grabs.
⚙️SETTINGS
1. Tickers
You can set up to 5 tickers for the screener to scan order blocks here. You can also enable / disable them and set their individual timeframes.
2. General Configuration
Pivot Length -> This setting determines the range of the pivots. This means a candle has to have the highest / lowest wick of the previous X bars and the next X bars to become a high / low pivot.
Wick-Body Ratio -> After a pivot has a false breakout, the wick-body ratio of the latest candle is tested. The resulting ratio must be higher than this setting for it to be considered as a liquidity grab.

Fair Value Gap Screener | Flux Charts💎 GENERAL OVERVIEW
Introducing our new Fair Value Gap Screener! This screener can provide information about the latest Fair Value Gaps in up to 5 tickers. You can also customize the algorithm that finds the Fair Value Gaps and the styling of the screener.
Features of the new Fair Value Gap (FVG) Screener :
Find Latest Fair Value Gaps Accross 5 Tickers
Shows Their Information Of :
Latest Status
Number Of Retests
Consumption Percent
Bullish & Bearish Volume
Customizable Algoritm / Styling
📌 HOW DOES IT WORK ?
A Fair Value Gap generally occur when there is an imbalance in the market. They can be detected by specific formations within the chart. This screener then finds Fair Value Gaps accross 5 different tickers, and shows the latest information about them.
Status ->
Far -> The current price is far away from the FVG.
Approaching ⬆️/⬇️ -> The current price is approaching the FVG, and the direction it's approaching from.
Inside -> The price is currently inside the FVG.
Retests -> Retest means the price tried to invalidate the FVG, but failed to do so. Here you can see how many times the price retested the FVG.
Consumed -> FVGs get consumed when a Close / Wick enters the FVG zone. For example, if the price hits the middle of the FVG zone, the zone is considered 50% consumed.
Bullish / Bearish Volume -> Bullish & Bearish volume of a FVG is calculated by analyzing the bars that formed it. For example in a bullish FVG, the bullish volume is the total volume of the first 2 bars forming the FVG, and the bearish volume is the volume of the 3rd bar that forms it.
🚩UNIQUENESS
This screener can detect latest Fair Value Gaps and give information about them for up to 5 tickers. This saves the user time by showing them all in a dashboard at the same time. The screener also uniquely shows information about the number of retests and the consumed percent of the FVG, as well as it's bullish & bearish volume. We believe that this extra information will help you spot reliable FVGs easier.
⚙️SETTINGS
1. Tickers
You can set up to 5 tickers for the screener to scan Fair Value Gaps here. You can also enable / disable them and set their individual timeframes.
2. General Configuration
Zone Invalidation -> Select between Wick & Close price for FVG Zone Invalidation.
Zone Filtering -> With "Average Range" selected, algorithm will find FVG zones in comparison with average range of last bars in the chart. With the "Volume Threshold" option, you may select a Volume Threshold % to spot FVGs with a larger total volume than average.
FVG Detection -> With the "Same Type" option, all 3 bars that formed the FVG should be the same type. (Bullish / Bearish). If the "All" option is selected, bar types may vary between Bullish / Bearish.
Detection Sensitivity -> You may select between Low, Normal or High FVG detection sensitivity. This will essentially determine the size of the spotted FVGs, with lower sensitivies resulting in spotting bigger FVGs, and higher sensitivies resulting in spotting all sizes of FVGs.

TwV Market Signals ScreenerMarket Signals Screener
This indicator allows traders to have a view of multiple pairs and timeframes Long/Short signals and specific information of parameters, based on the TwV Market Signals also developed by me and that can be found on my profile.
Full Screener Panel
This panel allows the trader to monitor multiple pairs at a single screen, giving an immediate vision of possible entries and exits (Long/Short). Moreover, allows traders to have handy all information of the TwV Market Signals Indicator that might be analyzed further for each pair. It has the following characteristics:
It can be placed anywhere on the screen through the main menu of the indicator.
It can be combined with the same indicator multiple times, as per screener is limited to show 40 pairs, you can select the number of panels being added to adjust position one next to each other.
It strengthens colors when a pair has changed its signals in order to the trader to know immediate changes and then do the follow up
The screener shows the pairs, which can be changed within the menus.
The screener shows the Long and Short Signals in its las column but previously, it shows the most critical parameters in the strategies (Market Signals Indicator) that determined the possible Long/Short position. Therefore, the EMAs, STOCH, SQZ, ADX, and TTM, are summarized in the screener for each pair.
For analyzing a specific pair, refer to the the Twv Market Signals Indicator, which is other indicator that might be on my TradingView Profile and that was used as base for the screener.
How to use this indicator and work with the strategies of the TwV Market Signals Indicator
The use of EMAs 10,20 and 50 draw the medium to long term trends, therefore avoiding signals against the trend. Furthermore, the EMAs will advise possible change in trends, especially considering the 10 and 20 cross, considering that crossing the 10,20 and 50, might confirm the change in med to long term trend change of the price. This is completely visual in the chart as it tints green for positive trend and yellow to red for negative trend.
The 200 SMA is included as it also gives better confirmation to the trend, the basics tell that when the EMAs mentioned above are below the 200 SMA then the likelihood for entries in long positions are not the best and vice versa for short.
Therefore, the trader shall filter Long and Short Signals accordingly as this EMAs are not used to send Long and Short signals considering that they confirm the trend in a slow pace and not reactively to the price volatility.
There are two strategies built-in within the indicator:
Strategy 1 – Longer time trades and high volatility handling
The Long and Short Signals are based on 14 and EMAs (by default). This two Mas are used to send signals based on their crossovers as they are way more reactive to the price movement.
Trader shall consider that EMAs are used for higher timeframes, therefore the indicator has the possibility to adjust the EMAs and use SMAs or WMAs instead for one or the two parameters (14 and 21).
WMAs react faster to the price volatility so the trader shall adjust this according to the timeframe being used. (Lower timeframes suggested).
This strategy is used for trades that might keep running for longer periods of times.
For reference on what the SMAs, EMAs and WMAs are, please see below sections in the description.
Strategy 2 - Shorter time trades and unhandled high volatility
The Long and Short Signals are bases on HMA. HMAs (Hull Moving Averages) track the price movement and volatility way faster that SMAs, EMAs and WMAs, therefore as the HMA follow the price quicker, it is intended for short time trades even in higher timeframes.
Scalping is not suggested using this strategy as HMA do not handle high volatility even on higher timeframes.
One of the biggest differences from the first strategy is that there is no more than a single HMA length to work with, which is 24 as default.
HMAs calculation is different to other MAs, therefore combining various HMAs lengths looking for crossovers become trend identification a lot less precise. HMAs are not intended to be used with different length crossovers.
Exit points = The use of Stochastic and VRVP
Stochastic RSI
It is well known that when Stochastic RSI resets when overbought or oversold therefore traders have within a summary box the possibility to check whether the K & D lines in the Stochastic RSI hace crossed over bullish or bearish.
Although the crossover is not mandatory for a change trend, the crossover might be used by the trader to exit a position considering that the price might move on the opposite direction.
Traders shall look at the summary box, where bullish and bearish crossovers are shown, so they evaluate their position exit.
Visible Range Volume Profile
The use of the VRVP is to find support and resistance on the price movements. Although high and lows are used as possible supports and resistances, VRVP shows an area of confluence on the order book, where volume of positions are accumulated and that might act as support or resistance depending on the price direction.
Traders can visually activate the VRVP to see the Point of Control (POC) directly on the chart as a line (similar as how a support or resistance would be drawn). Moreover, traders have the ability to see within the summary box, whether to see if the price is above or below the POC, so they clearly know if it is acting as support or resistance.
Price Direction
Trade the market trend is well known to be used to identify possible price direction. It is important not to confuse the longer time trend drawn by the EMAs with the TTM Trend bar color. The TTM trend colors bars according to the price direction, helping traders not to confuse when a red bar appears on an uptrend or green bars on a down trend.
This coloring helps traders not to exit trades based on bar coloring, which might psychologically affect when scalping or short-term trading specially.
Originally, the TTM trend is used considering the ADX in and indicator called TTM Squeeze, where the strength of the movement is measured, therefore although candle colors help with the price direction, ADX provides the trader the ability to see whether the direction is losing momentum and then catch the best possible exit before the direction change.
Terminology basics
Trend indicators
Exponential Moving Average (EMAs): The base indicator is composed of moving averages of 10, 20 and 55 exponential periods, to determine a possible bullish or bearish trend (EMA Crossing)
Simple Moving Average (SMA): The base indicator is composed of a moving average of 200 simple periods, which in conjunction with the EMAs can lead to estimate potential upward or downwards moves, as well as possible resistances. (SMA Positioning)
Weighted moving average (WMA): It is a technical indicator that traders use to generate trade direction and make a long or short position. It assigns greater weighting to recent data points and less weighting on past data points. (WMA Crossing)
Strength and S/R indicators
VPVR (Volume Profile Visible Range): It allows to determine the Point of Control (POC) which is the node with the highest volume profile. This can be used as an important retest point or to calculate potential support and resistance. The POC level is represented with a red dotted line in the graph.
The VPVR is a simplified version of the “TwV Multi-timeframe Dynamic VRVP” that you can find for free use in my profile. This version calculates the main’s timeframe POC and also has the possibility to be fixed range if the trader enables it from the menu. (Dynamic range by default).
ADX (Average Directional Index): The ADX helps the indicator to estimate the strength of the movement, always considering the DI+ and DI- to not go against the trend strength. This is represented as summary text in a table.
/
Exit indicator
Stochastic RSI: It is an indicator used in technical analysis that ranges between zero and a hundred and is created by applying the Stochastic oscillator formula to a set of relative strength index (RSI) values rather than to standard price data. Using RSI values within the Stochastic formula gives traders an idea of whether the current RSI value is overbought or oversold (Exit zones)
/
How to use Summary
1. Receive the Long or Short Signals using strategy 1 or 2, depending on the selected in the main menu of the indicator.
2. Evaluate the trend based on the 10,20, 50 and 200 MAs. Filter the Long and Short signals accordingly.
3. Monitor constantly the TTM Trend and the ADX for the direction and strength of the position entered and review if the momentum is being lost, considering step 4 or other possible reasons that might lead to exiting the position.
4. Once entered to a position evaluate constantly the Stochastic RSI bearish or bullish crossover or POC value on screen or summary box to exit the position.
5. Consider that for doing the evaluation individually, you shall use the TwV Market Signals.
BEST ABCD Pattern ScreenerHello ladies and gentlemen traders
Continuing deeper and stronger with the screeners' educational series one more time.
This one is heavy crazy mega cool (pardon my french).
I - Concept
I present to you, ladies and gentlemen, the first screener for harmonic patterns.
Starting with an ACBD pattern screener this time!!
I used the calculations from Ricardo Santo's script
In short, he's using fractals (regular or Bill Williams ) for the pattern calculations. A masterpiece !!!
The screener will show in 1 consolidated chart the ABCD patterns for 5 selected assets. Could be stocks, forex, crypto, whatever you feel like making money with
II - Definitions
The ABCD pattern ( AB=CD ) is one of the classic chart patterns which is repeated over and over again.
The ABCD pattern shows perfect harmony between price and time.
More info here
The Williams Fractal is an indicator, developed by Bill Williams, that aims to detect reversal points (highs and lows) and marks them with arrows.
Up fractals and down fractals have specific shapes. The Williams Fractal indicator helps users determine in which direction price will develop
Source: www.tradingview.com
III - How did I set the screener
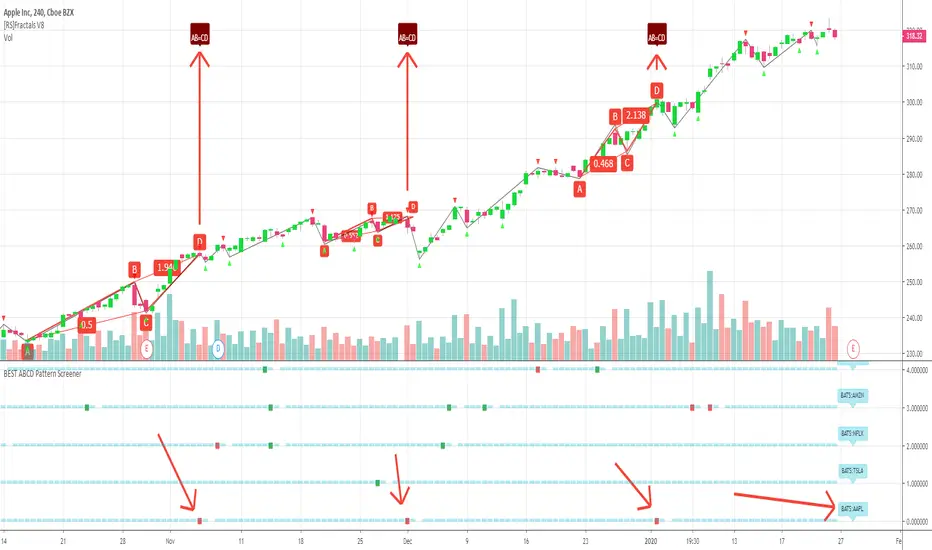
The visual signals are as follow:
- square: whenever there is an ABCD pattern detected
Then the colors are:
- green when a bullish pattern is detected
- red when a bearish pattern is detected
🔸 The script screenshot shows two red squares matching two ABCD bearish pattern from the above panel. As the chart is showing APPL, I highlighted where the screener mentioned the fruit stock ( APPLE, pun, bad joke, Dave out...)
🔸 I tried to make it as clear as I could with red arrows
Once again, we pushed together the limits of pine script beyond of what we thought was possible, beyond the realm of this world, reaching finally the dreamt pine script heaven (am I going too far? feel free to tell me)
Best regards,
Dave
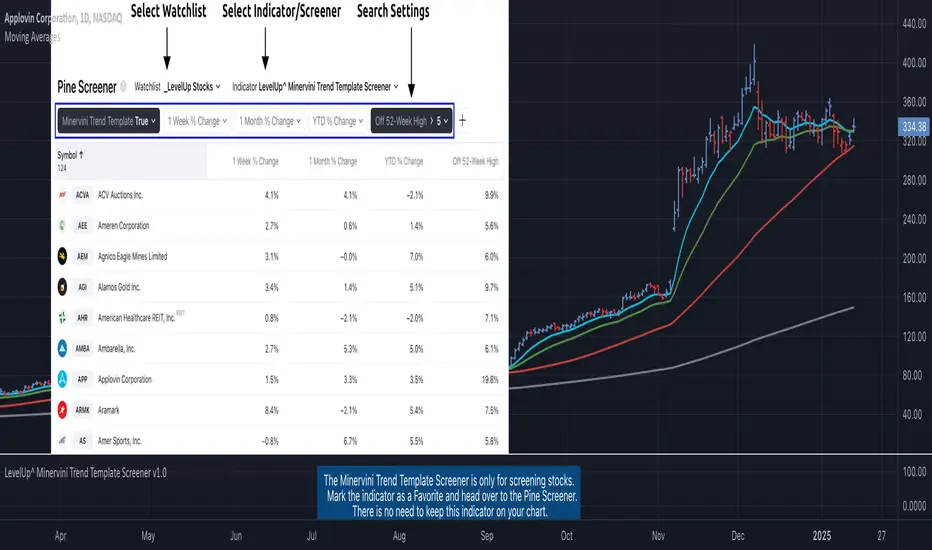
Minervini Trend Template Screener [LevelUp]The Minervini Trend Template is a stock screener based on the work of Mark Minervini, a two-time winner of the U.S. Investing Championship. The goal is to identify stocks that are in strong uptrends.
Historical analysis demonstrates that nearly all of the highest performing stocks exhibited a strong uptrend prior to making significant advances. Based on Mark's research, 99% of these stocks were trading above their 200-day simple moving average, and 96% were above their 50-day simple moving average, prior to becoming true market leaders.
🔹 Minervini Trend Template Requirements
✓ Price is above the 150-SMA and 200-SMA.
✓ 150-SMA is above the 200-SMA.
✓ 200-SMA is trending up for at least one month.
✓ 50-SMA is above the 150-SMA and the 200-SMA.
✓ Price is above the 50-SMA.
✓ Price is within 25% of the 52-week high.
✓ Price is 30%+ above the 52-week low.
🔹 Screening Features - Setting Your Search Criteria
There are various search options that can be customized.
▪ Symbol Type
The screener supports all equity types from stocks to ETFs to crypto. You can narrow the scope of your search by choosing only the symbol types of interest.
▪ Percent Change - Weekly, Monthly and YTD
Further narrow your search by specifying minimum percent changes on a weekly, monthly and/or year-to-date basis.
▪ Distance From 52-Week High
The screener looks for stocks within 25% of their 52-week high, as defined by Mark's Trend Template. You can further tighten this criteria by specifying a smaller percentage, for example, search for stocks within 5% of their 52-week high.
🔹 Installation And Usage
▪ Mark this indicator as a Favorite.
▪ Use the Pine Screener to search for stocks.
▪ Save the search results to a watchlist.
▪ View the watchlist in TradingView.
🔹 Note
The Trend Template as originally defined by Mark included an RS Rating based on a proprietary calculation from Investor's Business Daily. My preference in technical analysis and screening is to only use tools and calculations that can be researched and verified. There is no RS Rating requirement in this screener. All the other Trend Template requirements are included.
Custom Multi-Timeframe Screener with AlertsThis is a multi-timeframe screener with alerts. Use this way you can create a screener on indicators using 2 or more timeframes.
In TradingView there is a limit of 40 security function calls. Every timeframe requires another security call so you can screen fewer symbols with any additional timeframe.
In this example, I use 2 timeframes, so the maximum amount of symbols you can scan is 40/2 = 20.
For 3 timeframes - 13, 4tfs - 10, 5tfs - 8 symbols and so on.
In this simplistic example, I require a cross of EMAs on the current timeframe and confirmation that one EMA above/below another from the second timeframe.
Of course, you can create much more complicated functions for this screener.
Params
- higher timeframe
- ema params
- 20 symbol inputs for instruments you want to use in this screener
Alerts
You can create an alert from it easily by selecting the screener name from the list and then selecting "Any alert() function call".
No additional configuration is required, message and alert on close is generated in the code.
You should better change the default name for your alert. Sometimes because of big amount of inputs you might receive an error.
Disclaimer
Please remember that past performance may not be indicative of future results.
Due to various factors, including changing market conditions, the strategy may no longer perform as good as in historical backtesting.
This post and the script don’t provide any financial advice.

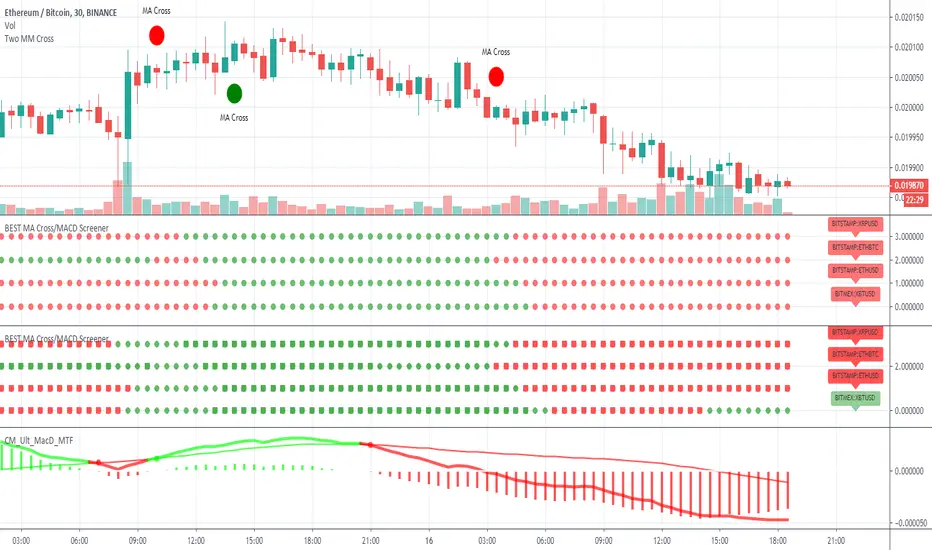
BEST MA Cross/MACD ScreenerHello traders
Continuing deeper and stronger with the screeners' educational serie one more time
I - Concept
This is the first flexible screener I'm releasing. Screener detecting a convergence whenever the MACD and MM cross are giving a signal in the same direction.
Those who know me from TradingView ... are aware that I'm big on convergences. I totally think that 1 indicator isn't enough - whatever the timeframe.
But building my own convergence detection systems has been fruitful for me
II - How did I set the screener
The visual signals are as follow:
- square: MACD + MA cross convergence.
- diamond: Only MACD is selected
- circle: Only MA cross is selected
Then the colors are:
- green when bullish
- red when bearish
Example
Below, I highlighted why we see diamonds on the top screener panel. This is because I only selected the MACD filter
Cool Hacks
Don't forget that you can add the same indicator multiple times on your chart :)
Wishing you all the BEST trading
Dave
BEST Long Term Levels Breakout ScreenerHello traders
Continuing deeper and stronger with the screeners' educational serie one more time (#daft #punk #private #joke)
We don't have to wait for TradingView to allow screener based on custom indicator - we can build our own ^^
I - Long Terms concept
I had the idea from @scarff.
I think it's genius and I use this long terms level in my trading across all assets.
The screener, in particular, analyzes whenever the price breaks out a weekly/monthly/quarterly/yearly level on candle close .
Triggering events on candle close = we get rid of the REPAINTING = we remove the fake signals (in that case the fake breakouts).
The candle close is based on the close of the current chart => if the chart displays candlesticks on the weekly timeframe, then the considered close will be the weekly close.
If in daily timeframe, the close will be .............................. 4h (#wrong)..... kidding :) .............. DAILY obviously
II - How did I set the screener
The visual signals are as follow:
- square: breakout of a high/low weekly level
- circle: breakout of a high/low monthly level
- diamond: breakout of a high/low quarterly level
- flag: breakout of a high/low yearly level
- dash: none of the above
Then the colors are:
- green when bullish
- red when bearish
- orange/dash when none of the above
Cool Hacks
"But sir... what can we do with only 3 instruments for a screener?" I agree not much but...
As said previously... you can add multiple times the same indicator on a chart :)
Wishing you all the BEST trading and.... wait for it... BEST weekend
Dave

Upside Reversal ScreenerIndicator mainly intended to be used in Pinescript screener to find Upside Reversals - where an instruments drops in price then reverses.
The minimum drop (as % or % of instrument ATR) and minimum recovery (as fraction of drop) can be specified.
When used as an indicator (Set the "Running in Screener" input to False in the settings) an up arrow will show under the days where an upside reversal occurred.
To use in a screener, set it as a favourite indicator, so it will be showin in the PineScript screener.
The indicator publishes the Open, High, Low, Close (or last) prices, % price change, % of drop (from high), the recovery (as % of drop), and if the stock matched the reverse settings.

Divergence for Many Indicators v4 Screener▋ INTRODUCTION:
The “Divergence for Many Indicators v4 Screener” is developed to provide an advanced monitoring solution for up to 24 symbols simultaneously. It efficiently collects signals from multiple symbols based on the “ Divergence for Many Indicators v4 ” and presents the output in an organized table. The table includes essential details starting with the symbol name, signal price, corresponding divergence indicator, and signal time.
_______________________
▋ CREDIT:
The divergence formula adapted from the “ Divergence for Many Indicators v4 ” script, originally created by @LonesomeTheBlue . Full credit to his work.
_______________________
▋ OVERVIEW:
The chart image can be considered an example of a recorded divergence signal that occurred in $BTCUSDT.
_______________________
▋ APPEARANCE:
The table can be displayed in three formats:
1. Full indicator name.
2. First letter of the indicator name.
3. Total number of divergences.
_______________________
▋ SIGNAL CONFIRMATION:
The table distinguishes signal confirmation by using three different colors:
1. Not-Confirmed (Orange): The signal is not confirmed yet, as the bar is still open.
2. Freshly Confirmed (Green): The signal was confirmed 1 or 2 bars ago.
3. Confirmed (Gray): The signal was confirmed 3 or more bars ago.
_______________________
▋ INDICATOR SETTINGS:
Section(1): Table Settings
(1) Table location on the chart.
(2) Table’s cells size.
(3) Chart’s timezone.
(4) Sorting table.
- Signal: Sorts the table by the latest signals.
- None: Sorts the table based on the input order.
(5) Table’s colors.
(6) Signal Confirmation type color. Explained above in the SIGNAL CONFIRMATION section
Section(2): Divergence for Many Indicators v4 Settings
As seen on the Divergence for Many Indicators v4
* Explained above in the APPEARANCE section
Section(3): Symbols
(1) Enable/disable symbol in the screener.
(2) Entering a symbol.
_______________________
▋ FINAL COMMENTS:
For best performance, add the Screener indicator to an active symbol chart, such as QQQ, SPY, AAPL, BTCUSDT, ES, EURUSD, etc., and avoid mixing symbols from different market allocations.
The Divergence for Many Indicators v4 Screener indicator is not a primary tool for making trading decisions.

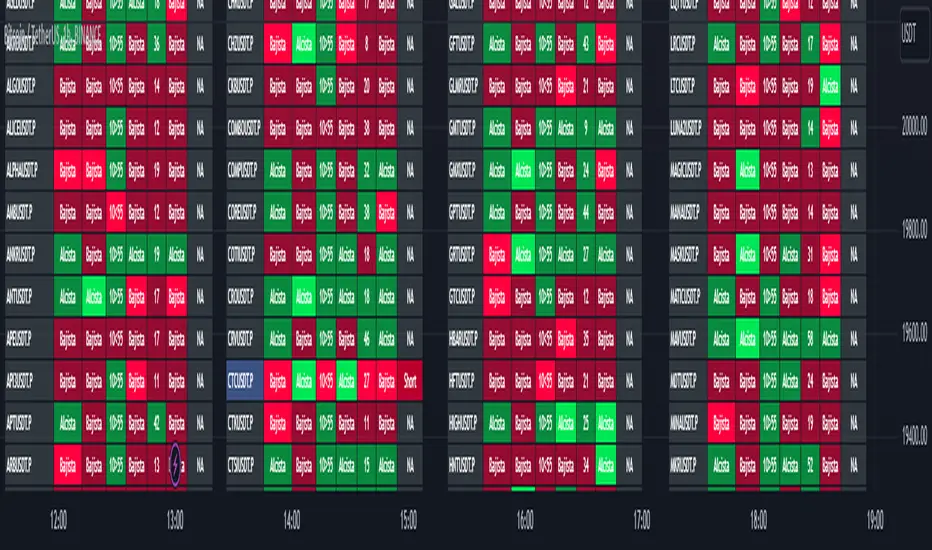
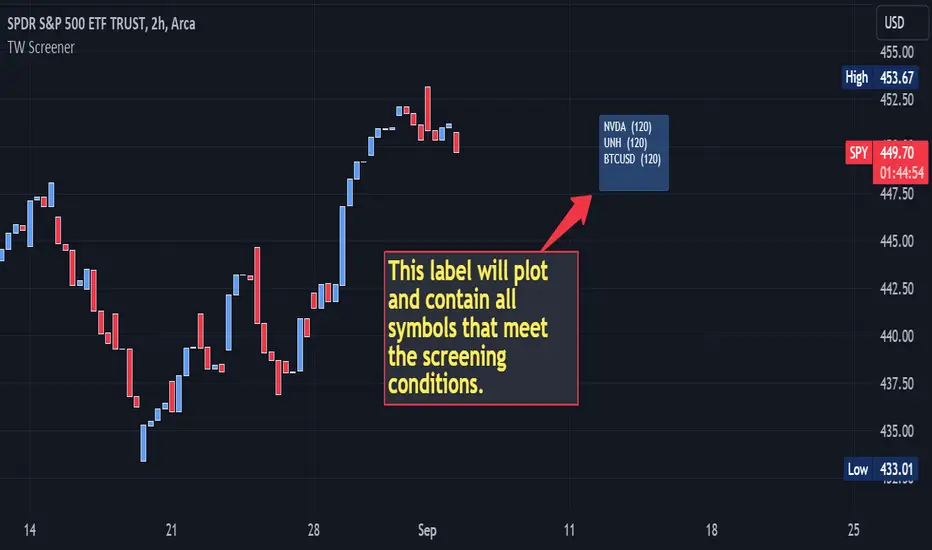
Multi-Symbol Indicator Screener w/ Alert [TradingWhale]This screener allows to screen multiple (up to 40) symbols for a condition defined by the user, including some other indicator plot values (not all of them) and their relation to other indicator plot values (data sources) or to absolute values defined in the condition.
It plots a label and adds the symbols and chart time frames to the label for those symbols that meet the screening condition. There are some examples further below.
The indicator / screener is designed to use other indicators as a data source, where possible.
On the label the symbols represent stock symbols. The numbers represent the chart time frame in which the condition was screened. (30) = 30 minutes, (120) = 120 minutes, (D) = 1 day, (3D) = 3 days, (W) = 1 week, and so forth.
Requirements:
- the indicators you want to use as source data need to be on the same chart as the screener, but not in the same pane.
- It will not work for all 3rd-party indicators.
The script provides the specific capabilities detailed below:
1. Data inputs:
- add up to 40 symbols to be screened
- check field for each symbol allow the user to enable/disable screening for each symbol individually
- ability to add up to two (2) external source data that can be compared to each other, where possible, by a logical operator or compared to an absolute value
- a check field to select whether the logical operation takes places between Source #1 and Source #2 or between Source # 1 and an absolute value.
- users can also define how far from the last bar the label is plotted on the chart
2. Operations available, whenever possible based on source data:
- "crossing"
- "cross up"
- "cross down"
- "rejected from resistance (Source #1) in the last bar", which means "High was above Source #1 (resistance level) in the last completed bar and 'close' (current price of the symbol) is now below Source #1" (resistance level).
- "rejected from resistance (Source #1) in the last 2 bars", which means "High was above Source #1 (resistance level) in one of the last two (2) completed bars and 'close' (current price of the symbol) is now below Source #1" (resistance level).
- "rejected from support (Source #1) in the last bar" --- similar to above except with Lows and rejection from support level
- "rejected from support (Source #1) in the last 2 bars" --- similar to above except with Lows and rejection from support level
- "greater than"
- "less than"
- "is up"
- "is down"
- "is up %"
- "is down %"
Screening examples could be:
- Source #1 "crossed up" Source #2
- Source #1 is "greater than" 20
3. Output:
a. Label
The label can be modified in terms of colors and position (how many bars away from the last bar)
b. Alerts
- Get alerted if one or more symbols meet the condition.
- To set up the alert visit the alerts setup screen in TV and select this screener.
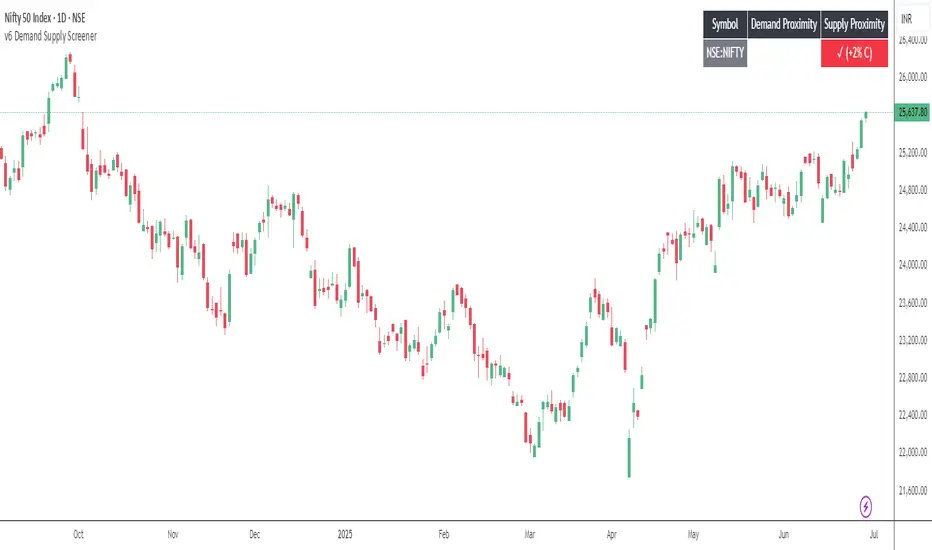
Demand Supply Screener 1.0The Demand Supply Screener helps in identifying symbols that are trading close to or inside Demand Supply Zones. You can provide a list of up to 40 symbols to the screener.
The more the number of symbols or smaller the time frame, the longer it will take for the screener to shortlist symbols. This can result in a calculation timeout. In such a case, you can reduce the number of symbols in the list by splitting it into multiple charts/indicators until the error is resolved.
Use "Proximity %" to filter symbols, for example, if you set it to 2%, the screener will shortlist symbols where the high/low of the time frame you are on is within 2% proximity of the supply/demand zone respectively.
For shortlisting symbols that are currently touching demand supply zones or trading inside of them use Proximity % as 0 and ensure Show Tested Zones is enabled.
Degen Screener – ALTs vs. BTCDegen Screener – ALTs vs. BTC
🛠️ What This Script Does:
This multi-asset screener monitors up to 10 cryptocurrencies and compares their RSI strength relative to Bitcoin (BTC) — acting like BTC is the "north star." It's perfect for catching early shifts in momentum across the crypto market.
🎨 Color Logic:
RSI Column:
RSI < 30 → Green (oversold)
RSI > 70 → Red (overbought)
In between → Gray
Relative RSI Column:
0 → Green (stronger than BTC)
< 0 → Red (weaker than BTC)
Trend Column:
🤑 → Bullish shift (green background)
🖕 → Bearish shift (red background)
🔔 Alert Conditions:
Alerts fire when all three of these are true:
RSI is below 30 (oversold)
The asset is stronger than BTC
Momentum is turning bullish (🤑)
Perfect for spotting early reversals in oversold altcoins.
✅ How to Use:
Add the script to any chart (doesn’t matter which asset)
Customize the list of up to 10 symbols
Set your timeframe
Enable the alert condition: Relative RSI Signal
💡 Notes:
Script runs on whatever chart you’re on, but it pulls data from the 10 assets you select on your indicator.
⚠️ Disclaimer:
This tool is for educational and informational purposes only. It is not financial advice. Always do your own research.

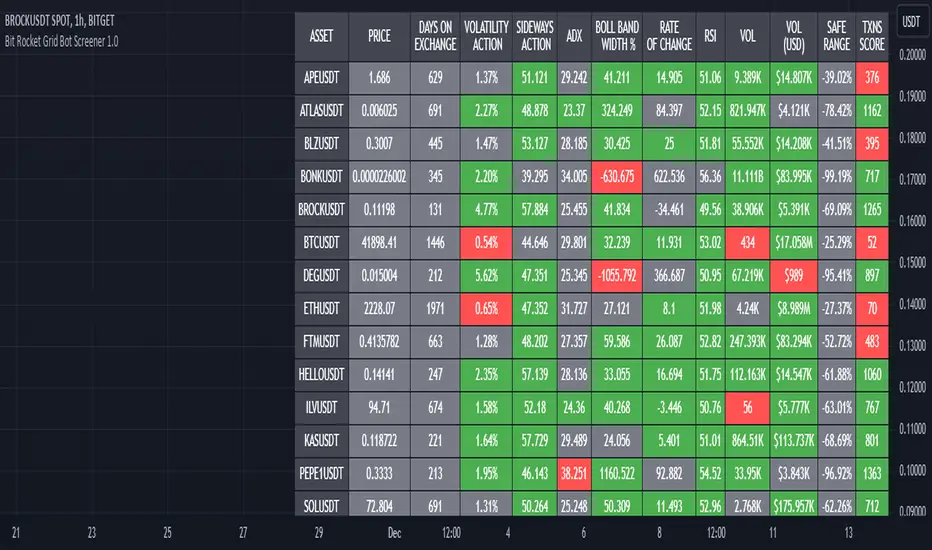
Bit Rocket Grid Bot Screener 1.0DESCRIPTION
A grid bot is an automated trading bot that is designed to execute buy and sell orders based on a pre-defined grid of prices. Grid bots operate within a specified price range, placing trades at set intervals above and below the current market price. The key idea behind a grid bot is to take advantage of price fluctuations and market volatility, not looking for trends or breakouts.
The optimal trading pair for a grid bot is one that exhibits frequent oscillations within a predictable range while demonstrating a slight upward trend. In simpler terms, it's a pair that consistently fluctuates within the same range.
The Grid Bot Screener serves as a valuable tool for identifying the most suitable trading pairs, by showing the indicators that matter the most for sideways Grid Bot trading. Most screeners look for trends, breakouts and use indicators that are used for assisting the trader with when to buy and sell. This indicator assists in the selection of pairs that are likely to yield the best results for high volatility sideways trading.
USAGE
This screener looks at volatility, sideways action, ADX, and other indicators that are most helpful when determining the amount and potential volatility, sideways action, and transactions for up to twenty pairs at a time.
Each indicator has a threshold that the user can set themselves, this way the user is in control when comparing or hunting for the optimal pairs.
User selects up to twenty pairs, sets thresholds if different than defaults, then sets length (how far back to look). Once this is set the user can quickly look and compare the results.
KEY INDICATORS
VOLATILITY ACTION - Percentage of Price Action Volatility; Temporal Volatility Trends; Elevated price action signifies accelerated price fluctuations, disregarding directional cues.
SIDEWAYS ACTION - The higher the value, the greater the horizontal movement; a robust trend, which is not our objective, provides no directional insight.
Values exceeding 45 indicate pronounced sideways activity, while lower values approaching zero signify a vigorous trend.
These values do not assist in determining the trend direction.
Higher values imply a more sideways orientation, whereas lower values indicate a more pronounced trend.
ADX - Does not indicate trend direction; instead measures trend strength.
An indicator for price range
Lower values signal a weak trend
Higher values denote a robust trend
Strategy: Look for values of 25 or lower which indicate a ranging or neutral trend.
TXNS SCORE – Transaction Activity.
TXNS indicator represents grid performance and serves as a direct measure of trading activity. TXNS accumulates the number of buy and sell actions, reflecting the user-defined grid percentage.
Elevated transaction numbers signify increased activity, leading to enhanced bot profitability.
NOTE: For an accurate representation of the actual number of transactions, use the Bit Rocket Transactions indicator on the 30min time frame.
CONFIRMATION INDICATORS
While the key indicators are generally reliable on their own, it's also valuable to assess how well the asset is performing and its historical trajectory. The confirmation indicators provide valuable insights into an asset's performance and direction, reinforcing the assessments made through the key indicators, again these indicators on their own are not enough they must be used in conjunction with the key indicators.
VOL - Trading Activity: For assets engaged in sideways trading, sufficient volume is necessary, but it doesn't need to be as high as you might expect.
VOL(USD) - USD-Based Activity: A high USD volume signifies strong market interest.
ROC - Rate of Change Percentage: This metric calculates the percentage change in price over a specified date range. Shows trend direction using price percentage.
• Avoid extremely high or extremely low values.
o Excessively high values may indicate overbought conditions with potential for a price correction.
o Very low values could imply waning interest and diminished asset value.
o Conversely, high values might indicate asset strength, while low values could suggest that the asset has reached a bottom and is unlikely to decrease further.
BOLLINGER BAND WIDTH PERCENT - Average MACD Percentage Width, percent is used with Bollinger bands to allow for comparison with other assets.
RSI - Buying and Selling Pressure Strength: When assessing RSI, look for a balance between buying and selling pressure while still maintaining high volatility and sideways strength. Key RSI levels to consider:
• 40-60: Neutral range, indicating equilibrium and stability.
• Above 70: Approaching overbought conditions.
• Below 30: Nearing oversold conditions.
These confirmation indicators provide valuable insights into an asset's performance and direction, reinforcing the assessments made through the key indicators.
ADDITIONAL INDICATORS
DAYS ON EXCHANGE – This metric reveals how long the crypto pair has been listed on the exchange. It serves multiple purposes, such as assessing the data's historical depth and indicating whether the crypto might be relatively new. Keep in mind that while the asset could exist for a while, it might not have been available on the exchange for an extended period.
PRICE – This merely states the current price, making it suitable for those focusing on price action, it is provided for informational value only.
SAFE RANGE – This percentage indicates the price movement range from the highest to the lowest within a specified data range. Use this to determine the upper and lower levels for setting up your grid range.
How To Input CSV List Of Symbol Data Used For ScreenerExample of how to input multiple symbols at once using a CSV list of ticker IDs. The input list is extracted into individual ticker IDs which are then each used within an example screener function that calculates their rate of change. The results for each of the rate of changes are then plotted.
For code brevity this example only demonstrates using up to 4 symbols, but the logic is annotated to show how it can easily be expanded for use with up to 40 ticker IDs.
The CSV list used for input may contain spaces or no spaces after each comma separator, but whichever format (space or no space) is used must be used consistently throughout the list. If the list contains any invalid symbols the script will display a red exclamation mark that when clicked will display those invalid symbols.
If more than 4 ticker IDs are input then only the first 4 are used. If less than 4 ticker IDs are used then the unused screener calls will return `float(na)`. In the published chart the input list is using only 3 ticker IDs so there are only 3 plots shown instead of 4.
NOTICE: This is an example script and not meant to be used as an actual strategy. By using this script or any portion thereof, you acknowledge that you have read and understood that this is for research purposes only and I am not responsible for any financial losses you may incur by using this script!

40+ Coin Screener (workaround to 40 Security Limit Per Script) This is a far inferior method for a screener/scanner (compared to my first publication) but after looking at that script from a noobs eyes again, I could see how this form would be a lot easier to take in/understand so wanted to publish it. Everything that I could think of to mention about this is in my 1st pub so ill leave it to you to check it out...though I did include some comments in the script. It is pretty straight forward but if you have any questions don't hold them in. I'll answer them if I can. The only thing that is not in this one is setting up the alert feature so that you only have to create 1 alert per iteration of the script and it takes care of all of the coins for that iteration/set that is chosen in the settings (so please see previous script if would like to do this for your screener/scanner).
To be PERFECTLY CLEAR, the workaround is to the issue of not being able to scan but only 40 coins per script. You can scan more than 40 per script but only if you create "batches" or "sets" that the user can select within the settings which set to use for each iteration of the script on the chart. That being, you have to the script multiple times to the chart and merge them into 1 window and merge the scales (instructions in first publications). Here in this script I am scanning 72 different coins that are the Margin Coins on KUCOIN. I have split them up into 3 sets (24 coins per set). I could have made 2 sets but the script will be slower to load and to respond (like, when it comes to receiving alerts), thus I split them up the way I did. If you want to change any of this there are slightly more details in the previous script.
One great use-case that I LOVE about this particular version (and the way I use it) is right at the end of when I see a whole market dump/pump coming to an end and want to know which horse to bet on. Used to think whichever coin come out the fastest from the dump was the one to bet on but quickly learned that 1-2 (or even a few) hrs needs to go by first bc the ones that look the strongest in the beginning are NOT the ones to have performed the best when viewing the results 12 hrs later. IN FACT, many instances of using this exact script for reasons as such has taught me that the manipulators (I believe this to be the case as least) WANT everyone to bet on these that come out the gate the hardest and thus they make them move REALLY hard in the beginning then they QUICKLY become stagnant (moreso, they become WORSE than stagnant, they actually quickly retrace to put you into the negative so that you get out to get into the others now moving (to provide the market with more liquidity. They WANT you to get into a coin thats moving crazy hard so that they can then cease that movement once many fall for the trick just to then make that once strong looking coin now stagnant and make others move crazy hard. They wait for you to get out of the 1st and into the next set of movers just to do this time and time again bc hey, what are we sheep good for other than to provide the big guns with liquidity, am I right? Thats rhetorical, which you would know if you've ever had this happen to you (without a doubt MANY of you have). Let this script (above all other things) provide good evidence to back up this cynical way of viewing the markets to anyone that is questioning it.
This prolonged time between when the dump is over and when the ACTUAL movers REALLY start moving can actually be of great benefit to us sheep if used correctly, Firstly, it gives us some time to determine if when we thought was the bottom, ACTUALLY was the bottom. That bottom is easily determined if there are no (or very few) coins that went any lower than the point in time that the script began calculating on. Secondly, it allows us time to wait for the REAL movers and shakers to start moving and shaking.
One new feature that I LOVE that TV has implemented is the ability (once the script is added to the chart) to be able to click a point in time on the chart where you want the script to begin its calculations. If this point needs to be changed at any point in time then you can either go into the setting and input the time you wish or simply remove the script and add it again so that you are prompted to select another point in time. Ok, I think that everything I wanted to say. The next version that I will add will be probably my favorite and most used by yours truly...not to mention unique in a way that I have yet to see an implementation anything like it in all of TV's public library. Not to say its not there, but I have yet to come across it and I have DEFINITELY done my fair share of searching for it when I couldn't figure out how to code it for the longest time (though, I was and still am a noob so might get some great feedback on better ways to approach it, but we'll save that jabbering for the next of the publications.
I hope each and every one of ya'll (yes, Im from the South) have the GREATEST of Thanksgivings (if in the US that is...I graced my parents with the best gift anyone could have given them 35 years ago on Thanksgiving....MEEEE ;) So I will sure as hell be having a great holiday. Thanks for checking out my script...you can "like" and leave a comment if you so feel the urge to...or not. Im not doing this for me, but rather to stretch my arms out as far as possible to benefit the most people as possible and more people would see the script if it has more likes/comments/traffic pointing towards it...not to mention as other publishers have...it IS gratifying to see a few likes in my side window, which btw, I have MANY more variations and completely diff types of scanners/screeners Ill be publishing in the future and to know that they've become of use....I"VE become of use to the community is very....pleasing to me and does (as I've also seen many publishers mention as well) drive me to want to publish ones that I originally thought I would keep for myself. Peace out people.

SuperTrend - Custom Screener and Dynamic AlertsTrading View today published a desktop Bad Internet connection indicator ?! which set me thinking…
Despite recently introduced Dynamic Alerts many scripts do not leverage the information available for active traders and traders on the GO!
So decided to share this script totally ALERT focused on one of the most popular DAY trading indicators.
Of course no more BAD internet problem as long your TV APP is configured , you will have enough data for a mental picture of the chart..
The Alerts give you the BAR Close , %percent gain or loss over previous day CLOSE ++ Previous Day High and Low to effectively plan your trade without a chart!(just in case)
2 additions in the way Alerts are delivered over the last script :
1. You get SUMMARY alerts or concatenated alerts by default , however if you uncomment or activate code lines 48 and 55 you will get individual Stock alerts Too!
2. Summary Alerts will come only if there is some Buy or Sell signal NO more empty Alerts!
Few useful EXTRAS in the code :
1. Flexible code can convert any indicator to screener or Alert function.
2. You will NOT get Mutable Variable error while converting any indicator to screener as long as the function is in "GLOBAL" scope..
3. Many Custom Screeners are available but few give OHLC data in output so easily…and very difficult for traders to MODIFY hundreds of lines of code..
4. For UP or DOWN on SCREEN Stock monitoring copy /paste functions in line 41 and 42 in lieu of CROSS functions in 44 and 51 respectively..
5. You can also uncomment/activate lines 66 and 67 for labels in monitoring.
6. The default mode of the scripts is set to Alerts!
Max Stocks only 20!
Finally idea is to help traders to use the great features that TV works so hard to create and constantly improvise.
Enjoy Profitable Trading on the Fly !!

Best Ichimoku ScreenerHello traders
Continuing deeper and stronger with the screeners' educational series one more time
I - Concept
This screener detects whether the price goes above, below or stays in between the Ichimoku cloud
II - How did I set the screener
The visual signals are as follow:
- square: Above or Below
Then the colors are:
- green when above the cloud
- red when below the cloud
- orange when in the cloud
Best regards,
Dave

RSI Divergence Screener by zdmreThis screener tracks the following for up to 20 assets:
-All selected tickers will be screened in same timeframes (as in the chart).
-Values in table indicate that how many days passed after the last Bullish or Bearish of RSI Divergence.
For example, when BTCUSDT appears Bullish-Days Ago (15) , Bitcoin has switched to a Bullish Divergence signal 15 days ago.
Thanks to @QuantNomad and @MUQWISHI for building the base for this screener.
*Use it at your own risk
Note:
Screener shows the information about the RSI Divergence Scanner by zdmre with default settings.
Based indicator:

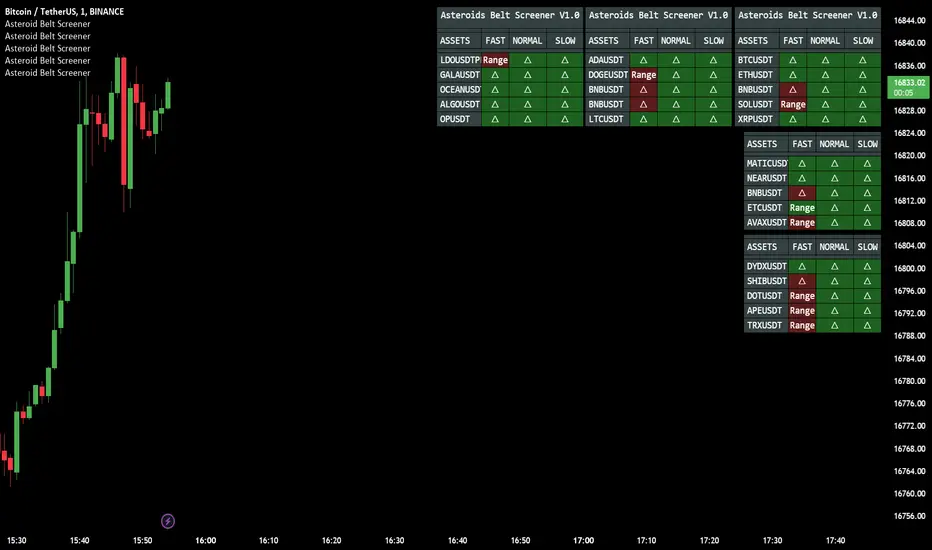
Asteroid Belt ScreenerAsteroid Belt Screener Observe the market in relation to the dynamic trend strength Asteroids Belt indicator, reference for trend trading opportunities.
SCAN MULTI ASSETS WITH ALL 3 RESPONSIVE TIMES ALL AT ONCE
The New Compliment Indicator to the much loved Asteroids Belt, providing a unique way to scan the market, never miss an opportunity with multi Asset Alerts and customizable display.
With additional Pre configured Aggregators, users of asteroids belt will be pleased to know that the indicator does come with 50 automated aggregation settings,
Using the custom position coordinates X,Y users can load multiple instances of the screener, choose individual assets, place them on their chart as they wish and scan for 5 assets PER screener.
Users can also choose to use assets outside of the list of 50, and control the aggregators manually, this allows for complete customization with no limit to symbols.
Users are also given the chance to set alerts for the following:
Alerts
Bullish Trend: Fast,Normal Slow (belt trend color change)
Bearish Trend: Fast,Normal Slow (belt trend color change)
Entering Belt: Fast Normal Slow (belt level detections)
Leaving Belt: Fast,Normal Slow (belt level detections)
TO DO:
Additional alerts e.g. fast trend green with red slow belt. Allowing for filtered opportunities.
Increase pre made aggregator asset lists, and improve.
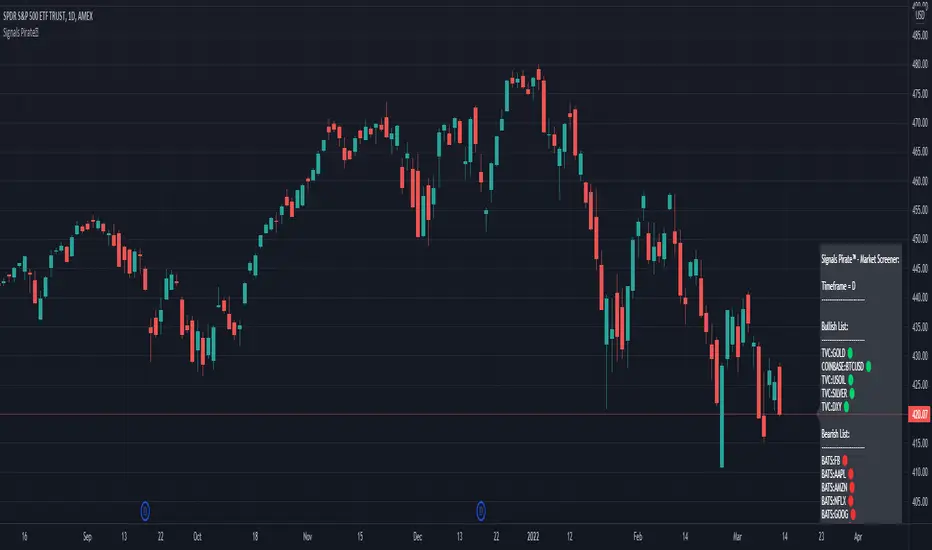
Signals Pirate™ Market ScreenerSignalsPirate™ Market Screener provides users with the ability to quickly and easily check the current trend of up to 40 different assets on any timeframe! With a simple ‘Bullish’ or ‘Bearish’ trend easily defined using accurate and reliable calculations, this tool could massively cut down the amount of time your TA takes!
The main Input options are 'Reactivity' and 'Depth', which allow for a dynamic trend following strategy that works on all time frames and assets. Using these values the strategy will print the bundles main ‘Buy’ and ‘Sell’ signals to try and identify the trend early and accurately. Their main functions are to dynamically calculate volatility and current trend direction – but we’ve gone more in-depth below!
Reactivity:
Reactivity controls how quickly the Algo reacts to changes in trend. This part of the bundle takes into account the Average True Range (ATR) to gauge current market volatility and direction of the trend. Lowering the reactivity value will generate quicker reaction times of the algorithm as it will lower the threshold of volatility required for a signal to be generated. Therefore, it’ll show trades more frequently.
Depth:
Depth controls the position of the signals according to the trend swing. Calculated using a variation of the Average Direction Index (ADX) to measure the changes in prices over a given period, when running parallel to the Reactivity volatility filter the trend can be identified quickly and accurately on any given time frame or asset. Higher Depth will allow for less frequent and slower entries. In contrast, lower Depth will give more frequent and earlier entries.
The default settings are the best settings we’ve found so far but you can change them to build your own unique trading strategy. We’d recommend experimenting with these values to find the best results for the asset you are trading, and your own personal trading and investing style.
Direction for use:
1. Use on any asset class and time frame and add the tickers of any asset you want included in the screener.
2. Fine tune the Reactivity (volatility) and Depth (trend sensitivity).
3. Consider longing assets that appear in the ‘Bullish List’ after candle close, and consider shorting assets that appear in the ‘Bearish List’ after candle close.
4. Exit positions once an asset has switched from one list to the other.
As mentioned previously, this Market Sceener uses a trend base system that dynamically operates to function with superior accuracy regardless of what you’re trading. But with the level of customisation available, this can easily be fine tuned to accommodate scalping, reversal trading, or even long term investing.
We hope you love this Screener, and it takes your trading and investing to the next level. Please let us know if you have any questions or queries regarding the logic behind the bundle, or if you have any suggestions for improvements etc. We love your feedback and are constantly striving to continuously improve!