One for AllOne for All (OFA) - Complete ICT Analysis Suite
Version 3.3.0 by theCodeman
📊 Overview
One for All (OFA) is a comprehensive TradingView indicator designed for traders who follow Inner Circle Trader (ICT) concepts. This all-in-one tool combines essential ICT analysis features—sessions, kill zones, previous period levels, and higher timeframe candles with Fair Value Gaps (FVGs) and Volume Imbalances (VIs)—into a single, highly customizable indicator. Whether you're a beginner learning ICT concepts or an experienced trader refining your edge, OFA provides the visual structure needed for precise market analysis and execution.
✨ Key Features
- 🏷️ Customizable Watermark**: Display your trading identity with customizable titles, subtitles, symbol info, and full style control
- 🌍 Trading Sessions**: Visualize Asian, London, and New York sessions with high/low lines, range boxes, and open/close markers
- 🎯 Kill Zones**: Highlight 5 critical ICT kill zones with precise timing and visual boxes
- 📈 Previous Period H/L**: Track Daily, Weekly, and Monthly highs/lows with customizable styles and lookback periods
- 🕐 Higher Timeframe Candles**: Display up to 5 HTF timeframes with OHLC trace lines, timers, and interval labels
- 🔍 FVG & VI Detection**: Automatically detect and visualize Fair Value Gaps and Volume Imbalances on HTF candles
- ⚙️ Universal Timezone Support**: Works globally with GMT-12 to GMT+14 timezone selection
- 🎨 Full Customization**: Control colors, styles, visibility, and layout for every feature
🚀 How to Use
Watermark Setup
The watermark overlay helps you identify your charts and maintain focus on your trading principles:
1. Enable/disable watermark via "Show Watermark" toggle
2. Customize the title (default: "Name") to display your trading name or account identifier
3. Set up to 3 subtitles (default: "Patience", "Confidence", "Execution") as trading reminders
4. Choose position (9 locations available), size, color, and transparency
5. Toggle symbol and timeframe display as needed
Use Case: Display your trading principles or account name for multi-monitor setups or content creation.
Trading Sessions Analysis
Sessions define market character and liquidity availability:
1. Enable "Show All Sessions" to visualize all three sessions
2. Adjust timezone to match your local market (default: UTC-5 for EST)
3. Customize session times if needed (defaults cover standard hours)
4. Enable session range boxes to see consolidation zones
5. Use session high/low lines to identify key levels for the current session
6. Enable open/close markers to track session transitions
Use Case: Identify which session you're trading in, track session highs/lows for liquidity, and anticipate session transition volatility.
Kill Zones Trading
Kill zones are ICT's high-probability trading windows:
1. Enable individual kill zones or use "Show All Kill Zones"
2. **Asian Kill Zone** (2000-0000 GMT): Early positioning and smart money accumulation
3. **London Kill Zone** (0300-0500 GMT): European market opening volatility
4. **NY AM Kill Zone** (0930-1100 EST): Post-NYSE open expansion
5. **NY Lunch Kill Zone** (1200-1300 EST): Midday consolidation or manipulation
6. **NY PM Kill Zone** (1330-1600 EST): Afternoon positioning and closes
7. Customize colors and times to match your trading style
8. Set max days display to control historical visibility (default: 30 days)
Use Case: Focus entries during high-probability windows. Watch for liquidity sweeps at kill zone openings and institutional positioning.
Previous Period High/Low Levels
Previous period levels act as magnetic price targets and support/resistance:
1. Enable Daily (PDH/PDL), Weekly (PWH/PWL), or Monthly (PMH/PML) levels individually
2. Set lookback period (how many previous periods to display)
3. Choose line style: Solid (current emphasis), Dashed (standard), or Dotted (subtle)
4. Customize colors per timeframe for visual hierarchy
5. Adjust line width (1-5) for visibility preference
6. Enable gradient effect to fade older periods
7. Position labels left or right based on chart layout
8. Customize label text for your preferred notation
Use Case: Identify key levels where price is likely to react. Daily levels work on intraday timeframes, Weekly on daily charts, Monthly for swing trading.
Higher Timeframe (HTF) Candles
HTF candles reveal the larger market context while trading lower timeframes:
1. Enable up to 5 HTF slots simultaneously (default: 5m, 15m, 1H, 4H, Daily)
2. Choose display mode: "Below Chart" (stacked rows) or "Right Side" (compact column)
3. Customize timeframe, colors (bull/bear), and titles for each slot
4. **OHLC Trace Lines**: Visual lines connecting HTF candle levels to chart bars
5. **HTF Timer**: Countdown showing time remaining until HTF candle close
6. **Interval Labels**: Display day of week (Daily+) or time (intraday) on each candle
7. For Daily candles: Choose open time (Midnight, 8:30, 9:30) to match your market structure preference
Use Case: Trade lower timeframes while respecting higher timeframe structure. Watch for HTF candle closes to confirm directional bias.
FVG & VI Detection
Fair Value Gaps and Volume Imbalances highlight inefficiencies that price often revisits:
1. **Fair Value Gaps (FVGs)**: Detected when HTF candle wicks don't overlap between 3 consecutive candles
- Bullish FVG: Gap between candle 1 high and candle 3 low (green box by default)
- Bearish FVG: Gap between candle 1 low and candle 3 high (red box by default)
2. **Volume Imbalances (VIs)**: Similar detection but focuses on body gaps
- Bullish VI: Gap between candle 1 close and candle 3 open
- Bearish VI: Gap between candle 1 open and candle 3 close
3. Enable FVG/VI detection per HTF slot individually
4. Customize colors and transparency for each imbalance type
5. Boxes appear on chart at formation and remain visible as retracement targets
**Use Case**: Identify high-probability retracement zones. Price often returns to fill FVGs and VIs before continuing the trend. Use as entry zones or profit targets.
🎨 Customization
OFA is built for flexibility. Every feature includes extensive customization options:
Visual Customization
- **Colors**: Independent color control for every element (sessions, kill zones, lines, labels, FVGs, VIs)
- **Transparency**: Adjust box and label transparency (0-100%) for clean charts
- **Line Styles**: Choose Solid, Dashed, or Dotted for previous period lines
- **Sizes**: Control text size, line width, and box borders
- **Positions**: Place watermark in 9 positions, labels left/right
Layout Control
- **HTF Display Mode**: "Below Chart" for detailed analysis, "Right Side" for space efficiency
- **Drawing Limits**: Set max days for sessions/kill zones to manage chart clutter
- **Lookback Periods**: Control how many previous periods to display (1-10)
- **Gradient Effects**: Enable fading for older previous period lines
Timing Adjustments
- **Timezone**: Universal GMT offset selector (-12 to +14) for global markets
- **Session Times**: Customize each session's start/end times
- **Kill Zone Times**: Adjust kill zone windows to match your market's characteristics
- **Daily Open**: Choose Midnight, 8:30, or 9:30 for Daily HTF candle open time
💡 Best Practices
1. Start Simple: Enable one feature at a time to learn how each element affects your analysis
2. Match Your Timeframe: Use Daily levels on intraday charts, Weekly on daily charts, HTF candles one or two levels above your trading timeframe
3. Kill Zone Focus: Concentrate your trading activity during kill zones for higher probability setups
4. HTF Confirmation: Wait for HTF candle closes before committing to directional bias
5. FVG/VI Entries: Look for price to return to unfilled FVGs/VIs for entry opportunities with favorable risk/reward
6. Customize Colors: Use a consistent color scheme that matches your chart theme and reduces visual fatigue
7. Reduce Clutter: Disable features you're not actively using in your current trading plan
8. Session Context: Understand which session controls the market—trade with session direction or anticipate reversals at session transitions
⚙️ Settings Guide
OFA organizes settings into logical groups for easy navigation:
- **═══ WATERMARK ═══**: Title, subtitles, position, style, symbol/timeframe display
- **═══ SESSIONS ═══**: Enable/disable sessions, times, colors, high/low lines, boxes, markers
- **═══ KILL ZONES ═══**: Individual kill zone toggles, times, colors, max days display
- **═══ PREVIOUS H/L - DAILY ═══**: Daily high/low lines, style, color, lookback, labels
- **═══ PREVIOUS H/L - WEEKLY ═══**: Weekly high/low lines, style, color, lookback, labels
- **═══ PREVIOUS H/L - MONTHLY ═══**: Monthly high/low lines, style, color, lookback, labels
- **═══ HTF CANDLES ═══**: Global display mode, layout settings
- **═══ HTF SLOT 1-5 ═══**: Individual HTF configuration (timeframe, colors, title, FVG/VI detection, trace lines, timer, interval labels)
Each setting includes tooltips explaining its function. Hover over any input for detailed guidance.
📝 Final Notes
One for All (OFA) represents a complete ICT analysis toolkit in a single indicator. By combining watermark customization, session visualization, kill zone highlighting, previous period levels, and higher timeframe candles with FVG/VI detection, OFA eliminates the need for multiple indicators cluttering your chart.
**Version**: 3.3.0
**Author**: theCodeman
**Pine Script**: v6
**License**: Mozilla Public License 2.0
Start with default settings to learn the indicator's structure, then customize extensively to match your personal trading style. Remember: tools provide information, but your edge comes from disciplined execution of a proven strategy.
Happy Trading! 📈
Tìm kiếm tập lệnh với "smart"

BTC - VERI - Valuation & Entity Ratio IndexVERI: Valuation & Entity Ratio IndexObservation-only.
Data: IntoTheBlock.
Overview & Philosophy
The name VERI is derived from the Latin Veritas (Truth). In a crypto market often driven by deceptive speculative noise, this indicator seeks to establish the "On-Chain Truth" of a price trend.
It operates on the thesis that price action is only sustainable when verified by high-conviction capital flows.VERI is a fundamental composite oscillator that fuses Entity Behavior (Who is holding?) with Network Valuation (Is the price fair?) to identify Bitcoin market cycle extremes.
The "Alpha"
Why this Composite stands out: on-chain metrics often tell only half the story.
MVRV tells you if the price is cheap, but not if anyone is actually buying.
Whale Activity tells you if large players are moving, but not if they are accumulating at a value discount.
VERI fuses these two dimensions into a single Z-Score. It identifies the rare, high-probability moments where Smart Money Conviction intersects with Deep Value.
Methodology
The Mathematics of VERI: The indicator constructs a composite index using three fundamental metrics from IntoTheBlock:
The "Who" (Entity Ratio) : We calculate the flow ratio between Whales (>1% supply holders) and Retail (<0.1% supply holders). A rising ratio indicates supply is transferring from weak hands to strong hands.
The "Why" (Valuation Multiplier) : We utilize the MVRV (Market Value to Realized Value) ratio. To isolate value opportunities, we use the inverse (1 / MVRV).
The Fusion : These factors are multiplied to create the raw VERI index.
Normalization & Inversion
We apply a rolling Z-Score (standard deviation from the mean) and invert the result.
How to Interpret the Indicator
Because the output is inverted, the visual logic matches price action intuitively:
🟥 Distribution Zone (High Values > 1.5):
The Signal: "Low Conviction Overvaluation."
Context: The price is historically expensive relative to the cost basis (High MVRV), and Whales are distributing coins to Retail.Implication: Historically precedes macro tops or deep corrections.
🟩 Accumulation Zone (Low Values < -1.5):
The Signal: "High Conviction Undervaluation."Context: The price is historically cheap (Low MVRV), and Whales are aggressively accumulating relative to Retail.
Implication: Historically precedes macro bottoms and generational entry points.
Zero Line : Represents the historical baseline. A crossover of the zero line often confirms a regime shift (e.g., from Bear to Bull).
Visual Guide & Features
Dynamic Coloring: The line turns Red in the Distribution Zone, Blue in the Accumulation Zone, and Orange during neutral trends.
Zone Labels: Static labels are pinned to the left side of the chart for immediate context.
The "Data Check" Monitor (Status Table): Since this indicator relies on third-party fundamental data, we have included a diagnostic table in the bottom-right corner.
Data Check Monitor Guide
STATUS: LIVE (Green): The indicator is functioning correctly. All data feeds (Whales, Retail, MVRV) are being retrieved successfully.
STATUS: WAIT (Red): The indicator cannot retrieve data. This might happen for some reasons, e.g. your TradingView plan may not support IntoTheBlock integration.
Settings
Lookback Period (Default: 365): The window used for Z-Score normalization. We use a full year to smooth out seasonal volatility.
Smoothing (Default: 7): A 7-day smoothing is applied to the signal to filter out daily noise.
Zone Thresholds: Users can customize the specific Z-Score levels for the Distribution and Accumulation bands.
Disclaimer
This script is for research and educational purposes only. It uses historical on-chain data to visualize market structure and does not constitute financial advice. Past performance of whale entities does not guarantee future results.
Tags
bitcoin, btc, on-chain, mvrv, whales, valuation, fundamentals, cycle, oscillator, veri

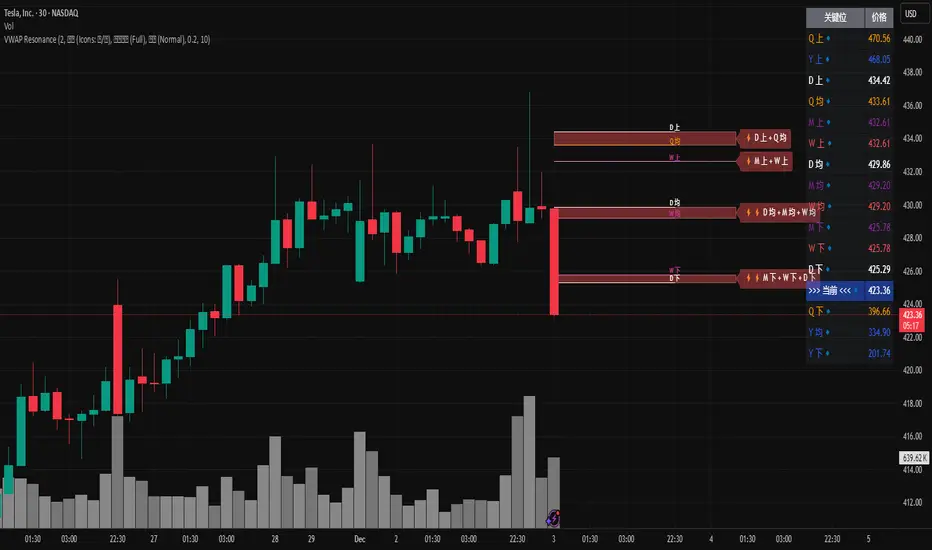
MTF VWAP Resonance [By Testeded]📈 MTF VWAP Resonance Hunter
(多级别 VWAP 共振捕猎者 - 终极版)
🇬🇧 English Description
1. Design Philosophy: The Institutional Edge
While typical indicators measure simple price action, VWAP (Volume Weighted Average Price) measures Value and Institutional Cost.
Professional traders and algorithms anchor their decisions to time-based benchmarks: Daily, Weekly, Monthly, and Quarterly. When prices return to these levels, they are testing the average cost basis of the market participants from that period.
The Logic of "Multi-Level Resonance" (MTF): A single VWAP line can be broken. However, when the Daily VWAP, Weekly Upper Band, and Quarterly Basis all overlap at the exact same price level, a "Market Consensus" is formed. This tool uses a background algorithm to detect these overlaps across 6 Timeframes (4H to Year) and visualizes them as "Resonance Boxes" instead of cluttering your chart with lines.
2. Key Features
⚓ Anchored VWAP Engine: Calculates VWAP + Standard Deviation Bands for 4H, Daily, Weekly, Monthly, Quarterly, and Yearly cycles simultaneously.
⚡ Smart Resonance Radar: Automatically detects when levels from different timeframes cluster together.
2-Line Confluence: ⚡ (Watch)
3-Line Confluence: ⚡⚡ (Strong)
4+ Line Confluence: ⚡⚡⚡ (Iron Wall)
🧘 Visual Modes (Zen / Focus):
Full Mode: Shows lines, dashboard, and resonance boxes.
Focus Mode: Hides lines, keeps dashboard and boxes.
Zen Mode: Hides EVERYTHING except the Resonance Boxes. Pure price action.
🏢 The Quarterly Line: Specifically designed to track the Quarterly VWAP, a critical level for institutional rebalancing and earnings cycles.
🎨 Customizable UI: Adjustable table text size (Small to Huge) and display styles.
3. How to Trade
Identify the Wall: Look for Red Boxes (Resistance) or Green Boxes (Support) with high star ratings (⚡⚡).
Read the Dashboard: Check the label (e.g., Q VWAP + W Lower). This tells you exactly who is defending this level (e.g., "Quarterly Buyers defending cost").
Sniper Entry: Wait for price to touch the Resonance Box. These levels often trigger sharp reversals or major breakouts.
🇨🇳 中文说明 (Chinese Description)
1. 设计哲学:多级别的全局视角
布林带反映的是波动率,而 VWAP(成交量加权平均价) 反映的是**“真金白银的持仓成本”**。
机构交易者和算法通常会锚定特定的时间周期进行交易:日内、周线、月线以及季度线。 “多级别共振”的逻辑: 单一周期的 VWAP 很容易失效。但是,当 日线 VWAP、周线上轨 和 季度线成本 在同一个价格位置重叠时,意味着短线、中线和长线资金在此处达成了**“价值共识”。 本指标通过后台算法,同时监控 6个时间周期 (4H - 年线),将这些重叠的价位转化为可视化的“共振框”**,提供一个多级别的全局视角。
2. 核心功能
⚓ 全周期锚定 VWAP:后台实时计算 4H, 日线, 周线, 月线, 季度线, 年线 的 VWAP 及其标准差轨道。
⚡ 智能共振雷达:自动检测不同周期的关键位重叠。
2线共振:⚡ (关注)
3线共振:⚡⚡ (强力支撑/阻力)
4线以上:⚡⚡⚡ (核弹级/铁壁共振)
🧘 显示模式 (Zen / Focus):
全面模式:显示所有线条 + 表格 + 共振框。
专注模式:隐藏线条,保留表格 + 共振框。
极简模式 (Zen):隐藏一切干扰,只显示共振框。像狙击手一样只看目标。
🏢 季度线增强:特别加入了 Quarterly VWAP (季度线),这是机构季末调仓和财报周期的重要防守线。
🎨 高度客制化:支持调整表格文字大小(从“小”到“巨大”),适配各种分辨率屏幕。
3. 实战用法
寻找“墙壁”:关注图表上的 红色共振框 (阻力) 或 绿色共振框 (支撑),尤其是带有 ⚡⚡ 标志的区域。
解读筹码:看一眼右上角的仪表盘标签(例如 Q VWAP + W Lower)。这意味着“季度级别的平均成本”与“周线级别的超卖线”重合,支撑力度极强。
警报交易:开启警报功能。不需要盯着屏幕,当价格撞上共振框时,指标会自动通知你。
Forex indicator By petran Elevate your market analysis with this powerful, all-in-one visual toolkit designed for discretionary traders across Forex, indices, and commodities (metals).
Core Features:
Trading Sessions Overlay: Clear visual bands highlighting the Asian, London, and New York trading sessions directly on your chart. Never miss a market open or a session overlap again.
Smart Daily Levels: Automatically plots the most essential reference points from the previous day:
PDH / PDL (Previous Day High/Low) – Key support and resistance.
PWH / PWL (Previous Week High/Low) – Higher timeframe context.
DO (Day Open) – A crucial intraday pivot level.
Motivational Watermark: A unique and customizable text overlay at the top of your screen. Display your favorite trading quote, rule, or reminder to maintain the right mindset during the trading day.
Clean & Customizable: Designed for clarity. Adjust colors, session times, and watermark text to fit your personal trading style and chart aesthetics.
Why Traders Choose This Indicator:
Saves Time: No more manually drawing sessions or calculating yesterday's levels.
Improves Discipline: The visual sessions and watermark help you trade only during your planned times and follow your rules.
Universal Application: Works seamlessly on any liquid market where session activity and daily ranges matter.
Perfect for traders who rely on price action, session-based strategies, and need a clean, informative chart environment.

DWM HLOC, Mid & WicksSimple, yet effective.
1. Automatically calculate and projects key price levels from a previous period (Yesterday, OR Last Week / Month) onto the current trading session. It acts as an immediate Support & Resistance map based on historical price action.
2. Multi-Timeframe Logic
Modes --
Daily Mode: Projects yesterday's data onto today.
Weekly Mode: Projects last week's data onto the current week.
3. Key Levels Visualized The script calculates seven distinct price levels:
OHLC: Previous Open, High, Low, and Close.
Equilibrium (Mid): The exact 50% mark between the previous High and Low.
Wick Midpoints (New):
Upper Wick 50%: The midpoint between the High and the top of the body.
Lower Wick 50%: The midpoint between the Low and the bottom of the body.
4. Smart "Gap" Visualization The script uses unique starting points to help traders visualize market gaps:
Standard Levels (High, Low, Open, Mids): These lines originate from the Previous Period's Open, showing the full context of the level relative to time.
Close Level: This line originates from the Current Period's Open. This visually highlights the "Gap" (the jump in price between where the market closed previously and where it opened today).
5. Full Customization
Aesthetics: Every line can be individually toggled on/off.
Styling: Users can independently change the color, line style (Solid, Dotted, Dashed), and thickness for every specific level.

5 DMA Entry Plus5 DMA Entry Plus - Multi-Strategy Entry Signal Indicator
Overview:
The 5 DMA Entry Plus is a versatile entry signal indicator that combines multiple proven technical analysis methods to identify potential buy opportunities. This indicator is designed to be highly customizable, allowing traders to toggle between different entry strategies or combine them for confluence-based entries.
Key Features:
1. Multiple Entry Strategy Options:
Default Close Above Entry: Triggers when price closes above the 5-day moving average (with optional HMA filter)
Green Wick Candle Signal: Identifies bullish candles where the wick pierces above key moving averages, indicating rejection of lower prices
5DMA Zero/Upslope Entry: Generates signals when the 5DMA is flat or sloping upward, confirming momentum
HMA Cross Entry: Triggers when price crosses above the Hull Moving Average, a responsive momentum indicator
2. Adaptive HMA Filter:
Toggle the HMA (Hull Moving Average) filter on or off to adjust signal sensitivity. When enabled, price must be above both the 5DMA and 20 HMA for confirmation. When disabled, only the 5DMA is required, generating more frequent signals.
3. Smart Reset Logic:
The indicator includes intelligent reset functionality that prevents signal spam. Once an entry signal is generated, no new signals appear until price closes below the moving average(s), ensuring clean, actionable entries without clutter.
4. Visual Components:
5-Day Moving Average (Blue Line): The primary trend reference
20-Period Hull Moving Average (Orange Line): Fast-responding momentum filter
Buy Signals (Green Labels): Clear "Buy" labels appear below candles when entry conditions are met
Built-in Alerts: Set up custom alerts to be notified when entry signals trigger
Customizable Inputs:
Use HMA Filter: Enable/disable the 20 HMA confirmation requirement
Include Green Wick Candle Signal: Toggle wick-based entry detection
Use 5DMA Zero/Upslope Entry: Enable slope-based entry logic
Use HMA Cross Entry: Enable HMA crossover signals
HMA Length: Adjust the Hull Moving Average period (default: 20)
Best Use Cases:
Swing trading on daily and 4-hour timeframes
Identifying pullback entries in uptrends
Combining multiple confirmation signals for high-probability setups
Filtering entries in momentum-based strategies
Strategy Flexibility:
This indicator allows you to use each entry method independently or combine multiple methods for confluence. Test different combinations to find what works best for your trading style and the instruments you trade.
Risk Management Note:
This indicator identifies potential entry points but does not provide exit signals or stop-loss levels. Always use proper risk management and combine with your own exit strategy.

Macros+AMD [NW]Macros + AMD - Daily & Weekly Time-Based Analysis
Multi-timeframe AMD (Accumulation, Manipulation, Distribution) visualization with ICT Macro timing windows for time-based market analysis.
Overview
This indicator visualizes the AMD (Accumulation, Manipulation, Distribution) framework on both daily and weekly timeframes, combined with ICT Macro timing windows. It is designed as an educational tool to help traders study time-based market structure and algorithmic price delivery concepts.
The AMD model is based on the idea that markets move through distinct phases within each trading period:
Accumulation (A) - Initial range formation, liquidity building
Manipulation (M) - False moves to trap traders, liquidity sweeps
Distribution (D) - True directional move, price delivery to targets
What This Indicator Displays
Daily AMD Phases
Displays the intraday AMD cycle based on New York trading hours:
A Phase (Blue): 4:00 AM - 8:35 AM EST — Morning accumulation, Asian/London overlap
M Phase (Red): 8:35 AM - 11:25 AM EST — NY session manipulation, news events
D Phase (Green): 11:25 AM - 4:00 PM EST — Afternoon distribution and price delivery
Weekly AMD Phases
Displays the weekly AMD cycle from Monday to Monday:
A Phase: Monday 00:00 - Tuesday 21:56 EST — Weekly high/low formation begins
M Phase: Tuesday 21:56 - Thursday 02:04 EST — Mid-week reversal zone
D Phase: Thursday 02:04 - Monday 00:00 EST — Weekly price delivery
Inner M Phase Fibs
When enabled, subdivides the M (Manipulation) phase using Fibonacci levels:
0.382 level — Inner accumulation ends
0.500 level — Mid-point of manipulation
0.618 level — Inner distribution begins
This helps identify potential reversal points within the manipulation phase.
ICT Macro Windows
Horizontal lines marking the XX:42 to XX:15 macro periods (33-minute windows):
2:42 - 3:15 AM
3:42 - 4:15 AM (London)
7:42 - 8:15 AM
8:42 - 9:15 AM
9:42 - 10:15 AM (Prime AM session)
10:42 - 11:15 AM
11:42 - 12:15 PM
12:42 - 1:15 PM
1:42 - 2:15 PM
2:42 - 3:15 PM
These windows represent times when algorithmic price delivery is more likely to occur.
How To Use
Understanding the AMD Framework
During the A Phase:
Observe range formation and initial liquidity pools
Note the high and low established during this phase
Wait for manipulation before committing to direction
During the M Phase:
Watch for false breakouts and stop hunts
Look for reversal patterns after liquidity sweeps
The inner fibs (0.382, 0.5, 0.618) can help time entries within this phase
Mid-week (Wednesday) often sees key reversals on weekly AMD
During the D Phase:
This is typically when the true move occurs
Price tends to deliver toward draw on liquidity targets
The direction is often opposite to the manipulation move
Using the Macro Windows
The XX:42 to XX:15 windows are times to pay attention to price action:
These 33-minute periods often see increased algorithmic activity
Look for displacement, fair value gaps, or order blocks forming
The 9:42-10:15 AM window is considered particularly significant for NY session
Weekly Day Labels
Monday/Tuesday: "H/L of Week" — Watch for weekly high or low formation
Wednesday: "Reversal Day" — Mid-week reversal probability increases
Thursday/Friday: "Reversal Day" — Continuation or secondary reversal
Settings Guide
Main Settings
Timezone: Set to your broker's timezone or preferred timezone
Macros On Top: Toggle macro lines above or below AMD boxes
Show All Text Labels: Master toggle for all text (turn off for clean charts on HTF)
Daily/Weekly AMD
Show: Enable/disable the AMD visualization
Opacity: Adjust transparency of the phase boxes (higher = more transparent)
AMD Colors
Customize colors for each phase (A, M, D)
Default: Blue (A), Red (M), Green (D)
Inner M Style
Customize the inner M phase fib lines and text colors
Default: Black lines for clean visibility
Macro Settings
Adjust macro line color and thickness
Toggle individual macro windows on/off
Important Notes
This indicator is for educational purposes and time-based analysis
It does not provide buy/sell signals
Always use in conjunction with proper price action analysis
Past price behavior during these time windows does not guarantee future results
The AMD framework is one lens for viewing market structure — use it as part of a complete methodology
Credits
This indicator is based on concepts taught by ICT (Inner Circle Trader) and the broader Smart Money Concepts community. The AMD framework, macro timing windows, and weekly profile concepts are derived from this educational methodology.
Timeframe Recommendations
Best viewed on 1-minute to 15-minute charts
Text labels automatically hide on 9-minute and higher timeframes for cleaner visualization
Indicator hides completely on 1-hour and higher timeframes
Changelog
v1.0 - Initial release
Daily AMD phases (4am-4pm EST)
Weekly AMD phases (Monday-Monday)
Inner M phase Fibonacci subdivisions
10 ICT Macro timing windows
Full customization options
Automatic 9-day cleanup

Psychological LevelsADVANCED PSYCHOLOGICAL LEVELS - PROFESSIONAL FOREX INDICATOR
This highly customizable indicator automatically identifies and visualizes all major psychological price levels across any Forex chart. Psychological levels represent critical price zones where traders naturally congregate their orders due to human psychology's attraction to round numbers. These levels consistently act as powerful support and resistance zones in the market.
🎯 KEY FEATURES:
✅ Four Distinct Level Types - Choose from 1000-pip, 100-pip, 50-pip, 25-pip, and 10-pip psychological levels
✅ Individual Color Customization - Each level type has its own customizable zone and line colors
✅ Separate Zone Width Control - Adjust zone width independently for each level type
✅ Universal Forex Compatibility - Automatically adapts to JPY pairs and all other currency pairs
✅ Extended Coverage - Displays levels far beyond the visible chart area for comprehensive analysis
✅ Fixed Positioning - Levels remain stationary when scrolling or zooming
✅ Fully Customizable Styling - Choose between solid, dashed, or dotted line styles
📊 LEVEL TYPES EXPLAINED:
🟣 1000-pip Levels (e.g., EUR/USD: 1.0000, 2.0000 | USD/JPY: 100.00, 110.00, 120.00)
The strongest macro-level psychological barriers in the Forex market
Represent massive institutional, long-term price zones
Extremely important for position traders, swing traders, and macro analysis
Used by hedge funds, banks, and large liquidity providers for major order placement
Ideal for identifying long-term support/resistance, trend reversals, and market structure shifts
Default color: Purple (highest, macro-level importance)
🔴 100-pip Levels (e.g., EUR/USD: 1.1000, 1.1100, 1.1200 | USD/JPY: 150.00, 151.00, 152.00)
The most significant psychological barriers in Forex trading
Major round numbers where institutional traders place large orders
Strongest support and resistance zones with highest reaction probability
Essential for swing trading and position trading strategies
Default color: Red (highest importance)
🟠 50-pip Levels (e.g., EUR/USD: 1.1050, 1.1150, 1.1250 | USD/JPY: 150.50, 151.50, 152.50)
Secondary psychological levels positioned midway between 100-pip levels
Important intermediate zones for profit-taking and order clustering
Highly effective for day trading strategies
Reliable targets for partial profit exits
Default color: Orange (medium-high importance)
🔵 25-pip Levels (e.g., EUR/USD: 1.1025, 1.1075, 1.1125 | USD/JPY: 150.25, 150.75, 151.25)
Quartile levels providing granular market structure
Perfect for scalping and short-term trading approaches
Excellent confluence zones with technical indicators
Ideal for tight stop-loss placement
Default color: Blue (medium importance)
🟢 10-pip Levels (e.g., EUR/USD: 1.1010, 1.1020, 1.1030 | USD/JPY: 150.10, 150.20, 150.30)
Most detailed psychological levels for precision trading
Optimal for micro scalping and high-frequency strategies
Provides fine-grained market structure analysis
Useful for optimizing entry and exit timing
Default color: Green (detailed analysis)
⚙️ CUSTOMIZATION OPTIONS:
Color Settings (Individual for Each Level):
Zone Color - Customize fill color with adjustable transparency
Line Color - Set center line color independently
Default color scheme uses traffic light logic (Purple → Red → Orange → Blue → Green)
Zone Width Settings (Separate for Each Level):
1000-pip Levels: Default 15 pips (widest zones for long-term significance)
100-pip Levels: Default 8 pips (wider zones for major levels)
50-pip Levels: Default 5 pips (medium zones)
25-pip Levels: Default 3 pips (smaller zones)
10-pip Levels: Default 2 pips (narrowest zones for precision)
Display Settings:
Line Style: Choose between Solid, Dashed, or Dotted
Line Thickness: Adjustable from 1 to 5 pixels
Level Selection: Toggle each level type on/off independently
💡 TRADING APPLICATIONS:
📈 Support & Resistance Identification
Instantly recognize where price is likely to react
Identify key reversal zones before they occur
Combine with price action for high-probability setups
🎯 Optimal Entry & Exit Points
Enter trades at psychological support/resistance
Set realistic profit targets at the next psychological level
Improve win rate by trading with market psychology
🛡️ Strategic Stop-Loss Placement
Position stops just beyond psychological levels to avoid stop hunts
Reduce premature stop-outs by understanding where others place stops
Protect profits by moving stops to psychological levels
💰 Profit Target Optimization
Set take-profit orders at psychological levels where profit-taking occurs
Scale out positions at multiple psychological levels
Maximize gains by understanding where demand/supply shifts
📊 Breakout Trading
Identify when price decisively breaks through major psychological barriers
Trade momentum when psychological levels are breached
Confirm breakouts using multiple level types as confluence
⚖️ Risk Management Enhancement
Calculate better risk-reward ratios using psychological levels
Size positions based on distance to next psychological level
Improve overall trading consistency
🔬 WHY PSYCHOLOGICAL LEVELS WORK:
Psychological levels are self-fulfilling prophecies in financial markets. Because thousands of traders worldwide monitor the same round numbers, these levels naturally attract significant order flow:
Order Clustering: Pending buy/sell orders accumulate at round numbers
Profit Taking: Traders instinctively close positions at psychological levels
Stop Hunts: Market makers often push price to psychological levels to trigger stops
Institutional Activity: Banks and funds use round numbers for large order placement
Pattern Recognition: Human brains naturally gravitate toward simple, round numbers
📋 TECHNICAL SPECIFICATIONS:
✓ Pine Script Version 6 (latest)
✓ Compatible with all Forex pairs (majors, minors, exotics)
✓ Works on all timeframes (M1 to Monthly)
✓ Automatic JPY pair detection and adjustment
✓ Maximum 500 lines and 500 boxes for optimal performance
✓ Levels extend infinitely across the chart
✓ No repainting - levels are fixed once drawn
✓ Efficient calculation prevents performance issues
✓ Clean visualization without chart clutter
👥 IDEAL FOR:
Day Traders: Use 100-pip and 50-pip levels for intraday setups
Swing Traders: Focus on major 100-pip levels for multi-day positions
Scalpers: Enable 25-pip and 10-pip levels for precision entries
Position Traders: Use 100-pip levels for long-term support/resistance analysis
Beginner Traders: Learn to recognize important market structure easily
Algorithm Developers: Incorporate psychological levels into automated strategies
🚀 HOW TO USE:
Add the indicator to any Forex chart
Select which level types you want to display (100, 50, 25, 10)
Customize colors to match your chart theme
Adjust zone widths based on your trading style and timeframe
Choose line style (solid, dashed, or dotted)
Watch for price reactions at the highlighted psychological zones
Use the levels to plan entries, exits, and stop-loss placement
💎 BEST PRACTICES:
✓ Combine with candlestick patterns for confirmation signals
✓ Wait for price action confirmation before entering trades
✓ Use multiple timeframes to identify the most significant levels
✓ Disable 10-pip levels on higher timeframes to reduce visual noise
✓ Enable only 100-pip levels for clean, uncluttered analysis on Daily/Weekly charts
✓ Adjust zone widths based on pair volatility (wider for volatile pairs)
✓ Use color coding to instantly recognize level importance
⚡ PERFORMANCE OPTIMIZED:
This indicator is engineered for maximum efficiency:
Smart calculation only within visible price range
Duplicate prevention system avoids overlapping levels
Optimized loops with early break conditions
Extended coverage (500 bars) without performance degradation
Handles thousands of levels across all timeframes smoothly
🎨 VISUAL DESIGN:
The default color scheme follows intuitive importance levels:
Purple (1000-pip): Macro-level, highest significance
Red (100-pip): Highest importance - major barriers
Orange (50-pip): Medium-high importance - secondary levels
Blue (25-pip): Medium importance - tertiary levels
Green (10-pip): Detailed analysis - precision levels
This traffic-light inspired system allows instant visual recognition of level significance.
📚 EDUCATIONAL VALUE:
Beyond being a trading tool, this indicator serves as an excellent educational resource for understanding market psychology and how professional traders think. It visually demonstrates where the "crowd" is likely to place orders, helping you develop better market intuition.
🔄 CONTINUOUS UPDATES:
This indicator displays levels dynamically based on the current price range, ensuring you always see relevant psychological levels no matter where price moves on the chart.
✨ WHAT MAKES THIS INDICATOR UNIQUE:
Unlike simple horizontal line indicators, this advanced tool offers:
Individual customization for each level type (colors, widths)
Automatic currency pair detection and adjustment
Visual zones (not just lines) for better support/resistance visualization
Extended coverage ensuring levels are always visible
Professional color-coding system for instant level importance recognition
Performance-optimized for handling hundreds of levels simultaneously
⭐ PERFECT FOR ALL TRADING STYLES:
Whether you're a conservative position trader looking at weekly charts or an aggressive scalper on 1-minute timeframes, this indicator adapts to your needs. Simply enable the appropriate level types and adjust the visualization to match your strategy.
Transform your Forex trading with professional-grade psychological level analysis. Add this indicator to your chart today and start trading with the market psychology on your side!

Psychological levelsADVANCED PSYCHOLOGICAL LEVELS - PROFESSIONAL FOREX INDICATOR
This highly customizable indicator automatically identifies and visualizes all major psychological price levels across any Forex chart. Psychological levels represent critical price zones where traders naturally congregate their orders due to human psychology's attraction to round numbers. These levels consistently act as powerful support and resistance zones in the market.
🎯 KEY FEATURES:
✅ Four Distinct Level Types - Choose from 100-pip, 50-pip, 25-pip, and 10-pip psychological levels
✅ Individual Color Customization - Each level type has its own customizable zone and line colors
✅ Separate Zone Width Control - Adjust zone width independently for each level type
✅ Universal Forex Compatibility - Automatically adapts to JPY pairs and all other currency pairs
✅ Extended Coverage - Displays levels far beyond the visible chart area for comprehensive analysis
✅ Fixed Positioning - Levels remain stationary when scrolling or zooming
✅ Fully Customizable Styling - Choose between solid, dashed, or dotted line styles
📊 LEVEL TYPES EXPLAINED:
🔴 100-pip Levels (e.g., EUR/USD: 1.1000, 1.1100, 1.1200 | USD/JPY: 150.00, 151.00, 152.00)
The most significant psychological barriers in Forex trading
Major round numbers where institutional traders place large orders
Strongest support and resistance zones with highest reaction probability
Essential for swing trading and position trading strategies
Default color: Red (highest importance)
🟠 50-pip Levels (e.g., EUR/USD: 1.1050, 1.1150, 1.1250 | USD/JPY: 150.50, 151.50, 152.50)
Secondary psychological levels positioned midway between 100-pip levels
Important intermediate zones for profit-taking and order clustering
Highly effective for day trading strategies
Reliable targets for partial profit exits
Default color: Orange (medium-high importance)
🔵 25-pip Levels (e.g., EUR/USD: 1.1025, 1.1075, 1.1125 | USD/JPY: 150.25, 150.75, 151.25)
Quartile levels providing granular market structure
Perfect for scalping and short-term trading approaches
Excellent confluence zones with technical indicators
Ideal for tight stop-loss placement
Default color: Blue (medium importance)
🟢 10-pip Levels (e.g., EUR/USD: 1.1010, 1.1020, 1.1030 | USD/JPY: 150.10, 150.20, 150.30)
Most detailed psychological levels for precision trading
Optimal for micro scalping and high-frequency strategies
Provides fine-grained market structure analysis
Useful for optimizing entry and exit timing
Default color: Green (detailed analysis)
⚙️ CUSTOMIZATION OPTIONS:
Color Settings (Individual for Each Level):
Zone Color - Customize fill color with adjustable transparency
Line Color - Set center line color independently
Default color scheme uses traffic light logic (Red → Orange → Blue → Green)
Zone Width Settings (Separate for Each Level):
100-pip Levels: Default 10 pips (wider zones for major levels)
50-pip Levels: Default 7 pips (medium zones)
25-pip Levels: Default 5 pips (smaller zones)
10-pip Levels: Default 3 pips (narrowest zones for precision)
Display Settings:
Line Style: Choose between Solid, Dashed, or Dotted
Line Thickness: Adjustable from 1 to 5 pixels
Level Selection: Toggle each level type on/off independently
💡 TRADING APPLICATIONS:
📈 Support & Resistance Identification
Instantly recognize where price is likely to react
Identify key reversal zones before they occur
Combine with price action for high-probability setups
🎯 Optimal Entry & Exit Points
Enter trades at psychological support/resistance
Set realistic profit targets at the next psychological level
Improve win rate by trading with market psychology
🛡️ Strategic Stop-Loss Placement
Position stops just beyond psychological levels to avoid stop hunts
Reduce premature stop-outs by understanding where others place stops
Protect profits by moving stops to psychological levels
💰 Profit Target Optimization
Set take-profit orders at psychological levels where profit-taking occurs
Scale out positions at multiple psychological levels
Maximize gains by understanding where demand/supply shifts
📊 Breakout Trading
Identify when price decisively breaks through major psychological barriers
Trade momentum when psychological levels are breached
Confirm breakouts using multiple level types as confluence
⚖️ Risk Management Enhancement
Calculate better risk-reward ratios using psychological levels
Size positions based on distance to next psychological level
Improve overall trading consistency
🔬 WHY PSYCHOLOGICAL LEVELS WORK:
Psychological levels are self-fulfilling prophecies in financial markets. Because thousands of traders worldwide monitor the same round numbers, these levels naturally attract significant order flow:
Order Clustering: Pending buy/sell orders accumulate at round numbers
Profit Taking: Traders instinctively close positions at psychological levels
Stop Hunts: Market makers often push price to psychological levels to trigger stops
Institutional Activity: Banks and funds use round numbers for large order placement
Pattern Recognition: Human brains naturally gravitate toward simple, round numbers
📋 TECHNICAL SPECIFICATIONS:
✓ Pine Script Version 6 (latest)
✓ Compatible with all Forex pairs (majors, minors, exotics)
✓ Works on all timeframes (M1 to Monthly)
✓ Automatic JPY pair detection and adjustment
✓ Maximum 500 lines and 500 boxes for optimal performance
✓ Levels extend infinitely across the chart
✓ No repainting - levels are fixed once drawn
✓ Efficient calculation prevents performance issues
✓ Clean visualization without chart clutter
👥 IDEAL FOR:
Day Traders: Use 100-pip and 50-pip levels for intraday setups
Swing Traders: Focus on major 100-pip levels for multi-day positions
Scalpers: Enable 25-pip and 10-pip levels for precision entries
Position Traders: Use 100-pip levels for long-term support/resistance analysis
Beginner Traders: Learn to recognize important market structure easily
Algorithm Developers: Incorporate psychological levels into automated strategies
🚀 HOW TO USE:
Add the indicator to any Forex chart
Select which level types you want to display (100, 50, 25, 10)
Customize colors to match your chart theme
Adjust zone widths based on your trading style and timeframe
Choose line style (solid, dashed, or dotted)
Watch for price reactions at the highlighted psychological zones
Use the levels to plan entries, exits, and stop-loss placement
💎 BEST PRACTICES:
✓ Combine with candlestick patterns for confirmation signals
✓ Wait for price action confirmation before entering trades
✓ Use multiple timeframes to identify the most significant levels
✓ Disable 10-pip levels on higher timeframes to reduce visual noise
✓ Enable only 100-pip levels for clean, uncluttered analysis on Daily/Weekly charts
✓ Adjust zone widths based on pair volatility (wider for volatile pairs)
✓ Use color coding to instantly recognize level importance
⚡ PERFORMANCE OPTIMIZED:
This indicator is engineered for maximum efficiency:
Smart calculation only within visible price range
Duplicate prevention system avoids overlapping levels
Optimized loops with early break conditions
Extended coverage (500 bars) without performance degradation
Handles thousands of levels across all timeframes smoothly
🎨 VISUAL DESIGN:
The default color scheme follows intuitive importance levels:
Red (100-pip): Highest importance - major barriers
Orange (50-pip): Medium-high importance - secondary levels
Blue (25-pip): Medium importance - tertiary levels
Green (10-pip): Detailed analysis - precision levels
This traffic-light inspired system allows instant visual recognition of level significance.
📚 EDUCATIONAL VALUE:
Beyond being a trading tool, this indicator serves as an excellent educational resource for understanding market psychology and how professional traders think. It visually demonstrates where the "crowd" is likely to place orders, helping you develop better market intuition.
🔄 CONTINUOUS UPDATES:
This indicator displays levels dynamically based on the current price range, ensuring you always see relevant psychological levels no matter where price moves on the chart.
✨ WHAT MAKES THIS INDICATOR UNIQUE:
Unlike simple horizontal line indicators, this advanced tool offers:
Individual customization for each level type (colors, widths)
Automatic currency pair detection and adjustment
Visual zones (not just lines) for better support/resistance visualization
Extended coverage ensuring levels are always visible
Professional color-coding system for instant level importance recognition
Performance-optimized for handling hundreds of levels simultaneously
⭐ PERFECT FOR ALL TRADING STYLES:
Whether you're a conservative position trader looking at weekly charts or an aggressive scalper on 1-minute timeframes, this indicator adapts to your needs. Simply enable the appropriate level types and adjust the visualization to match your strategy.

Price Volume Trend to buyThis indicator use PVT (price volume tendency) as background whith colors and labels to smart indicate if you are on buyer or seller scenario

Rakesh's Ultimate Trading SystemKey Features:
1. Multi-Confirmation System
5 total signals working together:
MTF Supertrend (Monthly + Weekly + Daily alignment)
Ichimoku Cloud (Price vs Cloud + Tenkan/Kijun cross)
Gann HiLo Activator (Trend direction)
Darvas Box (Breakout/Breakdown)
Current timeframe Supertrend
2. Smart Signal Generation
You set minimum confirmations (1-5) needed for a signal
STRONG BUY = When X out of 5 indicators confirm bullish
STRONG SELL = When X out of 5 indicators confirm bearish
Shows confirmation count on each signal label (e.g., "4/5")
3. Comprehensive Dashboard
Shows real-time status of:
✓ Each indicator's current signal
✓ Overall market direction
✓ Bullish vs Bearish confirmation count
✓ Color-coded for quick decision making
4. All Indicators Plotted
Ichimoku Cloud - Green/Red cloud with Tenkan/Kijun lines
Gann HiLo - Dynamic support/resistance line
Darvas Box - Top and bottom box levels
Background colors - Show breakouts and overall trend
5. Built-in Alerts
Automatic alerts when strong buy/sell signals trigger
Shows how many confirmations fired
How to Use:
Conservative Trading (Recommended):
Set "Minimum Confirmations" to 4 or 5
Only trade when almost all indicators align
Fewer signals but higher probability
Moderate Trading:
Set to 3 confirmations
Balanced approach - good signals, not too rare
Aggressive Trading:
Set to 2 confirmations
More signals but require your own filtering
Customization Options:
All indicators can be toggled on/off:
Show/hide individual Supertrend timeframes
Show/hide Ichimoku Cloud
Show/hide Gann HiLo
Show/hide Darvas Box
Show/hide Dashboard
Adjustable parameters for each indicator:
Supertrend: ATR period, Factor
Ichimoku: Tenkan, Kijun, Senkou periods
Gann: HiLo period
Darvas: Box length
Trading Strategy Examples:
1. Ultra-Safe Entry:
Wait for 5/5 confirmations
Enter on next candle
Use Gann line as stop-loss
2. Breakout Trading:
Watch for Darvas Box breakout
Confirm with 3+ other indicators
Ride the trend
3. Trend Following:
MTF Supertrend shows main trend
Use Ichimoku cloud for support/resistance
Enter on Gann/Darvas confirmations
This is a professional-grade system, Rakesh! It filters out false signals by requiring multiple confirmations. Much more refined than single-indicator systems! 🚀
Want me to adjust anything or add more features?Ris this also for tradingviewYes, absolutely! This is 100% for TradingView, just like the first one!
How to Add This to TradingView:
Same steps as before:
Copy the code from the artifact above
Go to TradingView.com
Open Pine Editor (bottom of chart)
Click "Open" → "New blank indicator"
Paste the code
Click "Save" and name it (e.g., "Advanced MTF System")
Click "Add to Chart"
What You'll See on Your Chart:
✅ Ichimoku Cloud - Green/Red cloud visualization
✅ Gann HiLo Line - Green when bullish, Red when bearish
✅ Darvas Box - Box top and bottom levels
✅ Buy/Sell Labels - "STRONG BUY 4/5" or "STRONG SELL 3/5"
✅ Dashboard Table - Top right corner showing all indicator statuses
✅ Background colors - Subtle green/red when strong signals appear
It Works With:
✅ Stocks (NSE, BSE, US markets)
✅ Forex
✅ Crypto
✅ Commodities
✅ Indices (Nifty, Bank Nifty, etc.)
Settings Panel:
When you add it to chart, click the ⚙️ settings icon to customize:
Toggle indicators on/off
Adjust minimum confirmations (2, 3, 4, or 5)
Fine-tune each indicator's parameters

Pure FVG [Textbook]1. The Core Concept
This is not a standard "show all gaps" indicator. It is a specific entry signal generator based on Smart Money Concepts (SMC).
It focuses on Consequent Encroachment (The 50% Level). The underlying principle is that a Fair Value Gap (FVG) represents a market inefficiency where opposing traders are trapped. When price retraces at least 50% back into this gap, it creates pressure as these trapped positions look to exit—either through stop-losses or position reversal. This makes the gap most likely to act as a reversal zone.
2. How It Works (The Lifecycle)
The indicator logic follows a strict sequence of events. A signal is generated only if all conditions are met in order:
-- Phase 1: Identification (The Fresh Gap)
The script scans for the classic 3-candle FVG pattern (where the 1st and 3rd candles do not overlap).
Visual: It draws a box (Green for Bullish, Red for Bearish) extending to the right.
The 50% Line: A dashed line is drawn through the center of the gap.
-- Phase 2: Mitigation (The Gray Zone)
This is the critical filter. The indicator waits for a candle to CLOSE past the 50% dashed line.
Once this happens, the gap is considered "Deeply Mitigated."
Visual: The box changes color to Gray. This tells the trader: "Price is deep in the zone, watch for a reaction."
-- Phase 3: The Signal (Rejection)
Once the box is Gray, the script watches for a "Rejection Candle."
Bullish Scenario: Price is deep in the gap (Gray). The script waits for a candle to close higher than it opened (a green candle).
Bearish Scenario: Price is deep in the gap (Gray). The script waits for a candle to close lower than it opened (a red candle).
Visual: A Triangle Label (▲ or ▼) appears, signaling an entry.
-- Phase 4: Invalidation
If the price closes completely past the far edge of the box (the Stop Loss level), the box is deleted immediately.
3. Key Options
These are the most important settings for the user:
-- Min Gap Size (%):
Filters out "noise." It ensures the script ignores tiny, insignificant gaps that are less than X% in height.
-- Max Visible Gaps:
Keeps your chart clean. It limits how many open boxes can be on the screen at once (e.g., only show the last 3 unclosed gaps).
-- Show Signal History Only:
Feature Highlight: When enabled, this hides all the "noise" of open or failed gaps. It only draws the boxes that successfully produced a Rejection Signal in the past.

Asia & London Session Boxes (NY Time) + 4H SwingsAsia & London Session Boxes + 4H Swings
Description
A multi-timeframe session analysis tool designed for forex and futures traders operating on NY time. This indicator visualizes major trading sessions with automatic high/low range boxes while simultaneously tracking 4-hour swing levels, giving you a complete picture of institutional trading activity and key price levels.
How It Works
Session Boxes (NY Time Zone)
Asia Session (20:00 – 00:00 NY): Blue-shaded box marking the complete range from open to close
London Session (02:00 – 06:00 NY): Yellow-shaded box capturing the high-volatility London open
Each session box automatically records the highest high and lowest low during that timeframe, providing instant reference for session extremes and potential supply/demand zones.
4-Hour Swing Levels
Detects swing highs and lows on a 30-minute timeframe for ultra-responsive level identification
Red lines: Swing highs (resistance levels)
Green lines: Swing lows (support levels)
Lines extend to the right for continuous monitoring
Auto-removes touched levels: When price breaches a swing, it automatically deletes that level to keep your chart clean and focused on active levels
Key Features
Session-Based Trading Analysis: Identify which session created important price levels and ranges
Multi-Timeframe Architecture: Analyzes 30-minute swings while tracking 4-hour patterns on your current chart
Smart Level Cleanup: Touched swings automatically remove themselves, eliminating clutter
NY Time Conversion: All times automatically adjust to your NY timezone for consistency
Institutional Perspective: View exactly where institutions are trading during major session hours
Zero Lag Detection: Real-time identification of swing extremes
Ideal For
Forex traders (especially EUR/USD, GBP/USD) targeting session breakouts
Scalpers and swing traders needing precise support/resistance levels
Market structure traders analyzing institutional price action
Session traders looking to trade Asia/London opens
1-minute to 4-hour timeframe charts
Trading Applications
Trade Asia session breakouts into London
Identify liquidity zones from previous sessions
Detect swing extremes for entry/exit planning
Confirm trend direction using multi-session structure
Find support/resistance on intraday pullbacks
Default Settings Optimized For
NASDAQ futures and forex pairs
Scalping and short-term swing trading
NY timezone trading (automatically converts UTC-4)
30-minute swing detection for precise level identification

NQUSB Sector Industry Stocks Strength
A Comprehensive Multi-Industry Performance Comparison Tool
The complete Pine Script code and supporting Python automation scripts are available on GitHub:
GitHub Repository: github.com
Original idea from by www.tradingview.com
━━━━━━━━━━━━━━━━━━━━━━━━━━━━━━━━━━━━━━━━
═══ WHAT'S NEW ═══
4-Level Hierarchical Navigation:
Primary: All 11 NQUSB sectors (NQUSB10, NQUSB15, NQUSB20, etc.)
Secondary (Default): Broad sectors like Technology, Energy
Tertiary: Industry groups within sectors
Quaternary: Individual stocks within industries (37 semiconductors)
Enhanced Stock Coverage:
1,176 total stocks across 129 industries
37 semiconductor stocks
Market-cap weighted selection: 60% tech / 35% others
Range: 1-37 stocks per industry
━━━━━━━━━━━━━━━━━━━━━━━━━━━━━━━━━━━━━━━━
═══ CORE FEATURES ═══
1. Drill-Down/Drill-Up Navigation
View NVDA at different granularity levels:
Quaternary: ● NVDA ranks #3 of 37 semiconductors
Tertiary: ✓ Semiconductors at 85% (strongest in tech hardware)
Secondary: ✓ Tech Hardware at 82% (stronger than software)
Primary: ✓ Technology at 78% (#1 sector overall)
Insight: One indicator, one stock, four perspectives - instantly see if strength is stock-specific, industry-specific, or sector-wide.
━━━━━━━━━━━━━━━━━━━━━━━━━━━━━━━━━━━━━━━━
2. Visual Current Stock Identification
Violet Markers - Instant Recognition:
● (dot) marker when current stock is in top N performers
✕ (cross) marker when current stock is below top N
Violet color (#9C27B0) on both symbol and value labels
Example: "NVDA ● ranks #3 of 37"
━━━━━━━━━━━━━━━━━━━━━━━━━━━━━━━━━━━━━━━━
3. Rank Display in Title
Dynamic title shows performance context:
"Semiconductors (RS Rating - 3 Months) | NVDA ranks #3 of 37"
#1 = Best performer, higher number = lower rank
Total adjusts if current stock auto-added
━━━━━━━━━━━━━━━━━━━━━━━━━━━━━━━━━━━━━━━━
4. Auto-Add Current Stock
Always Included:
Current stock automatically added if not in predefined list
Example: Viewing PRSO → "PRSO ranks #37 of 39 ✕"
Works for any stock - from NVDA to obscure small-caps
Violet markers ensure visibility even when ranked low
━━━━━━━━━━━━━━━━━━━━━━━━━━━━━━━━━━━━━━━━
═══ DUAL PERFORMANCE METRICS ═══
RS Rating (Relative Strength):
Normalized strength score 1-99
Compare stocks across different price ranges
Default benchmark: SPX
% Return:
Simple percentage price change
Direct performance comparison
11 Time Periods:
1 Week, 2 Weeks, 1 Month, 2 Months, 3 Months (Default) , 6 Months, 1 Year, YTD, MTD, QTD, Custom (1-500 days)
Result: 22 analytical combinations (2 metrics × 11 periods)
━━━━━━━━━━━━━━━━━━━━━━━━━━━━━━━━━━━━━━━━
═══ USE CASES ═══
Sector Rotation Analysis:
Is NVDA's strength semiconductors-specific or tech-wide?
Drill through all 4 levels to find answer
Identify which industry groups are leading/lagging
Finding Hidden Gems:
JPM ranks #3 of 13 in Major Banks
But Financials sector weak overall (68%)
= Relative strength play in weak sector
Cross-Industry Comparison:
129 industries covered
Market-wide scan capability
Find strongest performers across all sectors
━━━━━━━━━━━━━━━━━━━━━━━━━━━━━━━━━━━━━━━━
═══ TECHNICAL SPECIFICATIONS ═══
V32 Stats:
Total Industries: 129
Total Stocks: 1,176
File Size: 82,032 bytes (80.1 KB)
Request Limit: 39 max (Semiconductors), 10-16 typical
Granularity Levels: 4 (Primary → Quaternary)
Smart Stock Allocation:
Technology industries: 60% coverage
Other industries: 35% coverage
Market-cap weighted selection
Formula: MIN(39, MAX(5, CEILING(total × percentage)))
━━━━━━━━━━━━━━━━━━━━━━━━━━━━━━━━━━━━━━━━
═══ KEY ADVANTAGES ═══
vs. Single Industry Tools:
✓ 129 industries vs 1
✓ Market-wide perspective
✓ Hierarchical navigation
✓ Sector rotation detection
vs. Manual Comparison:
✓ No ETF research needed
✓ Instant visual markers
✓ Automatic ranking
✓ One-click drill-down
━━━━━━━━━━━━━━━━━━━━━━━━━━━━━━━━━━━━━━━━
For complete documentation, Python automation scripts, and CSV data files:
github.com
Version: V32
Last Updated: 2025-11-30
Pine Script Version: v5

MTF Trading Helper & Multi AlertsHi dear fellows, I´m using this indicator for my trading, so every then and when I will publish updates on this one.
This indicator should help to identify the right trading setup. I´m using it to trade index futures and stocks.
MTF Trading Helper & Multi Alerts
Overview
This indicator provides a clear visual representation of trend direction across three timeframes. It helps traders identify trend alignment, potential reversals, and optimal entry/exit points by analyzing the relationship between different smoothed timeframes.
You can set up multiple alerts (as one alert in Tradingview)
How It Works
The indicator displays three colored circles representing the smoothed candle direction on three different timeframes:
Bottom plot represents the overall trend direction, the plot in the middle shows intermediate momentum, and the one on top captures short-term price action.
When a color change occurs, the circle appears in a darker shade to highlight the transition.
🟢 Green = Bullish - 🔴 Red = Bearish
This change can also trigger multiple alerts.
Timeframe Settings - important
Choose between two trading setups, either for:
Intraday 1-minute candles or 1h for swing trading. Set up your chart accordingly to that timeframe.
Intraday | 1Min chart candles
Swing | 1 hour chart candles
Plots
TF3 represents the overall trend direction (bottom), TF2 shows intermediate momentum (middle), and TF1 captures short-term price action (top).
Interpretation & Strategy Alerts
1. Trend Bullish (TF3 turns Green)
The higher timeframe has shifted bullish - a potential new uptrend is forming.
Example: You're watching ES-mini on the Intraday setting. TF3 turns green after being red for several days. This signals the broader trend may be shifting bullish - consider looking for long opportunities.
2. Trend Bearish (TF3 turns Red)
The higher timeframe has shifted bearish - consider protecting profits or exiting long positions.
Example: You hold a long position in Es-mini. TF3 turns red, indicating the macro trend is weakening. This is your signal to take profits or tighten stop-losses.
3. Possible Accumulation (TF3 Red + TF2 turns Green)
While the overall trend is still bearish, the medium timeframe shows buying pressure. Smart money may be accumulating - watch closely for a potential trend reversal.
Example: Es-mini has been in a downtrend (TF3 red). Suddenly TF2 turns green while TF3 remains red. This could indicate institutional buying before a reversal. Don't buy yet, but add it to your watchlist and wait for confirmation.
4. Trend Continuation (TF3 Green + TF2 turns Green)
The medium timeframe realigns with the bullish macro trend - a potential buying opportunity as momentum returns to the uptrend.
Example: Es-mini is in an uptrend (TF3 green). After a pullback, TF2 was red but now turns green again. The pullback appears to be over - this is a trend continuation signal and a potential entry point.
5. Buy the Dip (TF3 + TF2 Green + TF1 turns Green)
All timeframes are now aligned bullish. The short-term pullback is complete and price is resuming the uptrend - optimal entry for short-term trades.
Example: Es-mini is trending up (TF3 + TF2 green). A small dip caused TF1 to turn red briefly. When TF1 turns green again, all three timeframes are aligned - this is your "Buy the Dip" signal with strong confirmation.
6. Sell the Dip (TF3 + TF2 Green + TF1 turns Red)
Short-term weakness within an uptrend. This can be used to take partial profits, wait for a better entry, or trail stops tighter.
Example: You're long on ES-mini with TF3 and TF2 green. TF1 turns red, indicating short-term selling pressure. Consider taking partial profits here and wait for TF1 to turn green again (Buy the Dip) to add back to your position.
How to Use
Choose your scenario: Select "Intraday" 1min-chart for day trading or "Swing" 1h-chart for swingtrading
Enable alerts: Turn on the strategy alerts you want to receive in the settings
Wait for signals: Let the indicator notify you when conditions align
Confirm with price action: Always use additional confirmation before entering trades
Best Practices
✅ Use TF3 as your trend filter - only take longs when TF3 turns green and hold them :)
✅ Use TF2 for timing - wait for TF2 to align with TF3 for swings.
✅ Use TF2 for early entries (accumulation phase) when TF3 is still red. Watch out!
✅ Use TF1 for entries when TF3 and TF2 are green. Only buy if TF1 is red. Keep it short and sweet.
✅ Combine with support/resistance levels for better entries
✅ Use proper risk management - no indicator is 100% accurate
Disclaimer
This indicator is for educational purposes only. Past performance does not guarantee future results. Always do your own research and use proper risk management. Never risk more than you can afford to lose.

Buy Sell Signal — Ema crossover [© gyanapravah_odisha]Professional EMA Crossover + ATR Risk Control
Trade with confidence using a complete system that gives you clear entries, smart exits, and full automation.
Includes:
Precision 5/13 EMA crossover signals
ATR-based adaptive stop-loss
Multiple take-profit levels (with intermediate targets)
Fully customizable R:R ratios
ATR + volume filters to avoid choppy markets
Real-time trade dashboard
All alerts included
Built for: Crypto, Forex, Stocks • Scalping & Swing Trading
Built for you: Free, open-source & made for real-world trading.
