Market Internals (TICK, ADD, VOLD, TRIN, VIX)OVERVIEW
This script allows you to perform data transformations on Market Internals, across exchanges, and specify signal parameters, to more easily identify sentiment extremes.
Notable transformations include:
1. Cumulative session values
2. Directional bull-bear Ratios and Percent Differences
3. Data Normalization
4. Noise Reduction
This kind of data interaction is very useful for understanding the relationship between two mutually exclusive metrics, which is the essence of Market Internals: Up vs. Down. Even so, they are not possible with symbol expressions alone. And the kind of symbol expression needed to produce baseline data that can be reliably transformed is opaque to most traders, made worse by the fact that prerequisite symbol expressions themselves are not uniform across symbols. It's very nuanced, and if this last bit was confusing … exactly.
All this to say, rather than forcing that burden onto you, I've baked the baseline symbol expressions into the indicator so: 1) the transform functions consistently ingest the baseline data in the correct format and 2) you don't have to spend time trying to figure it all out. Trading is hard. There's no need to make it harder.
INPUTS
Indicator
Allows you to specify the base Market Internal and Exchange data to use. The list of Market Internals is simplified to their fundamental representation (TICK, ADD, VOLD, TRIN, VIX, ABVD, TKCD), and the list of Exchange data is limited to the most common (NYSE, NASDAQ, All US Stocks). There are also options for basic exchange combinations (Sum or Average of NYSE & NASDAQ).
Mode
Short for "Plot Mode", this is where you specify the bars style (Candles, Bars, Line, Circles, Columns) and the source value (used for single value plots and plot color changes).
Scale
This is the first and second data transformation grouped together. The default is to show the origin data as it might appear on a chart. You can then specify if each bar should retain it's unique value (Bar Value) or be added to a running total (Cumulative). You can also specify if you would like the data to remain unaltered (Raw) or converted to a directional ratio (Ratio) or a percentage (Percent Diff). These options determine the scale of the plot.
Both Ratio and Percent Diff. convert a given symbol into a positive or negative number, where positive numbers are bullish and negative numbers are bearish.
Ratio will divide Bull values by Bear values, then further divide -1 by the quotient if it is less than 1. For example, if "0.5" was the quotient, the Ratio would be "-2".
Percent Diff. subtracts Bear values from Bull values, then divides that difference by the sum of Bull and Bear values multiplied by 100. If a Bull value was "3" and Bear value was "7", the difference would be "-4", the sum would be "10", and the Percent Diff. would be "-40", as the difference is both bearish and 40% of total.
Ratio Norm. Threshold
This is the third data transformation . While quotients can be less than 1, directional ratios are never less than 1. This can lead to barcode-like artifacts as plots transition between positive and negative values, visually suggesting the change is much larger than it actually is. Normalizing the data can resolve this artifact, but undermines the utility of ratios. If, however, only some of the data is normalized, the artifact can be resolved without jeopardizing its contextual usefulness.
The utility of ratios is how quickly they communicate proportional differences. For example, if one side is twice as big as the other, "2" communicates this efficiently. This necessarily means the numerical value of ratios is worth preserving. Also, below a certain threshold, the utility of ratios is diminished. For example, an equal distribution being represented as 0, 1, 1:1, 50/50, etc. are all equally useful. Thus, there is a threshold, above which we want values to be exact, and below which the utility of linear visual continuity is more important. This setting accounts for that threshold.
When this setting is enabled, a ratio will be normalized to 0 when 1:1, scaled linearly toward the specified threshold when greater than 1:1, and then retain its exact value when the threshold is crossed. For example, with a threshold of "2", 1:1 = 0, 1.5:1 = 1, 2:1 = 2, 3:1 = 3, etc.
With all this in mind, most traders will want to set the ratios threshold at a level where accuracy becomes more important than visual continuity. If this level is unknown, "2" is a good baseline.
Reset cumulative total with each new session
Cumulative totals can be retained indefinitely or be reset each session. When enabled, each session has its own cumulative total. When disabled, the cumulative total is maintained indefinitely.
Show Signal Ranges
Because everything in this script is designed to make identifying sentiment extremes easier, an obvious inclusion would be to not only display ranges that are considered extreme for each Market Internal, but to also change the color of the plot when it is within, or beyond, that range. That is exactly what this setting does.
Override Max & Min
While the min-max signal levels have reasonable defaults for each symbol and transformation type, the Override Max and Override Min options allow you to … (wait for it) … override the max … and min … signal levels. This may be useful should you find a different level to be more suitable for your exact configuration.
Reduce Noise
This is the fourth data transformation . While the previous Ratio Norm. Threshold linearly stretches values between a threshold and 0, this setting will exponentially squash values closer to 0 if below the lower signal level.
The purpose of this is to compress data below the signal range, then amplify it as it approaches the signal level. If we are trying to identify extremes (the signal), minimizing values that are not extreme (the noise) can help us visually focus on what matters.
Always keep both signal zones visible
Some traders like to zoom in close to the bars. Others prefer to keep a wider focus. For those that like to zoom in, if both signals were always visible, the bar values can appear squashed and difficult to discern. For those that keep a wider focus, if both signals were not always visible, it's possible to lose context if a signal zone is vertically beyond the pane. This setting allows you to decide which scenario is best for you.
Plot Colors
These define the default color, within signal color, and beyond signal color for Bullish and Bearish directions.
Plot colors should be relative to zero
When enabled, the plot will inherit Bullish colors when above zero and Bearish colors when below zero. When disabled and Directional Colors are enabled (below), the plot will inherit the default Bullish color when rising, and the default Bearish color when falling. Otherwise, the plot will use the default Bullish color for all directions.
Directional colors
When the plot colors should be relative to zero (above), this changes the opacity of a bars color if moving toward zero, where "100" percent is the full value of the original color and "0" is transparent. When the plot colors are NOT relative to zero, the plot will inherit Bullish colors when rising and Bearish colors when falling.
Differentiate RTH from ETH
Market Internal data is typically only available during regular trading hours. When this setting is enabled, the background color of the indicator will change as a reminder that data is not available outside regular trading hours (RTH), if the chart is showing electronic trading hours (ETH).
Show zero line
Similar to always keeping signal zones visible (further up), some traders prefer zooming in while others prefer a wider context. This setting allows you to specify the visibility of the zero line to best suit your trading style.
Linear Regression
Polynomial regressions are great for capturing non-linear patterns in data. TradingView offers a "linear regression curve", which this script is using as a substitute. If you're unfamiliar with either term, think of this like a better moving average.
Symbol
While the Market Internal symbol will display in the status line of the indicator, the status line can be small and require more than a quick glance to read properly. Enabling this setting allows you to specify if / where / how the symbol should display on the indicator to make distinguishing between Market Internals more efficient.
Speaking of symbols, this indicator is designed for, and limited to, the following …
TICK - The TICK subtracts the total number of stocks making a downtick from the total number of stocks making an uptick.
ADD - The Advance Decline Difference subtracts the total number of stocks below yesterdays close from the total number of stocks above yesterdays close.
VOLD - The Volume Difference subtracts the total declining volume from the total advancing volume.
TRIN - The Arms Index (aka. Trading Index) divides the ratio of Advancing Stocks / Volume by the ratio of Declining Stocks / Volume. Given the inverse correlation of this index to market movement, when transforming it to a Ratio or Percent Diff., its values are inverted to preserve the bull-bear sentiment of the transformations.
VIX - The CBOE Volatility Index is derived from SPX index option prices, generating a 30-day forward projection of volatility. Given the inverse correlation of this index to market movement, when transforming it to a Ratio or Percent Diff., its values are inverted and normalized to the sessions first bar to preserve the bull-bear sentiment of the transformations. Note: If you do not have a Cboe CGIF subscription , VIX data will be delayed and plot unexpectedly.
ABVD - The Above VWAP Difference is an unofficial index measuring all stocks above VWAP as a percent difference. For the purposes of this indicator (and brevity), TradingViews PCTABOVEVWAP has has been shortened to simply be ABVD.
TKCD - The Tick Cumulative Difference is an unofficial index that subtracts the total number of market downticks from the total number of market upticks. Where "the TICK" (further up) is a measurement of stocks ticking up and down, TKCD is a measurement of the ticks themselves. For the purposes of this indicator (and brevity), TradingViews UPTKS and DNTKS symbols have been shorted to simply be TKCD.
INSPIRATION
I recently made an indicator automatically identifying / drawing daily percentage levels , based on 4 assumptions. One of these assumptions is about trend days. While trend days do not represent the majority of days, they can have big moves worth understanding, for both capitalization and risk mitigation.
To this end, I discovered:
• Article by Linda Bradford Raschke about Capturing Trend Days.
• Video of Garrett Drinon about Trend Day Trading.
• Videos of Ryan Trost about How To Use ADD and TICK.
• Article by Jason Ruchel about Overview of Key Market Internals.
• Including links to resources outside of TradingView violates the House Rules, but they're not hard to find, if interested.
These discoveries inspired me adopt the underlying symbols in my own trading. I also found myself wanting to make using them easier, the net result being this script.
While coding everything, I also discovered a few symbols I believe warrant serious consideration. Specifically the Percent Above VWAP symbols and the Up Ticks / Down Ticks symbols (referenced as ABVD and TKCD in this indicator, for brevity). I found transforming ABVD or TKCD into a Ratio or Percent Diff. to be an incredibly useful and worthy inclusion.
ABVD is a Market Breadth cousin to Brian Shannon's work, and TKCD is like the 3rd dimension of the TICKs geometry. Enjoy.
Tìm kiếm tập lệnh với "spx"

Rule of 16 - LowerThe "Rule of 16" is a simple guideline used by traders and investors to estimate the expected annualized volatility of the S&P 500 Index (SPX) based on the level of the CBOE Volatility Index (VIX). The VIX, often referred to as the "fear gauge" or "fear index," measures the market's expectations for future volatility. It is calculated using the implied volatility of a specific set of S&P 500 options.
The Rule of 16 provides a rough approximation of the expected annualized percentage change in the S&P 500 based on the VIX level. Here's how it works:
Find the VIX level: Look up the current value of the VIX. Let's say it's currently at 20.
Apply the Rule of 16: Divide the VIX level by 16. In this example, 20 divided by 16 equals 1.25.
Result: The result of this calculation represents the expected annualized percentage change in the S&P 500. In this case, 1.25% is the estimated annualized volatility.
So, according to the Rule of 16, a VIX level of 20 suggests an expected annualized volatility of approximately 1.25% in the S&P 500.
Here's how you can use the Rule of 16:
Market Sentiment: The VIX is often used as an indicator of market sentiment. When the VIX is high (above its historical average), it suggests that investors expect higher market volatility, indicating potential uncertainty or fear in the markets. Conversely, when the VIX is low, it suggests lower expected volatility and potentially more confidence in the markets.
Risk Management: Traders and investors can use the Rule of 16 to estimate the potential risk associated with their portfolios. For example, if you have a portfolio of S&P 500 stocks and the VIX is at 20, you can use the Rule of 16 to estimate that the annualized volatility of your portfolio may be around 1.25%. This information can help you make decisions about position sizing and risk management.
Option Pricing: Options traders may use the Rule of 16 to get a quick estimate of the implied annualized volatility priced into S&P 500 options. It can help them assess whether options are relatively expensive or cheap based on the VIX level.
It's important to note that the Rule of 16 is a simplification and provides only a rough estimate of expected volatility. Market conditions and the relationship between the VIX and the S&P 500 can change over time. Therefore, it should be used as a guideline rather than a precise forecasting tool. Traders and investors should consider other factors and use additional analysis to make informed decisions.

McClellan Indicators (Oscillator, Summation Index w/ RSI & MACD)Four indicators in one based on the McClellan Oscillator for both the NYSE and Nasdaq exchanges. Designed to be used in conjunction with each other- plot the Oscillator (Osc), Summation Index (MSI), and RSI/MACD of the MSI on both your SPX and Nasdaq chart. Select the exchange and indicator within the settings. These tools are secondary- but when the signals are combined with the action of the index and stocks can be helpful in identifying market turns and trend strength.
McClellan Oscillator--
The Osc is a market breadth tool that uses a fast and slow EMA based on the difference between advancing and declining stocks on the exchange. Used primarily to identify breadth thrusts, divergences, and extremes (oversold/overbought). Plot horizontal levels to see when the market internals are extremely overbought or oversold, and take note of when the Osc is declining while the market is advancing or vice versa.
McClellan Summation Index--
For intermediate trends the MSI is a running total of the Osc which can be used to confirm the strength of a trend, and spot potential reversals. A 10 period ema is included on this indicator, where crossovers can aid in spotting the change in trend of market internals, and divergences can identify when market internals are not in line with the trend. Shading is applied for when the internals are in a bullish or bearish trend.
Two additional indicators are the RSI and MACD of the Summation Index. An overbought or oversold MSI RSI generally indicates a strong trend in the market internals, however you may want to take note when the RSI stalls and begins to "hook" in the opposite direction. This indicator has signals to show when the market internals may be turning and to be on lookout for trend change.
Similarly- the MACD of the MSI identifies the strength of the trend, and crossovers can be used to help spot reversals. Shading is included in this indicator to spot the bullish/bearish trend of internals.

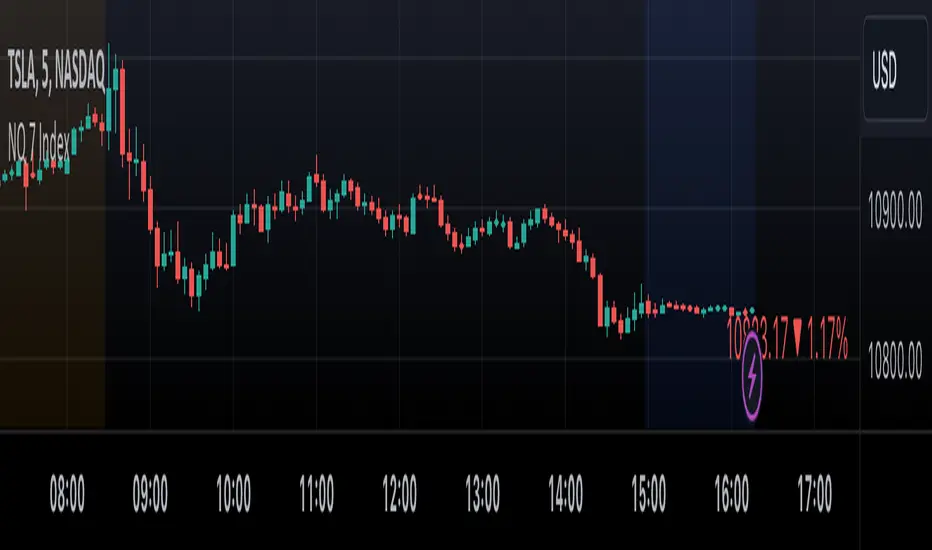
NQ 7 IndexThis is a simple index-like script that adds up the market value of the magnificent 7 (AAPL, MSFT, NVDA, TSLA, META, AMZN, GOOG) and divided by a constant.
The way this works is similar to SPX and NDX, except that it doesn't have any special weighting mechanism.
Average Range LinesThis Average Range Lines indicator identifies high and low price levels based on a chosen time period (day, week, month, etc.) and then uses a simple moving average over the length of the lookback period chosen to project support and resistance levels, otherwise referred to as average range. The calculation of these levels are slightly different than Average True Range and I have found this to be more accurate for intraday price bounces.
Lines are plotted and labeled on the chart based on the following methodology:
+3.0: 3x the average high over the chosen timeframe and lookback period.
+2.5: 2.5x the average high over the chosen timeframe and lookback period.
+2.0: 2x the average high over the chosen timeframe and lookback period.
+1.5: 1.5x the average high over the chosen timeframe and lookback period.
+1.0: The average high over the chosen timeframe and lookback period.
+0.5: One-half the average high over the chosen timeframe and lookback period.
Open: Opening price for the chosen time period.
-0.5: One-half the average low over the chosen timeframe and lookback period.
-1.0: The average low over the chosen timeframe and lookback period.
-1.5: 1.5x the average low over the chosen timeframe and lookback period.
-2.0: 2x the average low over the chosen timeframe and lookback period.
-2.5: 2.5x the average low over the chosen timeframe and lookback period.
-3.0: 3x the average low over the chosen timeframe and lookback period.
Look for price to find support or resistance at these levels for either entries or to take profit. When price crosses the +/- 2.0 or beyond, the likelihood of a reversal is very high, especially if set to weekly and monthly levels.
This indicator can be used/viewed on any timeframe. For intraday trading and viewing on a 15 minute or less timeframe, I recommend using the 4 hour, 1 day, and/or 1 week levels. For swing trading and viewing on a 30 minute or higher timeframe, I recommend using the 1 week, 1 month, or longer timeframes. I don’t believe this would be useful on a 1 hour or less timeframe, but let me know if the comments if you find otherwise.
Based on my testing, recommended lookback periods by timeframe include:
Timeframe: 4 hour; Lookback period: 60 (recommend viewing on a 5 minute or less timeframe)
Timeframe: 1 day; Lookback period: 10 (also check out 25 if your chart doesn’t show good support/resistance at 10 days lookback – I have found 25 to be useful on charts like SPX)
Timeframe: 1 week; Lookback period: 14
Timeframe: 1 month; Lookback period: 10
The line style and colors are all editable. You can apply a global coloring scheme in the event you want to add this indicator to your chart multiple times with different time frames like I do for the weekly and monthly.
I appreciate your comments/feedback on this indicator to improve. Also let me know if you find this useful, and what settings/ticker you find it works best with!
Also check out my profile for more indicators!

Global Liquidity IndexThe Global Liquidity Index offers a consolidated view of all major central bank balance sheets from around the world. For consistency and ease of comparison, all values are converted to USD using their relevant forex rates and are expressed in trillions. The indicator incorporates specific US accounts such as the Treasury General Account (TGA) and Reverse Repurchase Agreements (RRP), both of which are subtracted from the Federal Reserve's balance sheet to give a more nuanced view of US liquidity. Users have the flexibility to enable or disable specific central banks and special accounts based on their preference. Only central banks that both don’t engage in currency pegging and have reliable data available from late 2007 onwards are included in this aggregated liquidity model.
Global Liquidity Index = Federal Reserve System (FED) - Treasury General Account (TGA) - Reverse Repurchase Agreements (RRP) + European Central Bank (ECB) + People's Bank of China (PBC) + Bank of Japan (BOJ) + Bank of England (BOE) + Bank of Canada (BOC) + Reserve Bank of Australia (RBA) + Reserve Bank of India (RBI) + Swiss National Bank (SNB) + Central Bank of the Russian Federation (CBR) + Central Bank of Brazil (BCB) + Bank of Korea (BOK) + Reserve Bank of New Zealand (RBNZ) + Sweden's Central Bank (Riksbank) + Central Bank of Malaysia (BNM).
This tool is beneficial for anyone seeking to get a snapshot of global liquidity to interpret macroeconomic trends. By examining these balance sheets, users can deduce policy trajectories and evaluate the global economic climate. It also offers insights into asset pricing and assists investors in making informed capital allocation decisions. Historically, riskier assets, such as small caps and cryptocurrencies, have typically performed well during periods of rising liquidity. Thus, it may be prudent for investors to avoid additional risk unless there's a consistent upward trend in global liquidity.

Market Smith IndicatorsMarket Smith has a collection of tools that are useful for identifying stocks. On their charts they have a 21/50/200 day moving averages, high and low pivot points, a relative strength line, and a relative strength rating. This script contains indicators for the following:
21/50/200 Day Moving Averages
High and Low pivot points
A Relative Strength line
A Relative Strength rating
21/50/200 Day Moving Averages
The 21/50/200 Day moving averages are simple moving averages. They are visible in any chart increment but to use them properly you need to set you charts to be by day. Labels will appear on the right of the lines to show that they are representative of 21/50/200 day moving averages.
High and Low pivot points
The High and Low pivot points are green for high pivot points and red for low points. They are show in the Market Smith style with the numbers simply above the pivot points.
Relative Strength line
The Relative Strength line is a line that shows the strength of the stock compared to the S&P 500. In this case we utilize the SPX ticker to compare the stock to. This line is almost identical to the Market Smith tool and is an excellent tool to determine how a stock is doing compared to the market. When movements in the stock and shown with sideways trending of the RS line that means that the stock is following the market. When a stock is outperforming the market the RS line will follow.
Relative Strength rating
Thank you to ©Fred6724 for the RS Rating inspiration. They wrote excellent open source code for a RS Rating comparable to Market Smith. As the RS Rating in Market Smith is not open source it is difficult to know exactly how it is being calculated. After simplifying Fred's code and building upon a few ideas I had I compared the RS Rating to multiple Market Smith Ratings. The rating is close but often off by multiple points. If there is anyone who has a better idea on how to get this rating or how to improve on the code please send me a PM or fork this project. This rating is a good indicator to see how a certain stock compares to other stocks in the market. In Market Smith they are able to utilize their database to compare it to all other stocks. Since we do not have access to the same tools we are only able to compare it to the percentage of stocks above the 200, 150, 100, 50, and 20 day moving average.
Using these tools together are a small fraction what make people like Bill O'neill and Jim Roppel so successful. I plan on updating the RS Rating as I continue to work on this project so if there is anyone who has ideas then please send me a PM. Ultimately the goal of this project is to have a solution that is identical to Market Smith.

CE - Market Performance TableThe 𝓜𝓪𝓻𝓴𝓮𝓽 𝓟𝓮𝓻𝓯𝓸𝓻𝓶𝓪𝓷𝓬𝓮 𝓣𝓪𝓫𝓵𝓮 is a sophisticated market tool designed to provide valuable insights into the current market trends and the approximate current position in the Macroeconomic Regime.
Furthermore the 𝓜𝓪𝓻𝓴𝓮𝓽 𝓟𝓮𝓻𝓯𝓸𝓻𝓶𝓪𝓷𝓬𝓮 𝓣𝓪𝓫𝓵𝓮 provides the Correlation Implied Trend for the Asset on the Chart. Lastly it provides information about current "RISK ON" or "RISK OFF" periods.
Methodology:
𝓜𝓪𝓻𝓴𝓮𝓽 𝓟𝓮𝓻𝓯𝓸𝓻𝓶𝓪𝓷𝓬𝓮 𝓣𝓪𝓫𝓵𝓮 tracks the 15 underlying Stock ETF's to identify their performance and puts the combined performances together to visualize 42MACRO's GRID Equity Model.
For this it uses the below ETF's:
Dividends (SPHD)
Low Beta (SPLV)
Quality (QUAL)
Defensives (DEF)
Growth (IWF)
High Beta (SPHB)
Cyclicals (IYT, IWN)
Value (IWD)
Small Caps (IWM)
Mid Caps (IWR)
Mega Cap Growth (MGK)
Size (OEF)
Momentum (MTUM)
Large Caps (IWB)
Overall Settings:
The main time values you want to change are:
Correlation Length
- Defines the time horizon for the Correlation Table
ROC Period
- Defines the time horizon for the Performance Table
Normalization lookback
- Defines the time horizon for the Trend calculation of the ETF's
- For longer term Trends over weeks or months a length of 50 is usually pretty accurate
Visuals:
There is a variety of options to change the visual settings of what is being plotted and the two table positions and additional considerations.
Everything that is relevant in the underlying logic that can help comprehension can be visualized with these options.
Market Correlation:
The Market Correlation Table takes the Correlation of the above ETF's to the Asset on the Chart, it furthermore uses the Normalized KAMA Oscillator by IkkeOmar to analyse the current trend of every single ETF.
It then Implies a Correlation based on the Trend and the Correlation to give a probabilistically adjusted expectation for the future Chart Asset Movement. This is strengthened by taking the average of all Implied Trends.
With this the Correlation Table provides valuable insights about probabilistically likely Movement of the Asset, for Traders and Investors alike, over the defined time duration.
Market Performance:
𝓜𝓪𝓻𝓴𝓮𝓽 𝓟𝓮𝓻𝓯𝓸𝓻𝓶𝓪𝓷𝓬𝓮 𝓣𝓪𝓫𝓵𝓮 is the actual valuable part of this Indicator.
It provides valuable information about the current market environment (whether it's risk on or risk off), the rough GRID models from 42MACRO and the actual market performance.
This allows you to obtain a deeper understanding of how the market works and makes it simple to identify the actual market direction.
Utility:
The 𝓜𝓪𝓻𝓴𝓮𝓽 𝓟𝓮𝓻𝓯𝓸𝓻𝓶𝓪𝓷𝓬𝓮 𝓣𝓪𝓫𝓵𝓮 is divided in 4 Sections which are the GRID regimes:
Economic Growth:
Goldilocks
Reflation
Economic Contraction:
Inflation
Deflation
Top 5 Equity Style Factors:
Are the values green for a specific Column? If so then the market reflects the corresponding GRID behavior.
Bottom 5 Equity Style Factors:
Are the values red for a specific Column? If so then the market reflects the corresponding GRID behavior.
So if we have Goldilocks as current regime we would see green values in the Top 5 Goldilocks Cells and red values in the Bottom 5 Goldilocks Cells.
You will find that Reflation will look similar, as it is also a sign of Economic Growth.
Same is the case for the two Contraction regimes.

REVE Cohorts - Range Extension Volume Expansion CohortsREVE Cohorts stands for Range Extensions Volume Expansions Cohorts.
Volume is divided in four cohorts, these are depicted in the middle band with colors and histogram spikes.
0-80 percent i.e. low volumes; these get a green color and a narrow histogram bar
80-120 percent, normal volumes, these get a blue color and a narrow histogram bar
120-200 percent, high volume, these get an orange color and a wide histogram bar
200 and more percent is extreme volume, maroon color and wide bar.
All histogram bars have the same length. They point to the exact candle where the volume occurs.
Range is divided in two cohorts, these are depicted as candles above and below the middle band.
0-120 percent: small and normal range, depicted as single size, square candles
120 percent and more, wide range depicted as double size, rectangular candles.
The range candles are placed and colored according to the Advanced Price Algorithm (published script). If the trend is up, the candles are in the uptrend area, which is above the volume band, , downtrend candles below in the downtrend area. Dark blue candles depict a price movement which confirms the uptrend, these are of course in the uptrend area. In this area are also light red candles with a blue border, these depict a faltering price movement countering the uptrend. In the downtrend area, which is below the volume band, are red candles which depict a price movement confirming the downtrend and light blue candles with a red border depicting price movement countering the downtrend. A trend in the Advanced Price Algorithm is in equal to the direction of a simple moving average with the same lookback. The indicator has the same lagging.as this SMA.
Signals are placed in the vacated spaces, e.g. during an uptrend the downtrend area is vacated.
There are six signals, which arise as follows:
1 Two blue triangles up on top of each other: high or extreme volume in combination with wide range confirming uptrend. This indicates strong and effective up pressure in uptrend
2 Two pink tringles down on top of each other: high or extreme volume in combination with wide range down confirming downtrend. This indicates strong and effective down pressure in downtrend
3 Blue square above pink down triangle down: extreme volume in combination with wide range countering uptrend. This indicates a change of heart, down trend is imminent, e.g. during a reversal pattern. Down Pressure in uptrend
4 Pink square below blue triangle up: extreme volume in combination with wide range countering downtrend. This indicates a change of heart, reversal to uptrend is imminent. Up Pressure in downtrend
5 single blue square: a. extreme volume in combination with small range confirming uptrend, b. extreme volume in combination with small range countering downtrend, c. high volume in combination with wide range countering uptrend. This indicates halting upward price movement, occurs often at tops or during distribution periods. Unresolved pressure in uptrend
6 Single pink square: a extreme volume in combination with small range confirming downtrend, b extreme volume in combination with small range countering uptrend, c high volume in combination with wide range countering downtrend. This indicated halting downward price movement. Occurs often at bottoms or during accumulation periods. Unresolved pressure in downtrend.
The signals 5 and 6 are introduced to prevent flipping of signals into their opposite when the lookback is changed. Now signals may only change from unresolved in directional or vice versa. Signals 3 and 4 were introduced to make sure that all occurrences of extreme volume will result in a signal. Occurrences of wide volume only partly lead to a signal.
Use of REVE Cohorts.
This is the indicator for volume-range analyses that I always wanted to have. Now that I managed to create it, I put it in all my charts, it is often the first part I look at, In my momentum investment system I use it primarily in the layout for following open positions. It helps me a lot to decide whether to close or hold a position. The advantage over my previous attempts to create a REVE indicator (published scripts), is that this version is concise because it reports and classifies all possible volumes and ranges, you see periods of drying out of volume, sequences of falter candles, occurrences of high morning volume, warning and confirming signals.. The assessment by script whether some volume should be considered low, normal, high or extreme gives an edge over using the standard volume bars.
Settings of REVE Cohorts
The default setting for lookback is ‘script sets lookback’ I put this in my indicators because I want them harmonized, the script sets lookback according to timeframe. The tooltip informs which lookback will be set at which timeframe, you can enable a feedback label to show the current lookback. If you switch ‘script sets lookback’ off, you can set your own preferred user lookback. The script self-adapts its settings in such a way that it will show up from the very first bar of historical chart data, it adds volume starting at the fourth bar.
You can switch off volume cohorts, only range candles will show while the middle band disappears. Signals will remain if volume is present in the data. Some Instruments have no volume data, e.g. SPX-S&P 500 Index,, then only range candles will be shown.
Colors can be adapted in the inputs. Because the script calculates matching colors with more transparency it is advised to use 100 percent opacity in these settings.
Take care, Eykpunter

Regression Candle Conversion IndicatorHey everyone!
I got a pseudo-request a while ago for something like this, essentially the ability to track where another ticker would fall based on an alternative ticker.
I did create my ticker correlation reference indicator which directly looks at the correlation between 2 tickers. However, this is an indicator that operates on the same principle but is more pragmatic for trading.
What does it do?
Well, in keeping with the theme of what I call my indicators, this has a title that explains exactly what it does, "Regression Candle Conversion Indicator" or "RCCI" for short. It uses simple regression to convert one ticker to another. So while you are tracking one indicator, you can see where the expected value should fall on the other.
Applications?
The big application of this for me is being able to track where SPY/QQQ or IWM is falling during overnight trading sessions. Extended trading hours close at 8 pm NYSE time. After that, you have to guess where futures prices will put the ETF version of it. This indicator will allow you to track where, theoretically, the underlying ETF ticker will fall based on the current trading behaviour.
Some other applications are just the ability to track how similar or dissimilar one stock is to the other. For example, if we wanted to trade, say, Boeing using shares of DFEN or ITA (a defence specific ETF), here is what we get:
In the chart above we can see BA as the primary chart and ITA as the RCCI converted chart. We will see 2 major things that should cause us concern.
First, there is a really poor correlation between the two tickers. This indicates that ITA may not produce the best exposure if I am directly looking for Boeing exposure.
Second, there is a wide standard error. this means that the results that the RCCI is providing may be skewed up to +/- 2 points (as indicated by the standard error chart).
Let's take a look at BA and DFEN:
In the above, we can see that the correlation is not great, but the standard error is quite low.
This means that, while this may not be the best ticker for Boeing exposure, the RCCI is able to confidently calculate the ticker within +/- 0.50 cents based on BA's underlying data.
However, its important to note that it is not advisable to really rely on these results if the correlation is less than + 0.5 or greater than -0.5.
Let's take a look at a few more examples:
Above we have BA (NYSE) vs BA (NEO TSX CAD Hedged). We can see the strong relationship and high confidence calculations.
And some others:
SPX (primary) and ES1! (secondary):
RTY and IWM:
ES1! and SPY:
Customizations:
As you can see above, it is pretty straight forward. There are 3 options:
Lookback Length: Determines the length of assessment for correlation and the regression assessment.
Manual Ticker Input: The indicator will pull the data from your current chart and compare it against a manually selected indicator. You must tell the indicator which ticker you are comparing against.
Data Table: This will show you the data table which contains the standard error assessment and the correlation assessment. These are determined by your lookback length. The lookback length is defaulted to 500.
And that's the indicator! It's pretty straight forward. Hopefully you find it helpful, especially if you track futures during overnight sessions.
Leave your comments/questions and feedback below.
Thanks for checking it out!

VIX HeatmapVIX HeatMap
Instructions:
- To be used with the S&P500 index (ES, SPX, SPY, any S&P ETF) as that's the input from where the CBOE calculates and measures the VIX. Can also be used with the Dow Jones, Nasdaq, & Nasdaq100.
Description:
- Expected Implied Volatility regime simplified & visualized. Know if we are in a high, medium, or low volatility regime, instantly.
- Ranges from Hot to Cold: The hotter the heat-map, the higher the implied volatility and fear & vice versa.
- The VIX HeatMap, color-maps important VIX levels (7 in this case) in measuring volatility for day trading & swing trading.
Using the VIX HeatMap:
- A LOW level volatility environment: Represented by "cooler" colors (Blue & White) depicts that the level of volatility and fear is low. Percentage moves on the index level are going to be tame and less volatile more often than not. Low fear = low perceived risk.
- A MEDIUM level volatility environment: Represented by "warmer" colors (Green & Yellow) depicts that the markets are transitioning from a calmer period or from a more fearful period. Market volatility here will be higher and provide more volatile swings in price.
- A HIGH level volatility environment: Represented by "hotter" colors (Orange, Red, & Purple) depicts that the markets are very fearful at the moment and will have big swings in both directions. Historically, extreme VIX levels tend to coincide with bottoms but are in no way predictive of the exact timing as the volatile moves can continue for an extended period of time.
- Transitioning between the 7 VIX Zones: Each and every one of these specific VIX zone levels is important.
1. Extreme low: <16
2. Low: 16 to 20
3. Normal: 20 to 24
4. Medium: 24 to 28
5. Med-High: 28 to 32
6. High: 32 to 36
7. Extreme high: >36
- These VIX levels in particular measure volatility changes that have a major impact on switching between smaller time frames and measuring depths of a sell move and vice versa. Each level also behaves as its own support & resistance level in terms of taking a bit of effort to switch regimes, and aids in identifying and measuring the potential depth of pullbacks in bull markets and bounces in bear markets to reveal reversal points.
- Examples of VIX level supports depicted on the chart marked with arrows. From left to right:
1. March 10th: Markets jumped 2 volatility levels in 2 days. The fluctuations from blue to yellow to green where a sign that price action would reverse from the selloff.
2. March 28th: As soon as we move from green to the blue VIX level (<20), markets began to rally and only ended when the volatility level moved sub VIX 16 (white).
3. May 4th & 24th: Next we see the 2 dips where volatility levels went from blue to green (VIX > 20), marked bottoms and reversed higher.
4. June 1st: We see a change in VIX regime yet again into lower VIX level and markets rocket higher.
Knowing the current VIX regime is a very important tool and aid in trading, now easily visualized.

Correlation TrackerCorrelation Tracker Indicator
The Correlation Tracker indicator calculates and visualizes the correlation between two symbols on a chart. It helps traders and investors understand the relationship and strength of correlation between the selected symbol and another symbol of their choice.
Indicator Features:
- Correlation Calculation: The indicator calculates the correlation between two symbols based on the provided lookback period.
- Correlation Scale: The correlation value is normalized to a scale ranging from 0 to 1 for easy interpretation.
- Table Display: A table is displayed on the chart showing the correlation value and a descriptive label indicating the strength of the correlation.
- Customization Options: Users can customize the text color, table background color, and choose whether to display the Pearson correlation value.
- The Correlation Tracker indicator utilizes a logarithmic scale calculation, making it particularly suitable for longer timeframes such as weekly charts, thereby providing a more accurate and balanced measure of correlations across a wide range of values.
How to Use:
1. Select the symbol for which you want to track the correlation (default symbol is "SPX").
2. Adjust the lookback period to define the historical data range for correlation calculation.
3. Customize the text color and table background color according to your preference.
4. Choose whether to display the Pearson correlation value or a descriptive label for correlation strength.
5. Observe the correlation line on the chart, which changes color based on the strength of the correlation.
6. Refer to the correlation table for the exact correlation value or the descriptive label indicating the correlation strength.
Note: The indicator can be applied to any time frame chart and is not limited to logarithmic scale.

AggBands (v1) [qrsq]The "AggBands" indicator is a custom trading indicator designed to provide a consolidated view of the price action across multiple assets or trading pairs. It combines the price data from multiple tickers and calculates an aggregated price using user-defined weights for each ticker.
The indicator starts by defining the tickers to be included in the aggregation. You can choose from predefined configurations such as "BTC PAIRS," "CRYPTO TOTAL MARKET CAP," "TOP 5 PAIRS," "TOP 5 MEMECOINS," "SPX," "DXY," or "FANG." Each configuration includes specific tickers or indices relevant to the chosen category.
The indicator then fetches the closing, high, and low prices for each ticker and applies the user-defined weights to calculate the aggregated prices. The aggregated prices are normalized within a specified length to provide a consistent scale across different assets or pairs.
Next, the indicator calculates the midpoint, which is the average of the highest high and lowest low of the aggregated prices over a specified aggregation period.
To assess the volatility, the indicator calculates the price range and applies the Average True Range (ATR) indicator to determine the volatility value. The standard deviation is then computed using the price range and aggregation period, with an additional scaling factor applied to the volatility value.
Based on the standard deviation, the indicator generates multiple bands above and below the midpoint. By default, three standard deviation bands are calculated, but the user can choose between one and five bands. The upper and lower bands are smoothed using various moving average (MA) types, such as Simple Moving Average (SMA), Exponential Moving Average (EMA), Smoothed Moving Average (SMMA/RMA), Weighted Moving Average (WMA), Volume Weighted Moving Average (VWMA), Volume Weighted Average Price (VWAP), or Arnaud Legoux Moving Average (ALMA). The user can also adjust the length, offset, and sigma parameters for the moving averages.
The indicator can optionally smooth the midpoint, upper bands, and lower bands using a separate set of moving average parameters.
The indicator can be useful for traders and analysts who want to gain a consolidated view of price movements across multiple assets or trading pairs. It helps identify trends, volatility, and potential support and resistance levels based on the aggregated price and standard deviation bands. Traders can use this information to make informed decisions about trading strategies, risk management, and market analysis.

[TT] Sectors Dist % From MA- The script shows the distance in percentages from the 200 MA (or any other MA period) , for the 11 SP500 sectors.
- It works based on the current time frames.
Could be useful when working with mean reversion strategies to detect extremes zones and overbought/oversold conditions in the given sectors compared others.

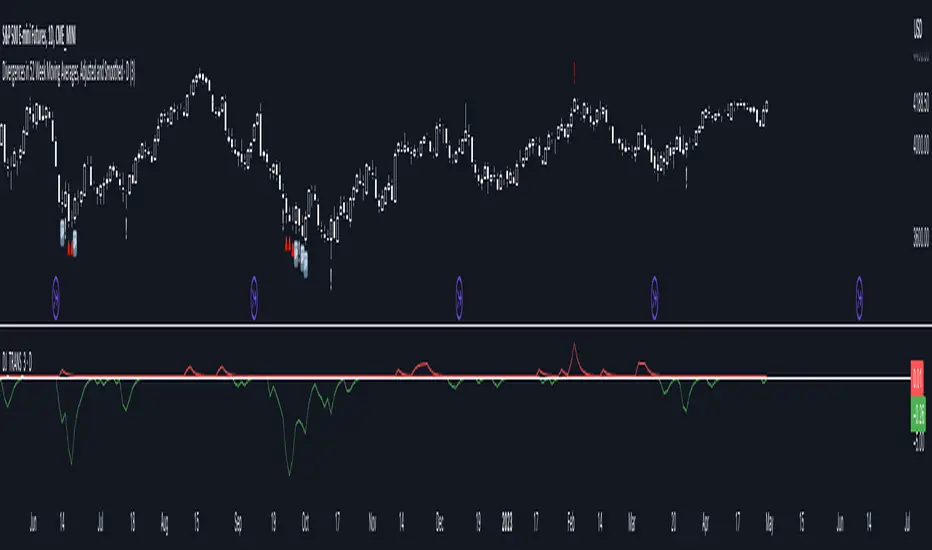
Divergences in 52 Week Moving Averages, Adjusted and SmoothedThis script description is intended to be holistic and comprehensive for the understanding of the interested parties who view the script.
Following the PineCoders suggestions, I have provided detailed breakdowns both within the code and in the description immediately below:
► Description
This description is intended to be detailed and meaningful, conveying the understanding of the script’s intention to the user:
The theory: Divergences and extreme readings in 52-Week highs on major indexes can provide a view into a potential pending move in the opposite direction of how the market has been trending. By comparing the 52-Week Hi/Lo indices and applying an Exponential Moving Average (EMA), we can assess how extreme a move is from the average. If the move provides an extreme reading, it would potentially be beneficial to “fade” the move (take a position in the opposing direction).
The intention: The intentionality of this script is to provide a visualization of when the highly-probable opportunity to fade over a multi-day or multi-week period arises. In addition to this, based on backtesting prior moves and reading the various levels of significant reversals, three tiers: “Standard”, “Sensitive”, and “Highly Sensitive” have been applied, the user can choose which sensitivity level they would like to see, there are far less false positives on the Standard and Sensitive settings, while Highly Sensitive often signals multiple times with the move coming a few days later.
The application: The settings allow the user to customize their sensitivity to the fade signals, with the ability to customize the visual that shows up as well. For higher-highs that are fade-worthy, the signal will appear on the top of the candle, for lower-lows that are fade-worthy, the signal will appear on the bottom of the candle. The users risk criteria should be the primary driver of the entry/exit, although when backtesting it appears that the significant move is typically completed within a 2-4 week period at max and 3-5 day period at minimum.
A personal note: I am a futures trader intraday but would very strongly caution users when using this strategy with futures (unless their risk tolerance is higher than most). The most beneficial strategy when fading moves would be to enter in tranches, starting at the first signal and adding on any pullback (as long as the pullback is not below the initial entry point). 1-6 Week Date-To-Expiry options would be the primary method for applying this strategy. I would also like to add that SPY/SPX options (SPDR S&P 500 ETF Trust / CBOE S&P 500 Index) are the most liquid options that could be applied in this strategy.
► Description (additional)
With the understanding that few users can read pinescript (Pine), the description above contains all of the necessary information that is necessary for a user to understand the intention for script utilization. For those who do understand Pine, the code is commented in each section in order to provide an understanding of the underlying functions, calculations, and thought process that went on during the writing of the script.
► Description (additional)
This script’s description contains no delegations, all aspects of the script as well as the initial idea behind it are contained in the description above, which is self-contained in it’s entirety with a clear and defined purpose that is written with the intent to holistically capture the intent of the potential use for this indicator.
► General House Rule #2
This script and the description (as well as my profile) contain no links or associations to promotion of any kind, I am not a business, I am not an individual that will in any way make money from this script or the promotion of another person, idea, company, entity, or legal persons (foreign or domestic).
► Originality and usefulness
This is an original and custom script (and idea) that is not a rehashing or a copy of any code from any other programmers in the tradingview community.
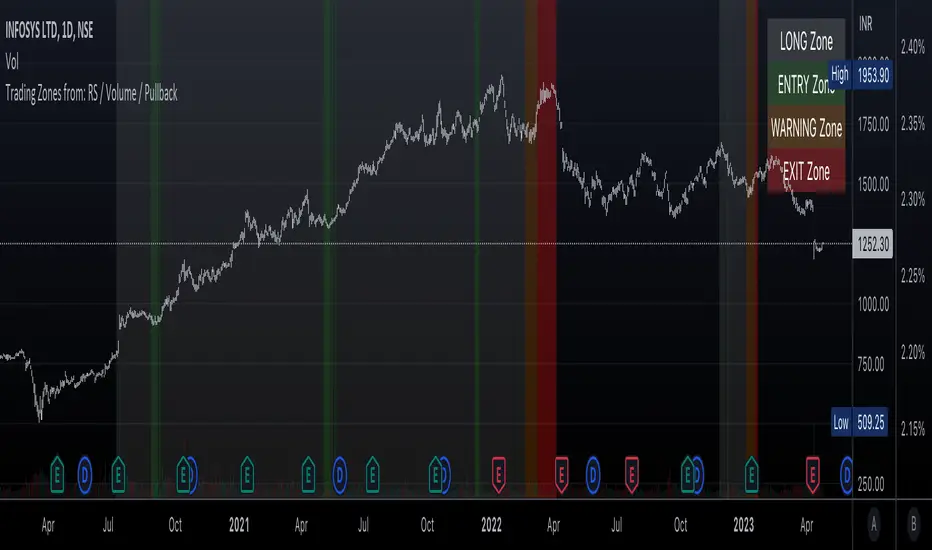
Trading Zones based on RS / Volume / PullbackThis is an Indicator which identifies different Trading Zones on the chart.
This should be Primarily used for Long Trades.
Trading Zones: and the Reasoning behind them
Long Zone -> One can do a Potential Entry (Buy) when this Zone is identified, but one could also wait for 'Entry Zone' (explained next) for a better Risk/Reward Trade.
Long Zones are identified with the help of Relative Strength and by an Intermediate Top in price.
Entry Zone -> This can be a better Risk/Reward zone to enter positions within the Long Zone.
Entry Zone is identified by a Pullback in Price & Volume contraction after the Long Zone is activated
Warning Zone -> One needs to be careful in this zone, no need to panic, Script will now try to find an Exit when Price Retraces towards Highs.
Warning Zone identifies weakness in the Price using Relative Strength of the current Stock (w.r.t. the Reference Symbol configured) and the severity of Pullback in Price.
Exit Zone -> are found only after transitioning to Warning Zone, this is a Zone which helps in minimising losses after a trade has gone into losses. Exit Zone is identified by making sure a local peak forms in Warning Zone. However, there are instances when Exit Zone detection can get prolonged when a local price peak is not formed soon enough. So one needs to be careful and use other strategies for exit.
------------------------------------------------------------------------------------
What is different in this Script:
The Script uses Relative Strength in combination with Pullback in Price from Highs in a Novel way.
Over-trading is avoided by ignoring Sideways price movements, using Relative Strength.
Only Trending Upward movement is detected and traded.
How to use this Indicator:
Use these 'Trading Zones' only as a reference so it can minimise your time in screening stocks.
Preferred Settings for using the Indicator:
Stick to 1-Day candles
Keep Relative Symbol as "Nifty" for Indian Stocks.
For US stocks, we can use "SPX" as the Relative Symbol.
//----------------
FEW EXAMPLES:
//----------------
ASIANPAINT
TATAMOTORS
TITAN
ITC
DIVISLAB
MARUTI
---------------------------------------------
Feedback is welcome.
Put to Call Ratio CorrelationHello!
Excited to share this with the community!
This is actually a very simple indicator but actually usurpingly helpful, especially for those who trade indices such as SPX, IWM, QQQ, etc.
Before I get into the indicator itself, let me explain to you its development.
I have been interested in the use of option data to detect sentiment and potential reversals in the market. However, I found option data on its own is full of noise. Its very difficult if not impossible for a trader to make their own subjective assessment about how option data is reflecting market sentiment.
Generally speaking, put to call ratios generally range between 0.8 to 1.1 on average. Unless there is a dramatic pump in calls or puts causing an aggressive spike up to over this range, or fall below this range, its really difficult to make the subjective assessment about what is happening.
So what I thought about trying to do was, instead of looking directly at put to call ratio, why not see what happens when you perform a correlation analysis of the PTC ratio to the underlying stock.
So I tried this in pinescript, pulling for Tradingview's ticker PCC (Total Equity Put to Call Ratio) and using the ta.correlation function against whichever ticker I was looking at.
I played around with this idea a bit, pulled the data into excel and from this I found something interesting. When there is a very significant negative or positive correlation between PTC ratio and price movement, we see a reversal impending. In fact, a significant negative or positive correlation (defined as a R value of 0.8 or higher or -0.8 or lower) corresponded to a stock reversal about 92% of the time when data was pulled on a 5 minute timeframe on SPY.
But wait, what is a correlation?
If you are not already familiar, a correlation is simply a statistical relationship. It is defined with a Pearson R correlation value which ranges from 0 (no correlation) to 1 (significant positive correlation) and 0 to -1 (significant negative correlation).
So what does positive vs negative mean?
A significant positive correlation means the correlation is moving the same as the underlying. In the case of this indicator, if there is a significant positive correlation could mean the stock price is climbing at the same time as the PTC ratio.
Inversely, it could mean the stock price is falling as well as the PTC ratio.
A significant negative correlation means the correlation is moving in the opposite direction. So in this case, if the stock price is climbing and the PTC ratio is falling proportionately, we would see a significant negative correlation.
So how does this work in real life?
To answer this, let's get into the actual indicator!
In the image above, you will see the arrow pointing to an area of significant POSITIVE correlation.
The indicator will paint the bars on the actual chart purple (customizable of course) to signify this is an area of significant correlation.
So, in the above example this means that the PTC ratio is increase proportionately to the increase in the stock price in the SAME direction (Puts are going up proportionately to the stock price). Thus, we can make the assumption that the underlying sentiment is overwhelmingly BEARISH. Why? Because option trading activity is significantly proportionate to stock movement, meaning that there is consensus among the options being traded and the movement of the market itself.
And in the above example we will see, the stock does indeed end up selling:
In this case, IWM fell roughly 1 point from where there was bearish consensus in the market.
Let's use this same trading day and same example to show the inverse:
You will see a little bit later, a significant NEGATIVE correlation developed.
In this case identified, the stock wise RISING and the PTC ratio was FALLING.
This means that Puts were not being bought up as much as calls and the sentiment had shifted to bullish .
And from that point, IWM ended up going up an additional 0.75 points from where there was a significant INVERSE correlation.
So you can see that it is helpful for identifying reversals. But what is also can be used for is identifying areas of LOW conviction. Meaning, areas where there really is no relationship between option activity and stock movement. Let's take spy on the 1 hour timeframe for this example:
You can see in the above example there really is no consensus in the option trading activity with the overarching sentiment. The price action is choppy and so too is option trading activity. Option traders are not pushing too far in one direction or the other. We can also see the lack of conviction in the option trading activity by looking at the correlation SMA (the white line).
When a ticker is experiencing volatile and good movement up and down, the SMA will generally trade to the top of the correlation range (roughly + 1.0) and then make a move down to the bottom (roughly - 1.0), see the example below:
When the SMA is not moving much and accumulating around the centerline, it generally means a lot of indecision.
Additional Indicator Information:
As I have said, the indicator is very simple. It pulls the data from the ticker PCC and runs a correlation assessment against whichever ticker you are on.
PCC pulls averaged data from all equities within the market and is not limited to a single equity. As such, its helpful to use this with indices such as SPY, IWM and QQQ, but I have had success with using it on individual tickers such as NVDA and AMD.
The correlation length is defaulted to 14. You can modify it if you wish, but I do recommend leaving it at this as the default and the testing I have done with this have all been on the 14 correlation length.
You can chose to smooth the SMA over whichever length of period you wish as well.
When the indicator is approaching a significant negative or positive relationship, you will see the indicator flash red in the upper or lower band to signify the relationship. As well, the chart will change the bar colour to purple:
Everything else is pretty straight forward.
Let me know your questions/comments or suggestions around the indicator and its applications.
As always, no indicator is meant to provide a single, reliable strategy to your trading regimen and no indicator or group of indicators should be relied on solely. Be sure to do your own analysis and assessments of the stock prior to taking any trades.
Safe trades everyone!

Lorentzian Classification Strategy Based in the model of Machine learning: Lorentzian Classification by @jdehorty, you will be able to get into trending moves and get interesting entries in the market with this strategy. I also put some new features for better backtesting results!
Backtesting context: 2022-07-19 to 2023-04-14 of US500 1H by PEPPERSTONE. Commissions: 0.03% for each entry, 0.03% for each exit. Risk per trade: 2.5% of the total account
For this strategy, 3 indicators are used:
Machine learning: Lorentzian Classification by @jdehorty
One Ema of 200 periods for identifying the trend
Supertrend indicator as a filter for some exits
Atr stop loss from Gatherio
Trade conditions:
For longs:
Close price is above 200 Ema
Lorentzian Classification indicates a buying signal
This gives us our long signal. Stop loss will be determined by atr stop loss (white point), break even(blue point) by a risk/reward ratio of 1:1 and take profit of 3:1 where half position will be closed. This will be showed as buy.
The other half will be closed when the model indicates a selling signal or Supertrend indicator gives a bearish signal. This will be showed as cl buy.
For shorts:
Close price is under 200 Ema
Lorentzian Classification indicates a selling signal
This gives us our short signal. Stop loss will be determined by atr stop loss (white point), break even(blue point) by a risk/reward ratio of 1:1 and take profit of 3:1 where half position will be closed. This will be showed as sell.
The other half will be closed when the model indicates a buying signal or Supertrend indicator gives a bullish signal. This will be showed as cl sell.
Risk management
To calculate the amount of the position you will use just a small percent of your initial capital for the strategy and you will use the atr stop loss or last swing for this.
Example: You have 1000 usd and you just want to risk 2,5% of your account, there is a buy signal at price of 4,000 usd. The stop loss price from atr stop loss or last swing is 3,900. You calculate the distance in percent between 4,000 and 3,900. In this case, that distance would be of 2.50%. Then, you calculate your position by this way: (initial or current capital * risk per trade of your account) / (stop loss distance).
Using these values on the formula: (1000*2,5%)/(2,5%) = 1000usd. It means, you have to use 1000 usd for risking 2.5% of your account.
We will use this risk management for applying compound interest.
> In settings, with position amount calculator, you can enter the amount in usd of your account and the amount in percentage for risking per trade of the account. You will see this value in green color in the upper left corner that shows the amount in usd to use for risking the specific percentage of your account.
> You can also choose a fixed amount, so you will have to activate fixed amount in risk management for trades and set the fixed amount for backtesting.
Script functions
Inside of settings, you will find some utilities for display atr stop loss, break evens, positions, signals, indicators, a table of some stats from backtesting, etc.
You will find the settings for risk management at the end of the script if you want to change something or trying new values for other assets for backtesting.
If you want to change the initial capital for backtest the strategy, go to properties, and also enter the commisions of your exchange and slippage for more realistic results.
In risk managment you can find an option called "Use leverage ?", activate this if you want to backtest using leverage, which means that in case of not having enough money for risking the % determined by you of your account using your initial capital, you will use leverage for using the enough amount for risking that % of your acount in a buy position. Otherwise, the amount will be limited by your initial/current capital
I also added a function for backtesting if you had added or withdrawn money frequently:
Adding money: You can choose how often you want to add money (Monthly, yearly, daily or weekly). Then a fixed amount of money and activate or deactivate this function
Withdraw money: You can choose if you want to withdraw a fixed amount or a percentage of earnings. Then you can choose a fixed amount of money, the period of time and activate or deactivate this function. Also, the percentage of earnings if you choosed this option.
Some other assets where strategy has worked
BTCUSD 4H, 1D
ETHUSD 4H, 1D
BNBUSD 4H
SPX 1D
BANKNIFTY 4H, 15 min
Some things to consider
USE UNDER YOUR OWN RISK. PAST RESULTS DO NOT REPRESENT THE FUTURE.
DEPENDING OF % ACCOUNT RISK PER TRADE, YOU COULD REQUIRE LEVERAGE FOR OPEN SOME POSITIONS, SO PLEASE, BE CAREFULL AND USE CORRECTLY THE RISK MANAGEMENT
Do not forget to change commissions and other parameters related with back testing results!. If you have problems loading the script reduce max bars back number in general settings
Strategies for trending markets use to have more looses than wins and it takes a long time to get profits, so do not forget to be patient and consistent !
Please, visit the post from @jdehorty called Machine Learning: Lorentzian Classification for a better understanding of his script!
Any support and boosts will be well received. If you have any question, do not doubt to ask!

Market Relative Candle Ratio ComparatorIntroducing the Market Relative Candle Ratio Comparator, a visually captivating script that eases the way you compare two financial assets, such as cryptocurrencies and market indices. Leveraging a distinctive calculation method based on percentage changes and their averages, this tool presents a crystal-clear view of how your chosen assets perform in relation to each other, both for individual candles and over a range of previous candles.
Tailoring the script to your preferences is a walk in the park, as it allows you to easily adjust input symbols, moving average lengths, and other parameters to match your analytical approach. The visually arresting column chart it creates employs vivid red and green colors to underscore the differences between the two assets on each candle. Simultaneously, the lower-opacity columns depict the accumulated differences over a specified lookback period. This vibrant blend of colors and opacities results in a dynamic visual experience, enabling you to better grasp market trends relative to each other.
The reverse bool input is a handy feature that lets you invert the effect of the input symbol (DXY by default) in the comparison. When you set the reverse input to true, the script multiplies the calculated DXY percentage change by -1, effectively reversing the comparison. This is particularly useful when examining assets with an inverse relationship or when you'd like to analyze the input symbol's impact in the opposite direction.
For instance, if the input symbol represents a market index that generally moves in the opposite direction of the selected cryptocurrency, enabling the reverse input will help you better visualize and understand the relationship between the two assets by inverting the input symbol's effect on the comparison.
In the accompanying chart, you can observe the comparison of Bitcoin's movement relative to the Dollar, Gold, Bonds, and the S&P 500. The indicator reveals that in the last day, Bitcoin outperformed Bonds, Gold, and the Dollar but not the S&P 500!

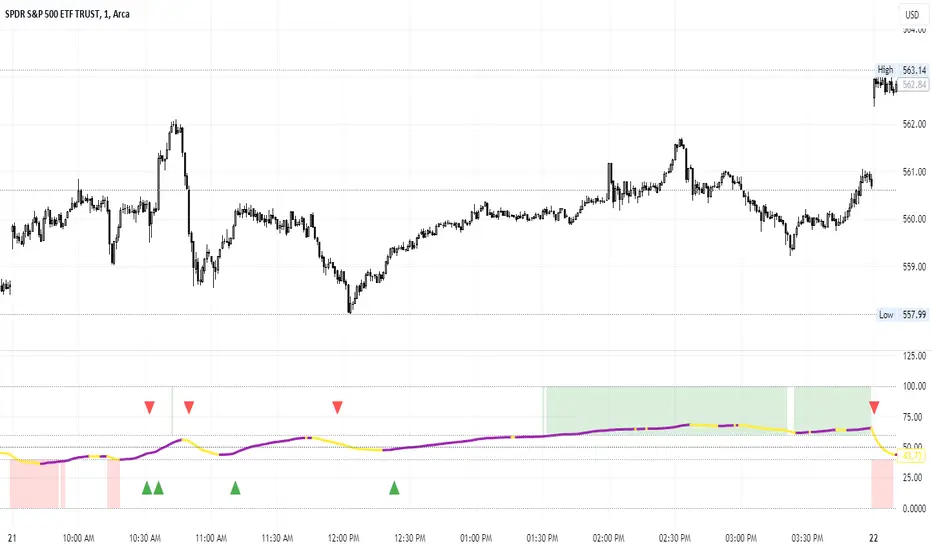
Percent of U.S. Stocks Above VWAPThis indicator plots a line reflecting the percentage of all U.S. stocks above or below their VWAP for the given candle. Horizontal lines have been placed at 40% (oversold), 50% (mid-line), and 60% (overbought). I recommend using this indicator as a market breadth indicator when trading individual stocks. In my experience, this indicator is best utilized while trading the major indices (SPX, SPY, QQQ, IWM) or their futures (ES, NQ, RTY) in the following manner:
- When the line crosses 50%, a green or red triangle is plotted indicating the majority of market momentum has turned bullish or bearish based on price positioning vs. VWAP. Look for longs when the line is rising (green) or above 50%, or shorts when the line is falling (red) or below 50%.
- When the line is below 40%, indicator shows red shading; I would not be long anything during this period. When the line exits this level, I begin looking for long entries. This line is adjustable in the indicator settings if you prefer to use a tighter or looser oversold level.
- When the line is above 60%, indicator shows green shading; I would not be short anything during this period. When the line exits this level, I begin looking for short entries. This line is adjustable in the indicator settings if you prefer to use a tighter or looser overbought level.
This indicator uses the TradingView ticker “PCTABOVEVWAP.US”, thus it only updates during NY market hours. If trading futures, I recommend applying VWAP to your chart and using that as the level to trade against in a similar manner, along with your personal price action analysis and other indicators you find useful.
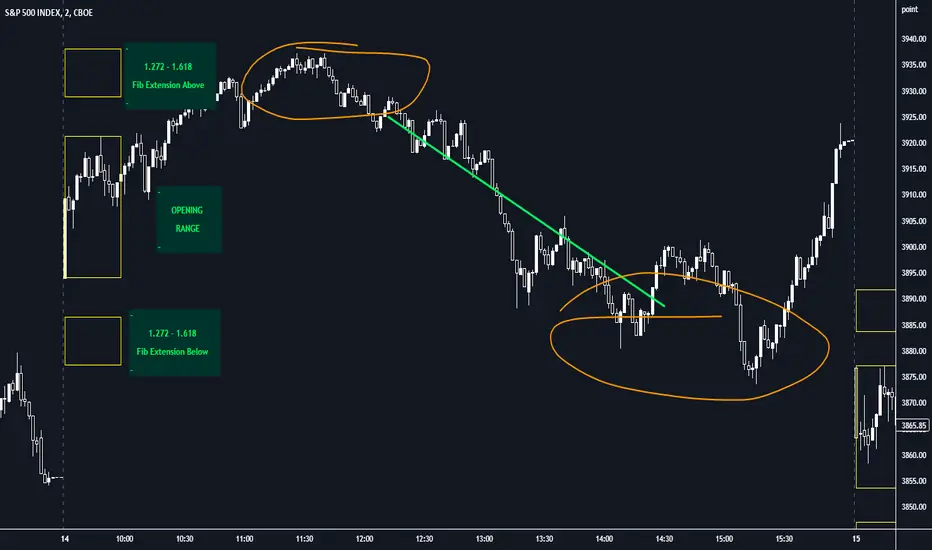
Opening Range with FibsThe indicator uses a time range and another instrument for time reference, so that it works in the time zone you care about. I have set the default to SPX500USD since it is in EST ( SPX , ES and many futures are on Chicago time and opening range gets confused). You can change the reference instrument in the settings.
You can also change the multipliers and use other values instead of 1.272 and 1.618 for Fib extensions.
TradingView has a limit as to how many objects an indicator can create so if you want to go back further for visual backtesting - use the replay tool - it will be able to draw up to the time you selected within its limits.
Let me know if you need anything else...
Happy Trading!
Pre-market Highs & Lows on regular trading hours (RTH) chartShows pre-market highs and lows on RTH or ETH chart
-Pre-market duration user input (default is 16 'bar hours'; covering the time from S&P RTH close at 4pm >> 9:30am RTH open next day
-Displays on both RTH and ETH charts
-Written for ES (ES1! or e.g ESM2023), but tested and working on SPY, SPX
-Works across timeframes
Example usage on Electronic trading hours (ETH) chart; showing the 'bar hours' user input lookback duration visually

4C Options Expected Move (Weekly + 0DTE)This indicator plots the calculated Expected Move for BOTH Weekly and Zero Dated Expiration (0DTE) Daily options, for a quick visual reference.
Please Note: This indicator is different from our original "4C Expected Move (Weekly Options)" indicator, as it now packages the ability to ALSO plot 0DTE options expected moves along with Weekly expected moves. Many other newer features have also been implemented.
Background Information
The Expected Move (EM) is the amount that a stock is predicted to increase or decrease from its current price, based on the current level of options pricing and implied volatility.
This range can be viewed as possible support and resistance, or, once price gets outside of the range, institutional hedging actions can accelerate the move in that direction.
It can be useful to know what the weekly EM range is for a stock to understand the probabilities of the overall distance, direction and volatility for the week.
About the Indicator
This indicator plots the calculated Expected Move for BOTH Weekly and Zero Dated Expiration (0DTE) options, for a quick visual reference.
For the weekly EM, the range is based on the Weekly close of the prior week.
For the Daily EM based on 0DTE options, the range is based on the Daily close of the prior day.
The indicator will automatically start a new weekly EM plot at the beginning of the week, and a new daily EM at the beginning of each day.
The EM values must be updated weekly and/or daily.
Features
Plots the EM for the week
Plots the EM for the day, for symbols that offer daily expiration options
Plots the 2 Standard Deviation EM for both the weekly and daily EM
Labels with calculated values are plotted near the levels for quick visual aid
Settings
Can toggle weekly EM on/off
Can toggle Daily EM on/off
Can toggle 2 Standard Deviation lines on/off
Can toggle labels for all EM on/off
Robust line settings
Can adjust label location left/right based on personal preference
Can enter symbol into settings as a reference
Handy instructions in the settings
How To Set Up The Indicator
To use this indicator you must have access to a broker with options data (not available on Tradingview).
Usually, you can look at the stock's option chain to find the weekly expected move.
You will have to do your own research to find where this information is displayed depending on your broker. You may also need to find the information elsewhere if your broker does not have this information.
You can also do your calculation of the EM using the following formula (please do your own research):
Expected Move = Option Price x Implied Volatility x Square Root of Time
See screenshot example below
This is the Thinkorswim platform's option chain, and the Implied Volatility % and the calculated EM are on the right side of the option chain.
The Expected Move is circled in blue. Use the +- number in parentheses, NOT the % value.
For the weekly EM, input the number that corresponds to the weekly option into the indicator. This must be done on a weekly basis, and It is typically best to use the EM for the next week expiration that is generated AFTER the Friday close and/or before the Monday open of the upcoming week.
For the daily EM, input the number that corresponds to the daily 0DTE option into the indicator. This must be done on a daily basis, and it is typically best to use the EM value for the 0DTE option that is generated the night before (after market close), or before the market opens for that 0DTE. .
