GOLD QUANTUM MASTER🥇 GOLD QUANTUM MASTER 🥇
━━━━━━━━━━━━━━━━━━━━━━━━━━━━━━━━━━━━━━━━━━━━━━━━━━━━━━━━━━━━━━━━━
A high-performance technical analysis suite engineered for institutional-grade precision on Gold (XAUUSD) and Bitcoin (BTCUSD). This Core Edition focuses on raw analytical power without external API overhead.
🚀 KEY FEATURES:
• INSTITUTIONAL FOOTPRINT: Advanced volume-to-MA filters to identify "Big Money" participation.
• HTF REVERSAL SCANNER: Specialized logic for 30m, 1H, and 4H charts to detect Pinbar and Engulfing reversals.
• LIQUIDITY FLOW ANALYTICS: Detects and highlights Previous Day High (PDH) and Low (PDL) sweeps.
• TREND EXHAUSTION FILTERS: Built-in RSI divergence logic to prevent entries at trend peaks or bottoms.
• PREMIUM DATA LABELS: Real-time on-chart display of Signal Mode, Quality Score, and dynamic targets.
• NEON VISUAL SYSTEM: High-contrast, glassmorphic layout for maximum clarity during trading sessions.
BEST FOR: Technical Analysts, Manual Traders, and High-Performance Charting.
━━━━━━━━━━━━━━━━━━━━━━━━━━━━━━━━━━━━━━━━━━━━━━━━━━━━━━━━━━━━━━━━━
The best work on Higher time frames, I still not tested on lower time frames, but should be also precise.
Feel free to adjust the settings to your own needs.
Make your own decisions when you trade, do not put all confidence into a script, it may fail also.
Tìm kiếm tập lệnh với "sweep"

IDWM Master StructureExecutive Summary
The IDWM Master Structure is a Multi-Timeframe (MTF) trading tool designed to force discipline by aligning traders with the "Parent" trend. It functions by locking onto the "Completed Auction" of a higher timeframe candle (like a Daily or Weekly bar) and projecting that structure onto your lower timeframe chart. Its primary goal is to define the "Dealing Range"—the hard boundaries where value was previously established—so you don't get lost in the noise of smaller price movements.
1. The Principle of Completed Auctions (Hierarchy)
Most technical indicators curve dynamically with every price tick. This script acts differently because it relies on "Settled Arguments." A closed Daily candle represents a finished battle between buyers and sellers; the High and Low are the historical results of that battle.
To enforce this, the script automatically selects a "Parent" timeframe based on your view:
Scalping (charts below 15 minutes) uses the 4-Hour Auction.
Intraday trading (15 minutes to 4 Hours) uses the Daily Auction.
Swing trading (Daily chart) uses the Weekly Auction.
2. Liquidity Pools & The Sticky Range
The High and Low lines drawn by the indicator are not just support and resistance; they represent Liquidity Pools. In market theory, stop-losses (Sell Stops below Lows, Buy Stops above Highs) accumulate at these edges.
Smart money often pushes price just past these lines to grab this liquidity (a "Stop Hunt") before reversing direction. To account for this, the script uses a "Sticky Range" mechanism. It refuses to redraw the box simply because price touched the line. Instead, it uses an Average True Range (ATR) Buffer. A new structure is only formed if the candle closes decisively outside the range plus this volatility buffer. This ensures you are trading real breakouts, not liquidity sweeps.
3. Internal Range Mechanics (Premium vs. Discount)
Inside the Master Box, the script applies Equilibrium Theory to help with trade location.
The most important internal line is the Equilibrium (EQ), which marks the exact 50% point of the range.
Premium Zone (Above EQ): Price is mathematically "expensive" relative to the recent range. Algorithms generally look to establish Short positions here.
Discount Zone (Below EQ): Price is considered "cheap." Algorithms generally look to establish Long positions here.
It also plots the Master Open, which acts as a "Line in the Sand." If price is currently trading above the Master Open, the higher timeframe candle is Green (Bullish), suggesting longs have a higher probability. If below, the candle is Red (Bearish).
4. Wick Theory (Failed Auctions)
The script places special emphasis on the wicks of the Master Candle because a wick represents a "Failed Auction"—a price level the market tried to explore but ultimately rejected.
The indicator highlights the background of the wick area (from the High to the Body). On a retest, these zones often act as supply or demand blocks because the market remembers the previous failure.
It also calculates the "Consequent Encroachment," which is the 50% midpoint of the wick. The rule of thumb here is that if a candle body can close past 50% of a wick, the rejection is nullified, and price will likely travel to fill the entire wick.
5. Energy Expansion (Breakout Targets)
Market energy transfers from Consolidation (inside the box) to Expansion (the breakout). When the price finally breaks the "Sticky Range" (confirming via the ATR buffer), the script projects where that energy will go.
It uses the height of the previous range to calculate Fibonacci extensions. Specifically, it targets the 1.618 Extension, often called the "Golden Ratio." This is a statistically significant level where expansion moves tend to exhaust themselves and reverse.
6. Safety Protocol: Live Detection
A dashboard monitors the state of the parent candle. If the text turns Magenta with a warning symbol, it means the Higher Timeframe candle is "Live" (still forming).
Trading off a live structure is considered higher risk because the "Auction" isn't finished—the High or Low can still shift. The safest approach is to trade when the dashboard indicates a standard, locked, historical structure.

SuperTrend Oscillator [ChartPrime]⯁ OVERVIEW
The SuperTrend Oscillator is a hybrid momentum–trend indicator that transforms the classic SuperTrend into a full-strength oscillator.
Instead of simply plotting SuperTrend direction on the chart, this tool measures the distance between price and SuperTrend, normalizes it by volatility, and converts it into a dynamic oscillator that highlights trend strength, momentum extremes, and high-precision reversal points.
⯁ CONCEPTS
SuperTrend Engine: The indicator extracts the SuperTrend baseline and direction using ATR-based volatility. This acts as the core structure from which the oscillator is built.
Volatility-Adjusted Oscillation: (close − SuperTrend) is divided by ATR to standardize momentum across all markets and timeframes.
Adaptive Oscillator Types: The signal can be transformed using HMA, EMA, or SMA smoothing for varying responsiveness.
Momentum Extremes: Values above +1.7 or below −1.7 signal stretched price conditions where reversals are more likely.
Reversal Logic: The oscillator compares its current value with its value three bars ago. Large positive or negative pivots indicate momentum shifts.
⯁ FEATURES
Trend-Colored SuperTrend Line
The SuperTrend line shifts color based on direction, giving immediate context for oscillator readings.
Full Oscillator Transformation
Converts price–SuperTrend distance into a normalized oscillator, showing when momentum is expanding, contracting, or reaching exhaustion.
Gradient Momentum Coloring
The oscillator line and candles are colored using a two-sided gradient:
• Red tones for bearish momentum
• Orange/cream tones for bullish momentum
• Gray tones for low momentum
This makes strength visually intuitive.
Extreme Zones (±1.7 Bands)
Built-in upper and lower thresholds highlight zones where price is statistically overextended.
Dual Fill Layers
The area above/below zero is filled in different colors to emphasize bullish or bearish oscillator regime.
Reversal Diamonds
The script highlights significant reversals when:
• Momentum shifts downward from high values (bearish pivot)
• Momentum shifts upward from deep lows (bullish pivot)
These diamonds help pinpoint exhaustion-based turning points.
⯁ HOW TO USE
Identify Trend Strength:
A rising oscillator above 0 confirms bullish SuperTrend conditions; falling below 0 confirms bearish ones.
Spot Momentum Extremes:
Readings above +1.7 or below −1.7 often signal overextended price moves.
Use Reversal Diamonds as Pivot Alerts:
Diamond markers indicate high-probability turning points when momentum sharply reverses from extreme zones.
Confirm Trend Shifts with Color Changes:
Candle and oscillator colors shift based on momentum direction, providing clean visual alignment with SuperTrend direction.
Combine with Structure or OB Zones:
Reversal signals become more reliable when they occur at key S/R, order blocks, or liquidity sweeps.
⯁ CONCLUSION
The SuperTrend Oscillator modernizes the SuperTrend by transforming it into a volatility-aware oscillator with clear reversal markers, trend coloring, and momentum normalization.
This tool is ideal for traders who want both trend context and precise timing signals, blending SuperTrend’s reliability with the dynamics of a professional-grade momentum oscillator.

TICK Indicator with Extreme AlertsOverview:
This indicator is designed to provide intraday traders (especially those trading SPX, ES, and NQ) with a clearer NYSE TICK analysis tool featuring visual alerts. Unlike traditional TICK line charts, this indicator utilizes OHLC Candlesticks to display data, allowing you to fully view the Open, High, Low, and Close within a specific timeframe, thereby capturing instantaneous liquidity sweeps.
Core Features & Logic:
Candlestick Visualization (OHLC Candles): Uses the USI:TICK.US data source by default. The candlestick patterns allow you to clearly see if the TICK pierced key levels intraday but retraced by the close—vital information that standard line charts often miss.
Dual Key Level System: The indicator is designed with two independent reference tiers for trend observation and reversal detection:
Reference Lines (+/- 800): Marked by gray dashed lines. These represent the standard bull/bear dividing zones. When TICK sustains above +800 or below -800, it typically indicates a strong trending market.
Extreme Alerts (+/- 1000): These thresholds are used to identify extreme market sentiment (overbought/oversold conditions).
Background Highlight Alerts (Visual Alerts): To reduce screen-watching fatigue, the indicator automatically highlights the candlestick background when extreme market sentiment occurs:
Green Background: Triggered when TICK High breaks above +1000. Represents extreme buying sentiment, potentially indicating exhaustion or a short squeeze.
Red Background: Triggered when TICK Low drops below -1000. Represents extreme panic selling (Washout), often serving as a potential signal for an intraday reversal or a short-term bottom.
Custom Settings:
All thresholds (800 reference lines, 1000 alert lines) are fully adjustable in the settings.
All colors (Candles, Reference Lines, Background Alert Colors) can be customized.
Use Cases: This tool is ideal for intraday counter-trend or trend-following trading when combined with Price Action analysis and key Support & Resistance levels.

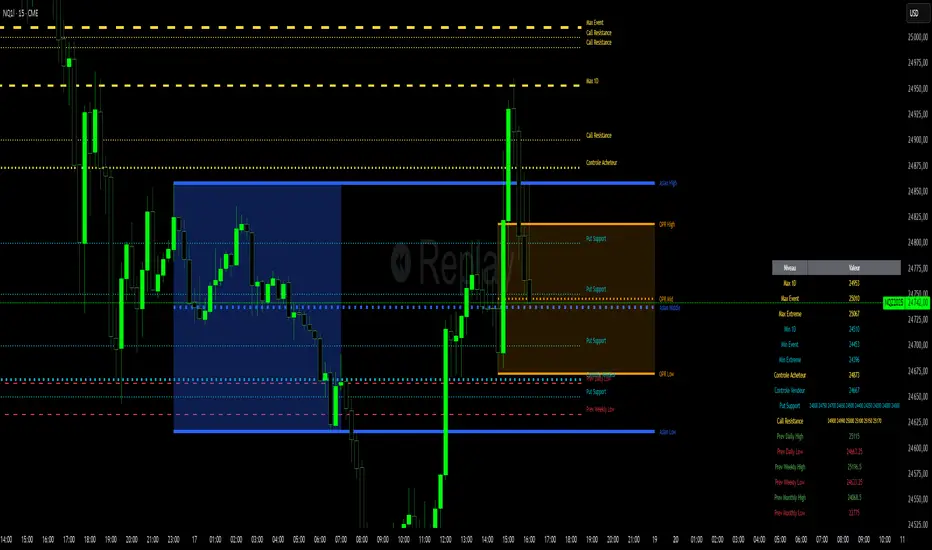
Niv Deal + Previ D W M + OPR + Asian🧭 Indicator Description (English)
Name: Niveaux Dealers + Previous D/W/M Auto + OPR + Asian Session
Platform: TradingView (Pine Script v6)
Type: Multi-module visual indicator for market structure and session ranges
🧩 Overview
This indicator combines three complementary modules to help traders visualize key market levels, opening ranges, and session dynamics — all in one comprehensive tool.
It is designed primarily for index and futures trading (e.g. NQ, ES, DAX), but can be applied to any market or timeframe.
MODULE 1 — Dealers Levels + Previous High/Low (Auto)
This first module automatically extracts and plots custom Dealer Levels and Previous Period Levels.
It can parse manually entered price levels (from a single text input) such as daily max/min, control levels, put supports, and call resistances — then draw horizontal lines and labels on the chart.
Features:
One text input for all dealer levels (easy copy-paste format).
Automatic parsing of prices from text (ignores irrelevant characters).
Groups of levels:
Maxima (Max 1D / Event / Extreme)
Minima (Min 1D / Event / Extreme)
Buyer/Seller Controls
Put Supports and Call Resistances
Independent color, style, and width for each line.
Transparent rectangular labels positioned perfectly on the levels.
Previous Daily, Weekly, and Monthly High/Low levels added automatically.
Optional summary table showing all levels and values in real time.
MODULE 2 — OPR (Opening Price Range)
The second module highlights the Opening Price Range, defined by the first 15 minutes (or any chosen period) of the trading session.
Features:
Fully configurable start and end time (local chart timezone).
Displays:
High, Low, and Midline (median)
Optional rectangle between high/low
Optional labels on each line
Independent color, line style, and thickness.
Works perfectly with non-standard sessions (e.g. 13:30–22:00 UTC for U.S. futures).
Uses local chart time instead of exchange time for intuitive control.
MODULE 3 — Asian Session Range
The third module draws the Asian trading session range, automatically detecting price action between configurable hours (default 17:00 → 01:00).
Features:
Adjustable start and end time (supports overnight sessions).
Plots Asian High, Asian Low, and Asian Middle (mid-range line).
Highlights the Asian box area with semi-transparent color.
Optional labels at the end of each level.
Fully synchronized with the chart’s local timezone (same logic as OPR).
Simple toggle to enable or disable the entire Asian module.
⚙️ Customization & Display
Each module can be toggled independently.
Colors, line styles (solid, dashed, dotted), and thickness are customizable.
Label visibility and extensions (left/right) can be adjusted.
The indicator is lightweight and optimized for real-time performance.
💡 Use Case
Traders can use this multi-module setup to:
Identify dealer reaction zones and institutional levels.
Track previous highs/lows for potential liquidity sweeps.
Monitor session ranges (Opening and Asian) for volatility shifts.
Combine all three perspectives (Dealer, Session, Historical) into one unified view.
Would you like me to rewrite this description in TradingView publication form
Illuminati Zone🟣 Illuminati Zone — Hidden Power of the 11 PM NZ Candle
The Illuminati Zone reveals the hidden footprints of liquidity and market imbalance formed by the 11 PM New Zealand 15-minute candle — a time when global liquidity transitions between major sessions.
This candle often defines key intraday supply and demand boundaries, serving as a magnet for price and a pivot point for high-probability reversals or breakouts.
🧠 How it works
Automatically detects and marks the 11 PM NZ 15-minute candle each day.
Draws a translucent zone box between its high and low.
Extends two reference lines at +1 × range and –1 × range above and below the zone — ideal for spotting overextensions or liquidity sweeps.
Supports custom lookback, colors, and visual options.
💡 How to use it
Watch how price interacts with the zone — rejection often signals smart-money activity.
Use +1 and –1 levels as overextended zones for potential reversals or breakout retests.
Combine with your own confluence tools or volume analysis for precision entries.
⚙️ Customization Options
Target hour (NZ time)
Days back to display
Zone and line colors
Transparency and visual preferences
🔮 Pro Tip: Pair it with a volume or imbalance indicator for surgical-level precision in identifying where smart money positions are built or released.

Smart Money Trades Pro [BOSWaves]Smart Money Trades Pro – Advanced Market Structure & Liquidity Visualizer
Overview
Smart Money Trades Pro is a comprehensive trading tool designed for traders seeking an in-depth understanding of market structure, liquidity dynamics, and institutional flow. The indicator systematically identifies key market turning points, including break of structure (BOS) and change of character (CHoCH) events, and overlays these with adaptive visualizations to highlight high-probability trade setups. By integrating ATR-based risk zones, progressive take-profit levels, and real-time trade analytics, Smart Money Trades Pro transforms complex price action into an interpretable framework suitable for multiple trading styles, including scalping, intraday, and swing trading.
Unlike traditional static indicators, Smart Money Trades Pro adapts continuously to market conditions. It evaluates swing highs and lows over a configurable lookback period, then determines structural breaks using customizable confirmation methods (candle body or wick). The resulting signals are augmented with dynamic entry, stop-loss, and target levels, allowing traders to analyze potential trade opportunities with both precision and context. The indicator’s design ensures that each visual element—trend-colored candles, signal markers, and risk/reward boxes—reflects real-time market conditions, offering an actionable interpretation of institutional activity.
How It Works
The indicator’s foundation is built upon market structure analysis. By calculating pivot highs and lows over a specified period, Smart Money Trades Pro identifies potential points of liquidity accumulation and exhaustion. When price breaks a pivot high or low, the indicator evaluates whether this constitutes a BOS or a CHoCH, signaling trend continuation or reversal. These events are marked on the chart with distinct visual cues, allowing traders to quickly discern shifts in market sentiment without manually analyzing historical price action.
Once a structural break is confirmed, the indicator automatically determines entry levels, stop-loss placements, and progressive take-profit zones (TP1, TP2, TP3). These calculations are based on ATR-derived volatility, ensuring that targets scale with current market conditions. Risk and reward zones are plotted as shaded boxes, providing a clear visual representation of potential profit relative to risk for each trade setup. This system allows traders to maintain discipline and consistency, with dynamic trade management baked directly into the visualization.
Trend direction is further reinforced by color-coded candles, which reflect the prevailing market bias. Bullish trends are represented by one color, bearish trends by another, and neutral conditions are displayed in muted tones. This continuous visual feedback simplifies the process of trend assessment and helps confirm the validity of trade setups alongside BOS and CHoCH markers.
Signals and Breakouts
Smart Money Trades Pro includes structured visual signals to indicate actionable price movements:
Bullish Break Signals – Triangular markers below the candle appear when a swing high is broken, suggesting potential long opportunities.
Bearish Break Signals – Triangular markers above the candle appear when a swing low is broken, indicating potential short setups.
Change of Character (CHoCH) – Special markers highlight trend reversals, showing where momentum shifts from bullish to bearish or vice versa.
These markers are strategically spaced to prevent overlap and remain clear during high-volatility periods. Traders can use them in combination with trend-colored candles, risk/reward zones, and ATR-based targets to assess the strength and reliability of each setup. The integrated table provides live trade information, including entry price, stop-loss level, take-profit levels, risk/reward ratio, and trade direction, ensuring that trade decisions are informed and data-driven.
Interpretation
Trend Analysis : The indicator’s trend coloring, combined with BOS and CHoCH detection, provides an immediate view of market direction. Rising structures indicate bullish momentum, while falling structures signal bearish momentum. CHoCH markers highlight potential trend reversals or significant liquidity sweeps.
Volatility and Risk Assessment : ATR-based calculations determine stop-loss distances and target levels, giving a quantitative measure of risk relative to market volatility. Wide ATR readings indicate periods of high price fluctuation, whereas narrow readings suggest consolidation and reduced risk exposure.
Market Structure Insights : By monitoring swing highs and lows alongside break confirmations, traders can identify where institutional players are likely active. Areas with multiple structural breaks or overlapping targets can indicate liquidity hotspots, potential reversal zones, or areas of market congestion.
Trade Management : The built-in trade zones allow traders to visualize entry, risk, and reward simultaneously. Progressive targets (TP1, TP2, TP3) reflect incremental profit-taking strategies, while dynamic stop-loss levels help preserve capital during adverse moves.
Strategy Integration
Smart Money Trades Pro supports a range of trading approaches:
Trend Following : Enter trades in the direction of confirmed BOS while using CHoCH markers and trend-colored candles to validate momentum.
Pullback Entries : Use failed breakout retests or minor reversals toward broken structure levels for lower-risk entries.
Mean Reversion : In consolidated zones with narrow ATR and repeated BOS/CHoCH activity, anticipate reversals or short-term corrective moves.
Multi-Timeframe Confirmation : Overlay signals on higher or lower timeframes to filter noise and improve trade accuracy.
Stop-loss levels should be placed just beyond the opposing structural point, while take-profit targets can be scaled using the ATR-based zones. Progressive targets allow for partial exits or scaling out of trades while maintaining exposure to larger moves.
Advanced Techniques
Traders seeking greater precision can combine Smart Money Trades Pro with volume, momentum, or volatility indicators to validate signals. Observing sequences of BOS and CHoCH markers across multiple timeframes provides insight into liquidity accumulation and depletion trends. Tracking the expansion or contraction of ATR-based zones helps anticipate shifts in volatility, enabling better timing for entries and exits.
Customizing the structure period and confirmation type allows the indicator to adapt to different asset classes and timeframes. Shorter periods increase sensitivity to smaller swings, while longer periods filter noise and emphasize higher-probability structural breaks. By integrating these features, the indicator offers a robust statistical framework for disciplined, data-driven trading decisions.
Inputs and Customization
Structure Detection Period : Defines the lookback window for pivot high and low calculation.
Break Confirmation : Choose whether to confirm breaks using candle body or wick.
Display CHoCH : Toggle visibility of change-of-character markers.
Color Trend Bars : Enable color-coding of candles based on market structure direction.
Show Info Table : Display trade dashboard showing entry, stop-loss, take-profits, risk/reward, and bias.
Table Position : Choose from top-left, top-right, bottom-left, or bottom-right placement.
Color Customization : Configure bullish, bearish, neutral, risk, reward, and text colors for enhanced visual clarity.
Why Use Smart Money Trades Pro
Smart Money Trades Pro transforms complex market behavior into an actionable visual framework. By combining market structure analysis, liquidity tracking, ATR-based risk/reward mapping, and a dynamic trade dashboard, it provides a multidimensional view of the market. Traders can focus on execution, interpret trends, and evaluate overextensions or reversals without relying on guesswork. The indicator is suitable for scalping, intraday, and swing strategies, offering a comprehensive system for understanding and trading alongside institutional participants.

Institutional Sessions Overlay (Asia/London/NY)Institutional Sessions Overlay is a professional TradingView indicator that visually highlights the main trading sessions (Asia, London, and New York) directly on your chart.
Customizable: Easily adjust session start and end times (including minutes) for each market.
Timezone Alignment: Shift session boxes using the timezone offset parameter so sessions match your chart’s timezone exactly.
Clear Visuals: Colored boxes and optional labels display session opens and closes for fast institutional market structure reference.
Toggle Labels: Show or hide session open/close labels with a single click for a clean or detailed look.
Intuitive UI: User-friendly grouped settings for efficient configuration.
This tool is designed for day traders, institutional traders, and anyone who wants to instantly recognize global session timing and ranges for SMC, ICT, and other session-based strategies.
How to use:
Set your chart to your local timezone.
Use the "Session timezone offset" setting if session boxes do not match actual session opens on your chart.
Adjust the hours and minutes for each session as needed.
Enable or disable labels in the “Display” settings group.
Tip: Use the overlay to spot session highs and lows, volatility windows, and institutional liquidity sweeps.

SMC ICT – Simplified Daily Trend & Reversal AnalyzerThis Pine Script provides a simplified approach to analyzing daily trends and potential reversals using concepts inspired by Smart Money Concepts (SMC) and ICT (Inner Circle Trader).
What It Does:
• Detects daily uptrend and downtrend conditions by comparing the current daily high/low to the previous day’s values.
• Highlights potential bullish or bearish reversal zones when price behavior suggests a shift in sentiment.
• Automatically draws dashed lines for the previous day's high and low.
• Labels these high/low levels for quick visual reference.
How to Use:
Apply this indicator to any timeframe chart. Use the plotted trend markers to assess daily direction and potential reversal signals. The dashed lines (previous high/low) can be used as reference points for liquidity zones or break/retest entries.
User Interface:
The indicator displays labels and shapes in English. This script is intended for educational and trading workflow enhancement purposes.
Note:
This is an open-source tool designed for clarity and basic SMC/ICT application. It is best used in combination with other confluences like FVGs, order blocks, and liquidity sweeps.

Silver Bullet 5 minutes Box - By KaVeHThis indicator plots high-low range boxes based on selected intraday time windows on the 5-minute chart. It's inspired by the "Silver Bullet" trading concept, highlighting key liquidity grabs and volatility pockets at predefined times. It helps traders visually identify potential smart money trading windows during the New York session and other time anchors.
⚠️ This script only works on the 5-minute chart.
📦 Main Features:
⏰ Customizable Time Boxes:
Define up to 4 separate time windows per day:
3:00 AM – 3:05 AM (New York time) (Box 1)
10:00 AM – 10:05 AM (New York time) (Box 2)
2:00 PM – 2:05 PM (New York time) (Box 3)
8:00 PM – 8:05 PM (New York time) (Box 4)
🎨 Color and Visibility Control:
Each box can be independently toggled and colored for visual distinction.
🕔 New York Time Based:
All timestamps are automatically adjusted to New York Time, aligning with institutional market behavior.
📉 Post-Box Projection:
After each time window closes, a box extends forward 6 hours (72 bars on a 5-minute chart) to highlight the range.
💡 Use Case:
These boxes are best used to:
Detect liquidity sweeps.
Mark potential entry or exit zones.
Track price behavior after specific time-based events.
For example, the 10 AM box is often used to identify setups just after the NYSE open and into the first hour of volatility.
⚠️ TradingView Compliance Notes:
This script is original and does not replicate or resell premium/paid indicators.
All logic is coded from scratch by kaveh_mirmousavi, using public concepts from ICT/Smart Money Trading.
Fully complies with the Mozilla Public License 2.0.
Does not include financial advice or signals — for educational use only.
✅ How to Use:
Apply to a 5-minute chart.
Adjust the desired time boxes in the input panel.
Watch for price action within and after the boxes.
Enjoy and feel free to share feedback or ideas for improvement!

Volumetric Tensegrity🧮 Volumetric Tensegrity unifies two of the Leading Indicator suite's critical engines — ZVOL ( volume anomaly detection ) and OBVX ( directional conviction ). Originally designed as a structural economizer for traders navigating strict indicator limits (e.g. < 10 slots per chart), it was forced to evolve beyond that constraint simply to fulfill it, albeit with a difference. The fatal flaw of traditional fusion, where two metrics are blended mathematically, is that they lose scale integrity (i.e. meaning). VTense encodes optical tensegrity to scale the amplitude of the ZVOL histogram and the slope of the OBVX spread independently, so that expansion and direction may coexist without either dominating the frame.
🧬 Tensegrity , by definition, is an intelligent design principle where elements in compression are suspended within a network of continuous tension, forming a stable, self-supporting structure . Originally conceived in esoteric biomorphology (c.f. Da Vinci, Snelson, Casteneda), tensegrity balances force through opposition, not rigidity. Applied to financial markets, Volumetric Tensegrity captures this same principle: price compresses, volume expands, conviction builds or fades — yet structure holds through the interplay. The result is not a prediction engine, but a pressure field — one that visualizes where structure might bend, break, or rebound based on how volume breathes.
🗜️ Rather than layering multiple indicators and consuming precious chart space, VTense frees up room for complementary overlays like momentum mapping, liquidity tiers, or volatility phase detection — making it ideal for modular traders operating in tight technical real estate.
🧠 Core Logic - VTense separates and preserves two essential structural forces:
• ZVOL Histogram : A Z-score-based expansion map that measures current volume deviation from its historical average. It reveals buildup zones, dormant stretches, and breakout pressure — regardless of price behavior.
• OBVX Spread : A directional conviction curve that tracks the difference between On-Balance Volume and its volume-weighted fast trend. It shows whether the crowd is leaning in (accumulation/distribution) or backing off.
🔊 ZVOL controls the amplitude of the histogram, while OBVX controls the curvature and slope of the spread. Without sacrificing breathing behavior or analytical depth, VTense provides a compact yet dynamic lens to track both expansion pressure and directional bias within a single footprint.
🌊 Volumetric Tensegrity forecasts breakout readiness, trend fatigue, and compression zones by measuring the volatility within volume . Unlike traditional tools that track volatility of price, this indicator reveals when effort becomes unstable — signaling inflection points before price reacts. Designed to decode rhythm shifts at the volume level, it operates as a pre-ignition scanner that thrives on low-timeframe charts (15m and under) while scaling effectively to 1H for validation.
🪖 From Generals to Scouts
👀 When used jointly, ZVOL + OBVX act as the general : deep-field analysts confirming stress, commitment, or exhaustion. VTense , by contrast, functions as a scout — capturing subtle buildup and alignment before structure fully reveals itself. The indicator aims to be a literal vanguard, establishing a position that can be confirmed or flexibly abandoned when the higher authority arrives to evaluate.
🥂 Use the ZVOL + OBVX pair when :
• You need independent axis control and manual dissection
• You’re building long-form confluence setups
• You have more indicator slots than you need
🔎 Use VTense when :
• You need compact clarity across multiple instruments
• You’re prioritizing confluence _detection_ over granular separation
• You’re building efficient multi-layered systems under slot constraints
🏗️ Structural Behavior and Interpretation
🫁 Z VOL Respiration Histogram : Structural Effort vs Baseline
🔵 Compression Coil – volume volatility is low and stable; the market is coiling
🟢 Steady Rhythm – volume is healthy but unremarkable; balanced participation
🟡 Passive/Absorbed Effort – expansion failing to manifest; watch for reversal
🟠 Clean Expansion – actionable volatility rise backed by structure
🔴 Volatile Blowout – chaos, climax; likely end-phase or fakeout
⚖️ ZVOL Respiration measures how hard the crowd is pressing — not just that volume is rising, but how statistically abnormal the surge is. Because it is rescaled proportionally to OBVX, the amplitude of the histogram reflects structural urgency without overwhelming the visual field.
🖐️ OBVX Spread : Real-Time Directional Conviction Behind Price Moves
🔑 The curvature of the spread reveals not just directional bias but crowd temp o: sharp slopes = urgent transitions; gradual slopes = building structural shifts. Curvature is key: sharp OBVX slope = urgency; gentle arcs = controlled drift or indecision.
• Green Rising : Accumulation — upward pressure from real buyers
• Red Falling : Distribution — sell pressure, downward slope
• Flat Curves : Transitional → uncertainty, microstructure digestion
🎭 Synchronized vs Divergent Behavior
⏱️ Synchronized (high-confluence) : often precedes structural breakouts, with internal conviction clearly visible before price resolves.
• ZVOL expands (yellow/orange/red) and OBVX climbs steeply green = strong bullish pressure
• ZVOL expands while OBVX steepens red = growing sell-side intent
🪤 Divergent (conflict tension) : flags potential traps, fakeouts, and liquidity sweeps.
• ZVOL expands sharply, but OBVX flattens or opposes → reactive expansion without crowd commitment
⛔️ Latent Drift + Structural Holding Patterns : tensegrity in action — the market holds tension without directional release.
• ZVOL compresses (blue) + OBVX meanders near zero → structure is resting, building up energy
• After prolonged drift, expect violent asymmetry when balance finally breaks
📚 Phase Interpretation: Dynamic Structural Read
• 1️⃣ Quiet Coil : Histogram flat, OBVX flat → no urgency
• 2️⃣ Initial Pulse : Yellow bars, OBVX slope builds → actionable tension
• 3️⃣ Structural Breath : Synchronized expansion and slope → directional commitment
• 4️⃣ Disagreement : Spike in ZVOL, flattening OBVX → exhaustion risk or false signal
💡 Suggested Use
• Run on 15m charts for breakout anticipation and 1H for validation
• Pair with ZVOL + OBVX to confirm crowd conviction behind the tension phase
• Use as a rhythm filter for the suite's trend indicators (e.g., RDI , SUPeR TReND 2.718 , et. al.)
• Ideal during low-volume regimes to detect pressure buildup before triggers
🧏🏻 Volumetric Tensegrity doesn’t signal. It breathes , and listens to pressure shifts before they speak in price. As a scout, it lets you see structural posture before signals align — helping you front-run resolution with clarity, not prediction.

Pivot Levels with EMA Trend📌 Trend Change Levels with EMA Trend
✨ Description:
This TradingView script identifies clean trend change levels based on 1-hour structure shifts and filters them to keep only those not invalidated. It follows the "Jake Ricci" method, each level is printed at the beginning of the candle that changes the trend, on a 1 hour chart. For precision, make sure to exclude after/pre market and only use the levels on regular hours charts.
It includes dynamic EMAs (9, 50, 200), intraday VWAP, the daily open level printed, and a visual trend label based on EMA(9) slope.
Designed for intermediate traders, it helps build bias, manage entries, and avoid false setups by focusing on clean, reactive levels that the market respects.
🔧 Core Logic:
On the 1H chart, the script compares current and previous closes to detect trend direction. If the trend flips (e.g., up to down), the open of the candle that caused the flip becomes a candidate level.
Only levels that remain untouched by future candle closes are plotted — this filters out “weak” levels that price already violated (which means, a candle closes after passing through the level).
These levels become key S/R zones and often act as reaction points during pullbacks, traps, and liquidity sweeps.
The idea is to check how the price reacts to those levels. Usually there's a clean retest of the level. After that, if the price continues in that direction, it tends to reach the following level.
🔹 Included Tools:
🟣 Trend Change Levels (1H):
Fixed horizontal lines based on confirmed shifts in trend, shown only when not broken.
📉 EMAs (9 / 50 / 200):
Visibility can be set per timeframe. Use for trend context.
📍 EMA Trend Label:
Shows \"UP\", \"DOWN\", or \"RANGE\" based on EMA(9) slope.
🔵 VWAP (Intraday Reset):
Real-time volume-weighted average price that resets daily. Useful for fair value zones and reversion plays.
🟠 Daily Open Line:
Plot of the current day’s open. Used for intraday directional bias. Usually: DO NOT take longs below the Open Print, DO NOT take shorts above it.
📊 ATR Table:
Displays current ATR multiplier on the chart. It's useful to understand if the market is expanding or not.
📈 How to Use It (Strategy):
1. Start on the 1H chart to generate levels.
Only the open of candles that reversed trend are considered — and only if future candles didn’t close through them. I suggest manually adding horizontal lines to mark again the levels, so that they stick to all the timeframes.
2. Use the trend label to decide your bias — \"UP\" for long setups, \"DOWN\" for shorts. Avoid trading against the slope.
3. Switch to the 5m chart and wait for price to approach a plotted level. These are often used for manipulation, retests, or clean reversals.
4. Look for confirmation: rejection candles, break-and-retest, strong engulfing candles, or traps above/below the level. ALWAYS check the price action around the level, along with the volume.
5. Check if VWAP or an EMA is near the level. If yes, the confluence strengthens the trade idea.
6. Use the ATR value to understand if the market is expanding (candles are bigger than the ATR). You don't want to stay in a slow and ranging trade.
✅ Example Entry Flow:
1. On the 1H chart, note a trend change level printed recently.
2. Check the current trend label — if it says \"UP,\" prefer longs.
3. Wait for price to retrace toward the level.
4. On the 5m, look for a bullish engulfing candle or trap setup at the level.
5. Check if VWAP and EMA(50) are near. If yes, execute the trade.
6. Set stop just under the low of the candle prior to your entry. Ideally, a retracing candle.
To be clear: imaging to be LONG, you wait for a retracement that should touch your level. You wait for a candle that resumes the LONG trend, enter when it breaks the high of the previous candle (sill in retracement), you place your stop under the candle prior to your entry.
Notes:
No repainting — levels only show up after confirmed shifts.
Removes broken levels for chart clarity and reliability.
Helps spot high-probability pullback zones and fakeouts.
Perfect confluence tool to support price action, SMC, or EMA strategies.
Works across multiple timeframes with customizable inputs.
👤 Ideal For:
Intraday traders looking for reactive entry points and direction confirmation.
Swing traders wanting to pinpoint continuation zones or reversal pivots.
🚨 Final Note: This indicator doesn’t generate buy/sell signals. It improves your trade filtering by identifying areas the market already respected and reacting to them with price action. Combine it with your own system , test it in replay, and use screenshots to document setups.
📌 If used with discipline, this becomes a precision tool — not a signal generator.

Electronic Trading Hours Session/CandlesThis indicator visually distinguishes the electronic trading session, spanning from the prior day's close (e.g., 5:00 PM EST) through the overnight period until the next day's opening bell (e.g., 9:30 AM EST).
It can be customized to highlight this period with a shaded zone or colored candles depending on the trader’s preference.
The overnight levels that create the opening range gap often act as critical zones of liquidity.
The indicator provides a clear visual cue of potential price magnets that smart money (institutional traders) may target during the opening bell session to trigger liquidity sweeps.

ICT Balanced Price Range - Double FVG with VolumeThis is an FVG indicator combined with volume to identify moments when a sudden volume spike creates a price gap.
Additionally, I've added the ICT Balanced Price Range, which occurs when two opposing FVGs form a connected gap. This gap has a high probability of reversal and is one of the key signs of liquidity sweeps.
Unlike other FVG indicators that filter FVGs based on ATR, average price, or range, I believe such methods lead to overfitting and may not work across multiple pairs with a single setting. Instead, I only filter FVGs when there are consecutive overlapping FVGs.
The indicator includes full functionality:
Candle color customization
FVG line color customization
FVG fill color customization
BPR color customization
Adjustable average volume and volume threshold
Highlighting candles with abnormal volume
Enjoy and make sure to backtest thoroughly before using!

Mirpapa_Lib_StructLibrary "Mirpapa_Lib_Struct"
ICT 구조 변화 감지 라이브러리 (BOS, CHoCH, MSS, Sweep)
initStructState()
StructState 초기화
checkBOS(_trend, _currentClose, _lastHHPrice, _lastLLPrice)
BOS 체크 (추세 지속) - 종가 기준
Parameters:
_trend (string) : 현재 추세
_currentClose (float) : 현재 종가
_lastHHPrice (float) : 마지막 HH 가격
_lastLLPrice (float) : 마지막 LL 가격
Returns:
checkCHoCH(_trend, _currentClose, _lastHHPrice, _lastLLPrice)
CHoCH 체크 (추세 전환) - 종가 기준
Parameters:
_trend (string) : 현재 추세
_currentClose (float) : 현재 종가
_lastHHPrice (float) : 마지막 HH 가격
_lastLLPrice (float) : 마지막 LL 가격
Returns:
checkSweep(_currentHigh, _currentLow, _currentClose, _lastHHPrice, _lastLLPrice)
Sweep 체크 (유동성 수집) 설명
Parameters:
_currentHigh (float) : 현재 고가
_currentLow (float) : 현재 저가
_currentClose (float) : 현재 종가
_lastHHPrice (float) : 마지막 HH 가격
_lastLLPrice (float) : 마지막 LL 가격
Returns:
checkMSS(_hadCHoCH, _chochDir, _currentHigh, _currentLow, _chochPrice)
MSS 체크 (CHoCH + 리테스트 확인)
Parameters:
_hadCHoCH (bool) : CHoCH 발생 여부
_chochDir (string) : CHoCH 방향
_currentHigh (float) : 현재 고가
_currentLow (float) : 현재 저가
_chochPrice (float) : CHoCH 발생 가격
Returns:
drawStructLabel(_price, _time, _type, _dir, _lblColor)
구조 변화 라벨 그리기
Parameters:
_price (float) : 가격
_time (int) : 시간
_type (string) : 구조 타입
_dir (string) : 방향
_lblColor (color) : 라벨 색상
drawStructLine(_price, _startTime, _endTime, _lineColor, _lineWidth)
구조 변화 라인 그리기
Parameters:
_price (float) : 가격
_startTime (int) : 시작 시간
_endTime (int) : 끝 시간
_lineColor (color) : 라인 색상
_lineWidth (int) : 라인 두께
StructType
구조 타입 상수
Fields:
BOS (series string)
CHOCH (series string)
MSS (series string)
SWEEP (series string)
TrendDir
추세 방향 상수
Fields:
UP (series string)
DOWN (series string)
NONE (series string)
StructState
구조 변화 상태
Fields:
_trend (series string) : 현재 추세 방향
_lastHHPrice (series float) : 마지막 HH 가격
_lastHHTime (series int) : 마지막 HH 시간
_lastLLPrice (series float) : 마지막 LL 가격
_lastLLTime (series int) : 마지막 LL 시간
_peakHHPrice (series float) : 최고 HH 가격 (BOS 레벨용)
_peakHHTime (series int) : 최고 HH 시간
_peakLLPrice (series float) : 최저 LL 가격 (BOS 레벨용)
_peakLLTime (series int) : 최저 LL 시간
_bosLevelHH (series float) : BOS 체크용 HH 레벨 (확정된 최고 HH)
_bosLevelHHTime (series int) : BOS 체크용 HH 시간
_bosLevelLL (series float) : BOS 체크용 LL 레벨 (확정된 최저 LL)
_bosLevelLLTime (series int) : BOS 체크용 LL 시간

Mirpapa_Lib_StructsLibrary "Mirpapa_Lib_Structs"
ICT 구조 변화 감지 라이브러리 (BOS, CHoCH, MSS, Sweep)
initStructState()
StructState 초기화
checkBOS(_trend, _currentClose, _lastHHPrice, _lastLLPrice)
BOS 체크 (추세 지속) - 종가 기준
Parameters:
_trend (string) : 현재 추세
_currentClose (float) : 현재 종가
_lastHHPrice (float) : 마지막 HH 가격
_lastLLPrice (float) : 마지막 LL 가격
Returns:
checkCHoCH(_trend, _currentClose, _lastHHPrice, _lastLLPrice)
CHoCH 체크 (추세 전환) - 종가 기준
Parameters:
_trend (string) : 현재 추세
_currentClose (float) : 현재 종가
_lastHHPrice (float) : 마지막 HH 가격
_lastLLPrice (float) : 마지막 LL 가격
Returns:
checkSweep(_currentHigh, _currentLow, _currentClose, _lastHHPrice, _lastLLPrice)
Sweep 체크 (유동성 수집)
Parameters:
_currentHigh (float) : 현재 고가
_currentLow (float) : 현재 저가
_currentClose (float) : 현재 종가
_lastHHPrice (float) : 마지막 HH 가격
_lastLLPrice (float) : 마지막 LL 가격
Returns:
checkMSS(_hadCHoCH, _chochDir, _currentHigh, _currentLow, _chochPrice)
MSS 체크 (CHoCH + 리테스트 확인)
Parameters:
_hadCHoCH (bool) : CHoCH 발생 여부
_chochDir (string) : CHoCH 방향
_currentHigh (float) : 현재 고가
_currentLow (float) : 현재 저가
_chochPrice (float) : CHoCH 발생 가격
Returns:
drawStructLabel(_price, _time, _type, _dir, _lblColor)
구조 변화 라벨 그리기
Parameters:
_price (float) : 가격
_time (int) : 시간
_type (string) : 구조 타입
_dir (string) : 방향
_lblColor (color) : 라벨 색상
drawStructLine(_price, _startTime, _endTime, _lineColor, _lineWidth)
구조 변화 라인 그리기
Parameters:
_price (float) : 가격
_startTime (int) : 시작 시간
_endTime (int) : 끝 시간
_lineColor (color) : 라인 색상
_lineWidth (int) : 라인 두께
StructType
구조 타입 상수
Fields:
BOS (series string)
CHOCH (series string)
MSS (series string)
SWEEP (series string)
TrendDir
추세 방향 상수
Fields:
UP (series string)
DOWN (series string)
NONE (series string)
StructState
구조 변화 상태
Fields:
_trend (series string) : 현재 추세 방향
_lastHHPrice (series float) : 마지막 HH 가격
_lastHHTime (series int) : 마지막 HH 시간
_lastLLPrice (series float) : 마지막 LL 가격
_lastLLTime (series int) : 마지막 LL 시간

Smart Money Flow Index (SMFI) - Advanced SMC [PhenLabs]📊Smart Money Flow Index (SMFI)
Version: PineScript™v6
📌Description
The Smart Money Flow Index (SMFI) is an advanced Smart Money Concepts implementation that tracks institutional trading behavior through multi-dimensional analysis. This comprehensive indicator combines volume-validated Order Block detection, Fair Value Gap identification with auto-mitigation tracking, dynamic Liquidity Zone mapping, and Break of Structure/Change of Character detection into a unified system.
Unlike basic SMC indicators, SMFI employs a proprietary scoring algorithm that weighs five critical factors: Order Block strength (validated by volume), Fair Value Gap size and recency, proximity to Liquidity Zones, market structure alignment (BOS/CHoCH), and multi-timeframe confluence. This produces a Smart Money Score (0-100) where readings above 70 represent optimal institutional setup conditions.
🚀Points of Innovation
Volume-Validated Order Block Detection – Only displays Order Blocks when formation candle exceeds customizable volume multiplier (default 1.5x average), filtering weak zones and highlighting true institutional accumulation/distribution
Auto-Mitigation Tracking System – Fair Value Gaps and Order Blocks automatically update status when price mitigates them, with visual distinction between active and filled zones preventing trades on dead levels
Proprietary Smart Money Score Algorithm – Combines weighted factors (OB strength 25%, FVG proximity 20%, Liquidity 20%, Structure 20%, MTF 15%) into single 0-100 confidence rating updating in real-time
ATR-Based Adaptive Calculations – All distance measurements use 14-period Average True Range ensuring consistent function across any instrument, timeframe, or volatility regime without manual recalibration
Dynamic Age Filtering – Automatically removes liquidity levels and FVGs older than configurable thresholds preventing chart clutter while maintaining relevant levels
Multi-Timeframe Confluence Integration – Analyzes higher timeframe bias with customizable multipliers (2-10x) and incorporates HTF trend direction into Smart Money Score for institutional alignment
🔧Core Components
Order Block Engine – Detects institutional supply/demand zones using characteristic patterns (down-move-then-strong-up for bullish, up-move-then-strong-down for bearish) with minimum volume threshold validation, tracks mitigation when price closes through zones
Fair Value Gap Scanner – Identifies price imbalances where current candle's low/high leaves gap with two-candle-prior high/low, filters by minimum size percentage, monitors 50% fill for mitigation status
Liquidity Zone Mapper – Uses pivot high/low detection with configurable lookback to mark swing points where stop losses cluster, extends horizontal lines to visualize sweep targets, manages lifecycle through age-based removal
Market Structure Analyzer – Tracks pivot progression to identify trend through higher-highs/higher-lows (bullish) or lower-highs/lower-lows (bearish), detects Break of Structure and Change of Character for trend/reversal confirmation
Scoring Calculation Engine – Evaluates proximity to nearest Order Blocks using ATR-normalized distance, assesses FVG recency and distance, calculates liquidity proximity with age weighting, combines structure bias and MTF trend into smoothed final score
🔥Key Features
Customizable Display Limits – Control maximum Order Blocks (1-10), Liquidity Zones (1-10), and FVG age (10-200 bars) to maintain clean charts focused on most relevant institutional levels
Gradient Strength Visualization – All zones render with transparency-adjustable coloring where stronger/newer zones appear more solid and weaker/older zones fade progressively providing instant visual hierarchy
Educational Label System – Optional labels identify each zone type (Bullish OB, Bearish OB, Bullish FVG, Bearish FVG, BOS) with color-coded text helping traders learn SMC concepts through practical application
Real-Time Smart Money Score Dashboard – Top-right table displays current score (0-100) with color coding (green >70, yellow 30-70, red <30) plus trend arrow for at-a-glance confidence assessment
Comprehensive Alert Suite – Configurable notifications for Order Block formation, Fair Value Gap detection, Break of Structure events, Change of Character signals, and high Smart Money Score readings (>70)
Buy/Sell Signal Integration – Automatically plots triangle markers when Smart Money Score exceeds 70 with aligned market structure and fresh Order Block detection providing clear entry signals
🎨Visualization
Order Block Boxes – Shaded rectangles extend from formation bar spanning high-to-low of institutional candle, bullish zones in green, bearish in red, with customizable transparency (80-98%)
Fair Value Gap Zones – Rectangular areas marking imbalances, active FVGs display in bright colors with adjustable transparency, mitigated FVGs switch to gray preventing trades on filled zones
Liquidity Level Lines – Dashed horizontal lines extend from pivot creation points, swing highs in bearish color (short targets above), swing lows in bullish color (long targets below), opacity decreases with age
Structure Labels – "BOS" labels appear above/below price when Break of Structure confirmed, colored by direction (green bullish, red bearish), positioned at 1% beyond highs/lows for visibility
Educational Info Panel – Bottom-right table explains key terminology (OB, FVG, BOS, CHoCH) and score interpretation (>70 high probability) with semi-transparent background for readability
📖Usage Guidelines
General Settings
Show Order Blocks – Default: On, toggles visibility of institutional supply/demand zones, disable when focusing solely on FVGs or Liquidity
Show Fair Value Gaps – Default: On, controls FVG zone display including active and mitigated imbalances
Show Liquidity Zones – Default: On, manages liquidity line visibility, disable on lower timeframes to reduce clutter
Show Market Structure – Default: On, toggles BOS/CHoCH label display
Show Smart Money Score – Default: On, controls score dashboard visibility
Order Block Settings
OB Lookback Period – Default: 20, Range: 5-100, controls bars scanned for Order Block patterns, lower values detect recent activity, higher values find older blocks
Min Volume Multiplier – Default: 1.5, Range: 1.0-5.0, sets minimum volume threshold as multiple of 20-period average, higher values (2.0+) filter for strongest institutional candles
Max Order Blocks to Display – Default: 3, Range: 1-10, limits simultaneous Order Blocks shown, lower settings (1-3) maintain focus on most recent zones
Fair Value Gap Settings
Min FVG Size (%) – Default: 0.3, Range: 0.1-2.0, defines minimum gap size as percentage of close price, lower values detect micro-imbalances, higher values focus on significant gaps
Max FVG Age (bars) – Default: 50, Range: 10-200, removes FVGs older than specified bars, lower settings (10-30) for scalping, higher (100-200) for swing trading
Show FVG Mitigation – Default: On, displays filled FVGs in gray providing visual history, disable to show only active untouched imbalances
Liquidity Zone Settings
Liquidity Lookback – Default: 50, Range: 20-200, sets pivot detection period for swing highs/lows, lower values (20-50) mark shorter-term liquidity, higher (100-200) identify major swings
Max Liquidity Age (bars) – Default: 100, Range: 20-500, removes liquidity lines older than specified bars, adjust based on timeframe
Liquidity Sensitivity – Default: 0.5, Range: 0.1-1.0, controls pivot detection sensitivity, lower values mark only major swings, higher values identify minor swings
Max Liquidity Zones to Display – Default: 3, Range: 1-10, limits total liquidity levels shown maintaining chart clarity
Market Structure Settings
Pivot Length – Default: 5, Range: 3-15, defines bars to left/right for pivot validation, lower values (3-5) create sensitive structure breaks, higher (10-15) filter for major shifts
Min Structure Move (%) – Default: 1.0, Range: 0.1-5.0, sets minimum percentage move required between pivots to confirm structure change
Multi-Timeframe Settings
Enable MTF Analysis – Default: On, activates higher timeframe trend analysis incorporation into Smart Money Score
Higher Timeframe Multiplier – Default: 4, Range: 2-10, multiplies current timeframe to determine analysis timeframe (4x on 15min = 1hour)
Visual Settings
Bullish Color – Default: Green (#089981), sets color for bullish Order Blocks, FVGs, and structure elements
Bearish Color – Default: Red (#f23645), defines color for bearish elements
Neutral Color – Default: Gray (#787b86), controls color of mitigated zones and neutral elements
Show Educational Labels – Default: On, displays text labels on zones identifying type (OB, FVG, BOS), disable once familiar with patterns
Order Block Transparency – Default: 92, Range: 80-98, controls Order Block box transparency
FVG Transparency – Default: 92, Range: 80-98, sets Fair Value Gap zone transparency independently from Order Blocks
Alert Settings
Alert on Order Block Formation – Default: On, triggers notification when new volume-validated Order Block detected
Alert on FVG Formation – Default: On, sends alert when Fair Value Gap appears enabling quick response to imbalances
Alert on Break of Structure – Default: On, notifies when BOS or CHoCH confirmed
Alert on High Smart Money Score – Default: On, alerts when Smart Money Score crosses above 70 threshold indicating high-probability setup
✅Best Use Cases
Order Block Retest Entries – After Break of Structure, wait for price retrace into fresh bullish Order Block with Smart Money Score >70, enter long on zone reaction targeting next liquidity level
Fair Value Gap Retracement Trading – When price creates FVG during strong move then retraces, enter as price approaches unfilled gap expecting institutional orders to continue trend
Liquidity Sweep Reversals – Monitor price approaching swing high/low liquidity zones against prevailing Smart Money Score trend, after stop hunt sweep watch for rejection into premium Order Block/FVG
Multi-Timeframe Confluence Setups – Identify alignment when current timeframe Order Block coincides with higher timeframe FVG plus MTF analysis showing matching trend bias
Break of Structure Continuations – After BOS confirms trend direction, trade pullbacks to nearest Order Block or FVG in direction of structure break using Smart Money Score >70 as entry filter
Change of Character Reversal Plays – When CHoCH detected indicating potential reversal, look for Smart Money Score pivot with opposing Order Block formation then enter on structure confirmation
⚠️Limitations
Lagging Pivot Calculations – Pivot-based features (Liquidity Zones, Market Structure) require bars to right of pivot for confirmation, meaning these elements identify levels retrospectively with delay equal to lookback period
Whipsaw in Ranging Markets – During choppy conditions, Order Blocks fail frequently and structure breaks produce false signals as Smart Money Score fluctuates without clear institutional bias, best used in trending markets
Volume Data Dependency – Order Block volume validation requires accurate volume data which may be incomplete on Forex pairs or limited in crypto exchange feeds
Subjectivity in Scoring Weights – Proprietary 25-20-20-20-15 weighting reflects general institutional behavior but may not optimize for specific instruments or market regimes, user cannot adjust factor weights
Visual Complexity on Lower Timeframes – Sub-hour timeframes generate excessive zones creating cluttered charts, requires aggressive display limit reduction and higher minimum thresholds
No Fundamental Integration – Indicator analyzes purely technical price action and volume without incorporating economic events, news catalysts, or fundamental shifts that override technical levels
💡What Makes This Unique
Unified SMC Ecosystem – Unlike indicators displaying Order Blocks OR FVGs OR Liquidity separately, SMFI combines all three institutional concepts plus market structure into single cohesive system
Proprietary Confidence Scoring – Rather than manual setup assessment, automated Smart Money Score quantifies probability by weighting five institutional dimensions into actionable 0-100 rating
Volume-Filtered Quality – Eliminates weak Order Blocks forming without institutional volume confirmation, ensuring displayed zones represent genuine accumulation/distribution
Adaptive Lifecycle Management – Automatically updates mitigation status and removes aged zones preventing trades on dead levels through continuous validity and age monitoring
Educational Integration – Built-in tooltips, labeled zones, and reference panel make indicator functional for both learning Smart Money Concepts and executing strategies
🔬How It Works
Order Block Detection – Scans for patterns where strong directional move follows counter-move creating last down-candle before rally (bullish OB) or last up-candle before sell-off (bearish OB), validates formations only when candle exhibits volume exceeding configurable multiple (default 1.5x) of 20-bar average volume
Fair Value Gap Identification – Compares current candle’s high/low against two-candles-prior low/high to detect price imbalances, calculates gap size as percentage of close and filters micro-gaps below minimum threshold (default 0.3%), monitors whether subsequent price fills 50% triggering mitigation status
Liquidity Zone Mapping – Employs pivot detection using configurable lookback (default 50 bars) to identify swing highs/lows where retail stops cluster, extends horizontal reference lines from pivot creation and applies age-based filtering to remove stale zones
Market Structure Analysis – Tracks pivot progression using structure-specific lookback (default 5 bars) to determine trend, confirms uptrend when new pivot high exceeds previous by minimum move percentage, detects Break of Structure when price breaks recent pivot level, flags Change of Character for potential reversals
Multi-Timeframe Confluence – When enabled, requests security data from higher timeframe (current TF × HTF multiplier, default 4x), compares HTF close against HTF 20-period MA to determine bias, contributes ±50 points to score ensuring alignment with institutional positioning on superior timeframe
Smart Money Score Calculation – Evaluates Order Block component via ATR-normalized distance producing max 100-point contribution weighted at 25%, assesses FVG factor through age penalty and distance at 20% weight, calculates Liquidity proximity at 20%, incorporates structure bias (±50-100 points) at 20%, adds MTF component at 15%, applies 3-period smoothing to reduce volatility
Visual Rendering and Lifecycle – Draws Order Block boxes, Fair Value Gap rectangles with color coding (green/red active, gray mitigated), extends liquidity dashed lines with fade-by-age opacity, plots BOS labels, displays Smart Money Score dashboard, continuously updates checking mitigation conditions and removing elements exceeding age/display limits
💡Note:
The Smart Money Flow Index combines multiple Smart Money Concepts into unified institutional order flow analysis. For optimal results, use the Smart Money Score as confluence filter rather than standalone entry signal – scores above 70 indicate high-probability setups but should be combined with risk management, higher timeframe bias, and market regime understanding.

Key Levels: Daily, Weekly, Monthly [BackQuant]Key Levels: Daily, Weekly, Monthly
Map the market’s “memory” in one glance—yesterday’s range, this week’s chosen day high/low, and D/W/M opens—then auto-clean levels once they break.
What it does
This tool plots three families of high-signal reference lines and keeps them tidy as price evolves:
Chosen Day High/Low (per week) — Pick a weekday (e.g., Monday). For each past week, the script records that day’s session high and low and projects them forward for a configurable number of bars. These act like “memory levels” that price often revisits.
Daily / Weekly / Monthly Opens — Plots the opening price of each new day, week, and month with separate styling. These opens frequently behave like magnets/flip lines intraday and anchors for regime on higher timeframes.
Auto-pruning — When price breaks a stored level, the script can automatically remove it to reduce clutter and refocus you on still-active lines. See: (broken levels removed).
Why these levels matter
Liquidity pockets — Prior day’s high/low and the daily open concentrate stops and pending orders. Mapping them quickly reveals likely sweep or fade zones. Example: previous day highs + daily open highlighting liquidity:
Context & regime — Monthly opens frame macro bias; trading above a rising cluster of monthly opens vs. below gives a clean top-down read. Example: monthly-only “macro outlook” view:
Cleaner charts — Auto-remove broken lines so you focus on what still matters right now.
What it plots (at a glance)
Past Chosen Day High/Low for up to N prior weeks (your choice), extended right.
Current Daily Open , Weekly Open , and Monthly Open , each with its own color, label, and forward extension.
Optional short labels (e.g., “Mon High”) or full labels (with week/month info).
How breaks are detected & cleaned
You control both the evidence and the timing of a “break”:
Break uses — Choose Close (more conservative) or Wick (more sensitive).
Inclusive? — If enabled, equality counts (≥ high or ≤ low). If disabled, you need a strict cross.
Allow intraday breaks? — If on, a level can break during the tracked day; if off, the script only counts breaks after the session completes.
Remove Broken Levels — When a break is confirmed, the line/label is deleted automatically. (See the demo: )
Quick start
Pick a Day of Week to Track (e.g., Monday).
Set how many weeks back to show (e.g., 8–10).
Choose how far to extend each family (bars to the right for chosen-day H/L and D/W/M opens).
Decide if a break uses Close or Wick , and whether equality counts.
Toggle Remove Broken Levels to keep the chart clean automatically.
Tips by use-case
Intraday bias — Watch the Daily Open as a magnet/flip. If price gaps above and holds, pullbacks to the daily open often decide direction. Pair with last day’s high/low for sweep→reversal or true breakout cues. See:
Weekly structure — Track the week’s chosen day (e.g., Monday) high/low across prior weeks. If price stalls near a cluster of old “Monday Highs,” look for sweep/reject patterns or continuation on reclaim.
Macro regime — Hide daily/weekly lines and keep only Monthly Opens to read bigger cycles at a glance (BTC/crypto especially). Example:
Customization
Use wicks or bodies for highs/lows (wicks capture extremes; bodies are stricter).
Line style & thickness — solid/dashed/dotted, width 1–5, plus global transparency.
Labels — Abbreviated (“Mon High”, “D Open”) or full (month/week/day info).
Color scheme — Separate colors for highs, lows, and each of D/W/M opens.
Capacity controls — Set how many daily/weekly/monthly opens and how many weeks of chosen-day H/L to keep visible.
What’s under the hood
On your selected weekday, the script records that session’s true high and true low (using wicks or body-based extremes—your choice), then projects a horizontal line forward for the next bars.
At each new day/week/month , it records the opening price and projects that line forward as well.
Each bar, the script checks your “break” rules; once broken, lines/labels are removed if auto-cleaning is on.
Everything updates in real time; past levels don’t repaint after the session finishes.
Recommended presets
Day trading — Weeks back: 6–10; extend D/W opens: 50–100 bars; Break uses: Close ; Inclusive: off; Auto-remove: on.
Swing — Fewer daily opens, more weekly opens (2–6), and 8–12 weeks of chosen-day H/L.
Macro — Show only Monthly Opens (1–6 months), dashed style, thicker lines for clarity.
Reading the examples
Broken lines disappear — decluttering in action:
Macro outlook — monthly opens as cycle rails:
Liquidity map — previous day highs + daily open:
Final note
These are not “signals”—they’re reference points that many participants watch. By standardising how you draw them and automatically clearing the ones that no longer matter, you turn a noisy chart into a focused map: where liquidity likely sits, where price memory lives, and which lines are still in play.

RTH Levels: VWAP + PDH/PDL + ONH/ONL + IBAlgo Index — Levels Pro (ONH/ONL • PDH/PDL • VWAP±Bands • IB • Gaps)
Purpose. A session-aware, non-repainting levels tool for intraday decision-making. Designed for futures and indices, with clean visuals, alerts, and a one-click Minimal Mode for screenshot-ready charts.
What it plots
• PDH/PDL (RTH-only) – Prior Regular Trading Hours high/low, computed intraday and frozen at the RTH close (no 24h mix-ups, no repainting).
• ONH/ONL – Prior Overnight high/low, held throughout RTH.
• RTH VWAP with ±σ bands – Volume-weighted variance, reset each RTH.
• Initial Balance (IB) – First N minutes of RTH, plus 1.5× / 2.0× extensions after IB completes.
• Today’s RTH Open & Prior RTH Close – With gap detection and “gap filled” alert.
• Killzone shading – NY Open (09:30–10:30 ET) and Lunch (11:15–13:30 ET).
• Values panel (top-right) – Each level with live distance in points & ticks.
• Right-edge level tags – With anti-overlap (stagger + vertical jitter).
• Price-scale tags – Native trackprice markers that always “stick” to the axis.
⸻
New in v6.4
• Minimal Mode: one click for a clean look (thinner lines, VWAP bands/IB extensions hidden, on-chart right-edge labels off; price-scale tags remain).
• Theme presets: Dark Hi-Contrast / Light Minimal / Futures Classic / Muted Dark.
• Anti-overlap controls: horizontal staggering, vertical jitter, and baseline offset to keep tags readable even when levels cluster.
⸻
Quick start (2 minutes)
1. Add to chart → keep defaults.
2. Sessions (ET):
• RTH Session default: 09:30–16:00 (US equities cash hours).
• Overnight Session default: 18:00–09:29.
Adjust for your market if you use different “day” hours (e.g., many use 08:20–13:30 ET for COMEX Gold).
3. Theme & Minimal Mode: pick a Theme Preset; enable Minimal Mode for screenshots.
4. Visibility: toggle PD/ON/VWAP/IB/References/Panel to taste.
5. Right-edge labels: turn Show Right-Edge Labels on. If they crowd, tune:
• Anti-overlap: min separation (ticks)
• Horizontal offset per tag (bars)
• Vertical jitter per step (ticks)
• Right-edge baseline offset (bars)
6. Alerts: open Add alert → Condition: and pick the events you want.
⸻
How levels are computed (no repainting)
• PDH/PDL: Intraday H/L are accumulated only while in RTH and saved at RTH close for “yesterday’s” values.
• ONH/ONL: Accumulated across the defined Overnight window and then held during RTH.
• RTH VWAP & ±σ: Volume-weighted mean and standard deviation, reset at the RTH open.
• IB: First N minutes of RTH (default 60). Extensions (1.5×/2.0×) appear after IB completes.
• Gaps: Today’s RTH open vs prior RTH close; “Gap Filled” triggers when price trades back to prior close.
⸻
Practical playbooks (how to trade around the levels)
1) PDH/PDL interactions
• Rejection: Price taps PDH/PDL then closes back inside → mean-reversion toward VWAP/IB.
• Acceptance: Close/hold beyond PDH/PDL with momentum → continuation to next HTF/IB target.
• Alert: PD Touch/Break.
2) ONH/ONL “taken”
• Often one ON extreme is taken during RTH. ONH Taken / ONL Taken → check if it’s a clean break or sweep & reclaim.
• Sweep + reclaim near VWAP can fuel rotations through the ON range.
3) VWAP ±σ framework
• Balanced: First tag of ±1σ often reverts toward VWAP.
• Trend: Persistent trade beyond ±1σ + IB break → target ±2σ/±3σ.
• Alerts: VWAP Cross and VWAP Reject (cross then immediate fail back).
4) IB breaks
• After IB completes, a clean IB break commonly targets 1.5× and sometimes 2.0×.
• Quick return inside IB = possible fade back to the opposite IB edge/VWAP.
• Alerts: IB Break Up / Down.
5) Gaps
• Gap-and-go: Opening drive away from prior close + VWAP support → trend until IB completion.
• Gap-fill: Weak open and VWAP overhead/underfoot → trade toward prior close; manage on Gap Filled alert.
Pro tip: Stack confluences (e.g., ONL sweep + VWAP reclaim + IB hold) and respect your execution rules (e.g., require a 5-minute close in direction, or your order-flow confirmation).
⸻
Inputs you’ll actually touch
• Sessions (ET): Session Timezone, RTH Session, Overnight Session.
• Visibility: toggles for PD/ON/VWAP/IB/Ref/Panel.
• VWAP bands: set σ multipliers (±1/±2/±3).
• IB: duration (minutes) and extension multipliers (1.5× / 2.0×).
• Style & Theme: Theme Preset, Main Line Width, Trackprice, Minimal Mode, and anti-overlap controls.
⸻
Alerts included
• PD Touch/Break — High ≥ PDH or Low ≤ PDL
• ONH Taken / ONL Taken — First in-RTH take of ONH/ONL
• VWAP Cross — Close crosses VWAP
• VWAP Reject — Cross then immediate fail back
• IB Break Up / Down — Break of IB High/Low after IB completes
• Gap Filled — Price trades back to prior RTH close
Setup: Add alert → Condition: Algo Index — Levels Pro → choose event → message → Notify on app/email.
⸻
Panel guide
The top-right panel shows each level plus live distance from last price:
LevelValue (Δpoints | Δticks)
Coloring: green if level is below current price, red if above.
⸻
Styling & screenshot tips
• Use Theme Preset that matches your chart.
• For dark charts, “Dark Hi-Contrast” with Main Line Width = 3 works well.
• Enable Trackprice for crisp axis tags that always stick to the right edge.
• Turn on Minimal Mode for cleaner screenshots (no VWAP bands or IB extensions, on-chart tags off; price-scale tags remain).
• If tags crowd, increase min separation (ticks) to 30–60 and horizontal offset to 3–5; add vertical jitter (4–12 ticks) and/or push tags farther right with baseline offset (bars).
⸻
Behavior & limitations
• Levels are computed incrementally; tables refresh on the last bar for efficiency.
• Right-edge labels are placed at bar_index + offset and do not track extra right-margin scrolling (TradingView limitation). The price-scale tags (from trackprice) do track the axis.
• “RTH” is what you define in inputs. If your market uses different day hours, change the session strings so PDH/PDL reflect your definition of “yesterday’s session.”
⸻
FAQ
Q: My PDH/PDL don’t match the daily chart.
A: By design this uses RTH-only highs/lows, not 24h daily bars. Adjust sessions if you want a different definition.
Q: Right-edge tags overlap or don’t sit at the far right.
A: Increase min separation / horizontal offset / vertical jitter and/or push tags farther with baseline offset. If you want markers that always hug the axis, rely on Trackprice.
Q: Can I change killzones?
A: Yes—edit the session strings in settings or request a version with user inputs for custom windows.
⸻
Disclaimer
Educational use only. This is not financial advice. Always apply your own risk management and confirmation rules.
⸻
Enjoy it? Please ⭐ the script and share screenshots using Minimal Mode + a Theme Preset that fits your style.

Liquidity Zones (JTS)Title: Liquidity Zones (JTS)
Description:
This script marks out key liquidity zones using pivot highs and lows. It includes:
Buy-Side Liquidity (Highs): Shown in red lines
Sell-Side Liquidity (Lows): Shown in green lines
Sweep Protection: Zones will only be removed after a defined number of bars AND a true sweep beyond the level
Toggle Controls: Enable/disable highs or lows individually
Adjustable Settings: Pivot length, sweep delay, max lines, and colors
Perfect for traders looking to track untapped or recently swept liquidity.
Created by JTS
For educational and strategic use

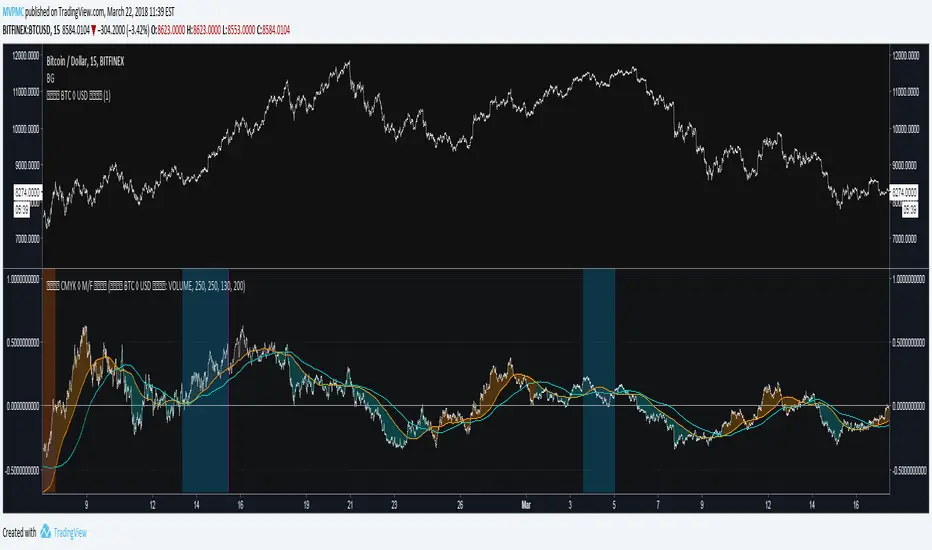
CMYK MOVEMENT / FORCE ◊ Introduction
Price Movement / Force
A script that uses Volume and price movement to indicate Bullish/Bearish momentum, like a hindsight MACD.
◊ Origin
This is a part of Project XIAM.
◊ Theoretical Approach
Philosophy γ :: consequential
◊ Usage
Early Indication of Bullish/Bearish momentum, before price reversal.
CLEANSIGNAL can be used as input source, for more reliable results.
Currently BTC◊USD ETH◊USD XRP◊USD Are available in my scripts.
Otherwise the ticker's volume is used as input.
My own indicators will be updated soon, to include source selection in their settings.
◊ Features
BULL / BEAR Phase to open orders. ( HINT : combine with RSI ? )
EXIT sweep : to find appropriate exit moments, to close opened orders.
Sweep is muffled if Phase continues.
Sweep Finalize send final EXIT signal.
◊ Community
Wanna share your findings ? or need help resolving a problem ?
CMYK :: discord.gg
AUTOVIEW :: discordapp.com
TRADINGVIEW UNOFFICIAL :: discord.gg
EdgeFlow Pullback [CHE]EdgeFlow Pullback \ — Icon & Visual Guide (Deep Dive)
TL;DR (1-minute read)
⏳ Hourglass = Pending verdict. A countdown runs from the signal bar until your Evaluation Window ends.
✔ Checkmark (green) = OK. After the evaluation window, price (HLC3) is on the correct side of the EMA144 for that signal’s direction.
✖ Cross (red) = Fail. After the evaluation window, price (HLC3) is on the wrong side of the EMA144.
▲ / ▼ Triangles = the actual PB Long/Short signal bar (sequence completed in time).
Small lime/red crosses = visual markers when HLC3 crosses EMA144 (context, not trade signals).
Orange line = EMA144 (baseline/trend filter).
T3 line color = Context signal: green when T3 is below HLC3, red when T3 is above HLC3.
Icon Glossary (What each symbol means)
1) ⏳ Hourglass — “Pending / Countdown”
Appears immediately when a PB signal fires (Long or Short).
Shows `⏳ currentBars / EvaluationBars` (e.g., `⏳ 7/30`).
The label stays anchored at the signal bar and its original price level (it does not drift with price).
During ⏳ you get no verdict yet. It’s simply the waiting period before grading.
2) ✔ Checkmark (green) — “Condition met”
Appears after the Evaluation Window completes.
Logic:
Long signal: HLC3 (typical price) is above EMA144 → ✔
Short signal: HLC3 is below EMA144 → ✔
The label turns green and text says “✔ … Condition met”.
This is rules-based grading, not PnL. It tells you if the post-signal structure behaved as expected.
3) ✖ Cross (red) — “Condition failed”
Appears after the Evaluation Window completes if the condition above is not met.
Label turns red with “✖ … Condition failed”.
Again: rules-based verdict, not a guarantee of profit or loss.
4) ▲ “PB Long” triangle (below bar)
Marks the exact bar where the 4-step Long sequence completed within the allowed window.
That bar is your signal bar for Long setups.
5) ▼ “PB Short” triangle (above bar, red)
Same as above, for Short setups.
6) Lime/Red “+” crosses (tiny cross markers)
Lime cross (below bar): HLC3 crosses above EMA144 (crossover).
Red cross (above bar): HLC3 crosses below EMA144 (crossunder).
These crosses are context markers; they’re not entry signals by themselves.
The Two Clocks (Don’t mix them up)
There are two different time windows at play:
1. Signal Window — “Max bars for full sequence”
A pullback signal (Long or Short) only fires if the 4-step sequence completes within this many bars.
If it takes too long: reset (no signal, no triangle, no label).
Purpose: avoid stale setups.
2. Evaluation Window — “Evaluation window after signal (bars)”
Starts after the signal bar. The label shows an ⏳ countdown.
When it reaches the set number of bars, the indicator checks whether HLC3 is on the correct side of EMA144 for the signal direction.
Then it stamps the signal with ✔ (OK) or ✖ (Fail).
Timeline sketch (Long example):
```
→ ▲ PB Long at bar t0
Label shows: ⏳ 0/EvalBars
t0+1, t0+2, ... t0+EvalBars-1 → still ⏳
At t0+EvalBars → Check HLC3 vs EMA144
Result → ✔ (green) or ✖ (red)
(Label remains anchored at t0 / signal price)
```
What Triggers the PB Signal (so you know why triangles appear)
LONG sequence (4 steps in order):
1. T3 falling (the pullback begins)
2. HLC3 crosses under EMA144
3. T3 rising (pullback ends)
4. HLC3 crosses over EMA144 → PB Long triangle
SHORT sequence (mirror):
1. T3 rising
2. HLC3 crosses over EMA144
3. T3 falling
4. HLC3 crosses under EMA144 → PB Short triangle
If steps 1→4 don’t complete in time (within Max bars for full sequence), the sequence is abandoned (no signal).
Lines & Colors (quick interpretation)
EMA144 (orange): your baseline trend filter.
T3 (green/red):
Green when T3 < HLC3 (price above the smoothed path; often supportive in up-moves)
Red when T3 > HLC3 (price below the smoothed path; often pressure in down-moves)
HLC3 (gray): the typical price the logic uses ( (H+L+C)/3 ).
Label Behavior (anchoring & cleanup)
Each signal creates one label at the signal bar with ⏳.
The label is position-locked: it stays at the same bar index and y-price it was born at.
After the evaluation check, the label text and color update to ✔/✖, but position stays fixed.
The indicator keeps only the last N labels (your “Show only the last N labels” input). Older ones are deleted to reduce clutter.
What You Can (and Can’t) Infer from ✔ / ✖
✔ OK: Structure behaved as intended during the evaluation window (HLC3 finished on the correct side of EMA144).
Inference: The pullback continued in the expected direction post-signal.
✖ Fail: Structure ended up opposite the expectation.
Inference: The pullback did not continue cleanly (chop, reversal, or insufficient follow-through).
> Important: ✔/✖ is not profit or loss. It’s an objective rule check. Use it to identify market regimes where your entries perform best.
Input Settings — How they change the visuals
T3 length:
Shorter → faster turns, more signals (and more noise).
Longer → smoother turns, fewer but cleaner sequences.
T3 volume factor (0–1, default 0.7):
Higher → more curvature/smoothing.
Typical sweet spot: 0.5–0.9.
EMA length (baseline) default 144:
Smaller → faster baseline, more cross events, more aggressive signals.
Larger → slower, stricter trend confirmation.
Max bars for full sequence (signal window):
Smaller → only fresh, snappy pullbacks can signal.
Larger → allows slower pullbacks to complete.
Evaluation window (after signal):
Smaller → verdict arrives quickly (less tolerance).
Larger → gives the trade more time to prove itself structurally.
Show only the last N labels:
Controls chart clutter. Increase for more history, decrease for focus.
(FYI: The “Debug” toggle exists but doesn’t draw extra overlays in this version.)
Practical Reading Flow (how to use visuals in seconds)
1. Triangles catch your eye: ▲ for Long, ▼ for Short. That’s the setup completion.
2. ⏳ label starts—don’t judge yet; let the evaluation run.
3. Watch EMA slope and T3 color for context (trend + pressure).
4. After the window: ✔/✖ stamps the outcome. Log what the market was like when you got ✔.
Common “Why did…?” Questions
Q: Why did I get no triangle even though T3 turned and EMA crossed?
A: The 4 steps must happen in order and within the Signal Window. If timing breaks, the sequence resets.
Q: Why did my label stay ⏳ for so long?
A: That’s by design until the Evaluation Window completes. The verdict only happens at the end of that window.
Q: Why is ✔/✖ different from my PnL?
A: It’s a structure check, not a profit check. It doesn’t know your entries/exits/stops.
Q: Do the small lime/red crosses mean buy/sell?
A: No. They’re context markers for HLC3↔EMA crosses, useful inside the sequence but not standalone signals.
Pro Tips (turn visuals into decisions)
Entry: Use the ▲/▼ triangle as your trigger, in trend direction (check EMA slope/market structure).
Stop: Behind the pullback swing around the signal bar.
Exit: Structure levels, R-multiples, or a reverse HLC3↔EMA cross as a trailing logic.
Tuning:
Intraday/volatile: shorter T3/EMA + tighter Signal Window.
Swing/slow: default 144 EMA + moderate windows.
Learn quickly: Filter your chart to show only ✔ or only ✖ windows in your notes; see which sessions, assets, and volatility regimes suit the system.
Disclaimer
No indicator guarantees profits. Sweep2Trade Pro \ is a decision aid; always combine with solid risk management and your own judgment. Backtest, forward test, and size responsibly.
The content provided, including all code and materials, is strictly for educational and informational purposes only. It is not intended as, and should not be interpreted as, financial advice, a recommendation to buy or sell any financial instrument, or an offer of any financial product or service. All strategies, tools, and examples discussed are provided for illustrative purposes to demonstrate coding techniques and the functionality of Pine Script within a trading context.
Any results from strategies or tools provided are hypothetical, and past performance is not indicative of future results. Trading and investing involve high risk, including the potential loss of principal, and may not be suitable for all individuals. Before making any trading decisions, please consult with a qualified financial professional to understand the risks involved.
By using this script, you acknowledge and agree that any trading decisions are made solely at your discretion and risk.
Enhance your trading precision and confidence 🚀
Happy trading
Chervolino

eBacktesting - Learning: Power of 3eBacktesting - Learning: Power of 3 highlights ICT’s “Power of 3” intraday story:
- Accumulation: price builds a quiet range
- Manipulation: a sweep grabs liquidity above or below that range (the classic stop hunt)
- Distribution: the real move expands away from that range, often in the opposite direction of the sweep
Use it to train your eyes to recognize when price is likely “setting up” vs when the session is actually “moving,” and to build a clean daily narrative around liquidity and expansion.
These indicators are built to pair perfectly with the eBacktesting extension, where traders can practice these concepts step-by-step. Backtesting concepts visually like this is one of the fastest ways to learn, build confidence, and improve trading performance.
Educational use only. Not financial advice.
