Combo Strategy 123 Reversal & Gann Swing Oscillator This is combo strategies for get a cumulative signal.
First strategy
This System was created from the Book "How I Tripled My Money In The
Futures Market" by Ulf Jensen, Page 183. This is reverse type of strategies.
The strategy buys at market, if close price is higher than the previous close
during 2 days and the meaning of 9-days Stochastic Slow Oscillator is lower than 50.
The strategy sells at market, if close price is lower than the previous close price
during 2 days and the meaning of 9-days Stochastic Fast Oscillator is higher than 50.
Second strategy
The Gann Swing Oscillator has been adapted from Robert Krausz's book,
"A W.D. Gann Treasure Discovered". The Gann Swing Oscillator helps
define market swings.
WARNING:
- For purpose educate only
- This script to change bars colors.
Tìm kiếm tập lệnh với "swing"

Gann Swing Oscillator The Gann Swing Oscillator has been adapted from Robert Krausz's book,
"A W.D. Gann Treasure Discovered". The Gann Swing Oscillator helps
define market swings.
You can change long to short in the Input Settings
Please, use it only for learning or paper trading. Do not for real trading.

Gann Swing Oscillator Strategy The Gann Swing Oscillator has been adapted from Robert Krausz's book,
"A W.D. Gann Treasure Discovered". The Gann Swing Oscillator helps
define market swings.


Big Trend Catcher: Dual-Gate EMA & ATR Trailing Swing TraderThe Big Trend Catcher: Long-Only Progressive Swing System
OVERVIEW
The Big Trend Catcher is a high-conviction, long-only swing trading strategy designed to identify and ride sustained market moves. Unlike traditional trend-following systems that often get "chopped out" during sideways consolidation, this strategy utilizes a Dual-Gate Filter to ensure you only enter when short-term momentum and the long-term trend are in total alignment.
It is specifically tuned for high-growth stocks and ETFs where capturing the lion’s share of a multi-week or multi-month move is the primary objective.
CORE LOGIC: THE DUAL-GATE SYSTEM
To maintain a high quality of entries, the strategy requires a "confirmed launch" through two distinct filters:
The Momentum Gate (20 EMA): Identifies immediate price acceleration and volume-backed impulse.
The Long-Term Gate (100 EMA): Acts as the ultimate trend filter. The script utilizes a "Signal Memory" logic—if an impulse happens while price is still below the 100 EMA, the trade is held in a "Pending" state. The entry only triggers once the price closes firmly above the 100 EMA.
Goal: This prevents "bottom fishing" in established downtrends and keeps you in cash during sideways "death loops" when the long-term direction is unclear.
KEY FEATURES
1. Progressive Pyramiding (Scale-In)
The biggest profits in swing trading are often made by adding to winners. This system features two automated scale-in triggers:
Velocity Adds (VOLC): Adds to the position if the stock is up >10% and moving with rising momentum, allowing you to build a larger position as the trend proves its strength.
Pullback Adds: Adds to the position when the price tests the 20 EMA and holds, allowing you to buy the "dip" within a healthy uptrend.
2. The Phoenix Re-Entry
This logic is designed to catch "V-shaped" recoveries. If the strategy exits on a trend break but the price aggressively reclaims the 20 EMA on massive volume shortly after, it re-enters the trade. This ensures you aren't left behind during the second leg of a major run after a temporary shakeout.
3. Iron-Floor ATR Exit
We use a 3.5x ATR Trailing Stop combined with the 100 EMA. This wider-than-average "breathing room" is designed to keep you in for significant gains while ignoring the minor daily volatility that often shakes out traders with tighter stops.
HOW TO USE
Best Timeframes: Daily (D) is recommended for identifying major cycles, but it can be applied to the 4-Hour (4H) for more active swing trading.
Settings:
* 20 EMA: Your short-term momentum guide.
* 100 EMA: Your long-term trend guide.
* ATR Multiplier: Set to 3.5 for maximum "trend hugging."
SUMMARY OF VISUALS
Blue Line (100 EMA): The Long-Term Trend.
Yellow Line (20 EMA): The Short-Term Momentum.
Red Stepped Line: Your ATR Trailing Floor (The "Iron Floor").
Lime Triangle: Initial Trade Entry.
Blue/Orange Shapes: Progressive Scale-in points.

Accumulative Swing Cloud [MarkitTick]💡This indicator presents a modernized hybrid approach to J. Welles Wilder’s classical Accumulative Swing Index (ASI). While the traditional ASI is often viewed as a simple line oscillator used to confirm price breakouts, the Accumulative Swing Cloud reconstructs this concept into a dynamic trend-following system. By smoothing the raw ASI data into multiple moving average layers, this script creates a "Cloud" structure that visualizes the strength, direction, and momentum of the swing index, effectively treating the ASI value itself as a tradeable price action entity.
● Originality and Utility
The standard Accumulative Swing Index is a powerful tool for seeing through the "noise" of open, high, low, and close prices to find the real trend. However, looking at a raw ASI line can be jagged and difficult to interpret for sustained trends. This script innovates by applying "Cloud Dynamics" to the ASI. It calculates three distinct moving averages (Fast, Mid, and Slow) of the ASI value itself. The area between the Fast and Slow averages is filled with a dynamic gradient color. This allows traders to not only see the trend direction (Bullish or Bearish) but also gauge the volatility and strength of the move based on the expansion or contraction of the cloud's width. Additionally, this version introduces an optional Volume Integration feature, allowing the Swing Index calculations to be weighted by relative volume, giving more significance to moves backed by high market participation.
● Methodology and Calculations
The core of this indicator relies on the Swing Index calculation. It compares the current bar's Open, High, Low, and Close against the previous bar's values to derive a variable "R" (a measure of the market's range).
The script determines the largest price movement (K) among the High-Close, Low-Close, and High-Low ranges.
It calculates the "R" value based on the relationship between the daily range and the gap between the prior close and current open.
A Swing Index (SI) value is derived using the Limit Move value (T), the defined Multiplier, and the calculated R and K values.
This SI is accumulated into a running total (ASI State).
If Volume Integration is enabled, the SI is multiplied by a Volume Factor (Current Volume divided by Average Volume), capped at 3.0 to prevent outlier distortion.
● Visual Guide
The indicator plots several key visual elements on the chart:
Cloud Fast (Green Line): Represents the shorter-term moving average of the Accumulative Swing Index.
Cloud Slow (Red Line): Represents the longer-term moving average.
Cloud Fill (Gradient Area): The space between the Fast and Slow lines.
Green Gradient: Indicates the Fast MA is above the Slow MA (Bullish Trend).
Red Gradient: Indicates the Fast MA is below the Slow MA (Bearish Trend).
Gradient Intensity: The opacity of the color scales dynamically based on the width of the cloud relative to its recent historical maximum. A wider cloud (stronger trend/higher volatility) appears more solid, while a narrow cloud appears more transparent.
ASI Line (Color-Coded Line): The thick line represents the current raw Accumulative Swing Index value. It changes color (Green/Red) based on its position relative to the Signal Line.
Signal Line (Gray Line): A Simple Moving Average of the ASI Line, acting as a trigger for immediate reversals.
Bar Coloring: The main price candles are colored to match the current state of the Cloud (Green for Bullish Cloud, Red for Bearish Cloud).
● How to Use
Trend Identification: Use the Cloud color to determine the primary trend. A Green Cloud suggests an uptrending market structure, while a Red Cloud suggests a downtrend.
Entry Signals: Traders often look for the "ASI Line" to cross the "Signal Line" in the direction of the Cloud. For example, if the Cloud is Green, a crossover of the ASI Line above the Signal Line is a bullish confirmation.
Cloud Crossovers: A crossover of the Fast and Slow Cloud lines represents a major structural shift in the Accumulative Swing Index trend.
Volatility Filter: Pay attention to the gradient intensity. A very narrow (transparent) cloud indicates low momentum or consolidation, while a widening (solid) cloud indicates expanding momentum.
● Inputs and Settings
ASI Core Engine: Configure the Daily Limit (T) and Multiplier to tune the sensitivity of the Swing Index calculation.
Volume Integration: Toggle "Weight ASI by Volume" to factor in volume spikes. Adjust "Volume Avg Length" to define the baseline volume.
Cloud Dynamics: Choose the Moving Average type (EMA, SMA, RMA, WMA) and set the Fast, Mid, and Slow lengths to customize the cloud's reactivity.
Visual Enhancements: Toggle "Color Candles by Cloud Width" to apply the gradient coloring directly to the price bars.
● Disclaimer
All provided scripts and indicators are strictly for educational exploration and must not be interpreted as financial advice or a recommendation to execute trades. I expressly disclaim all liability for any financial losses or damages that may result, directly or indirectly, from the reliance on or application of these tools. Market participation carries inherent risk where past performance never guarantees future returns, leaving all investment decisions and due diligence solely at your own discretion.

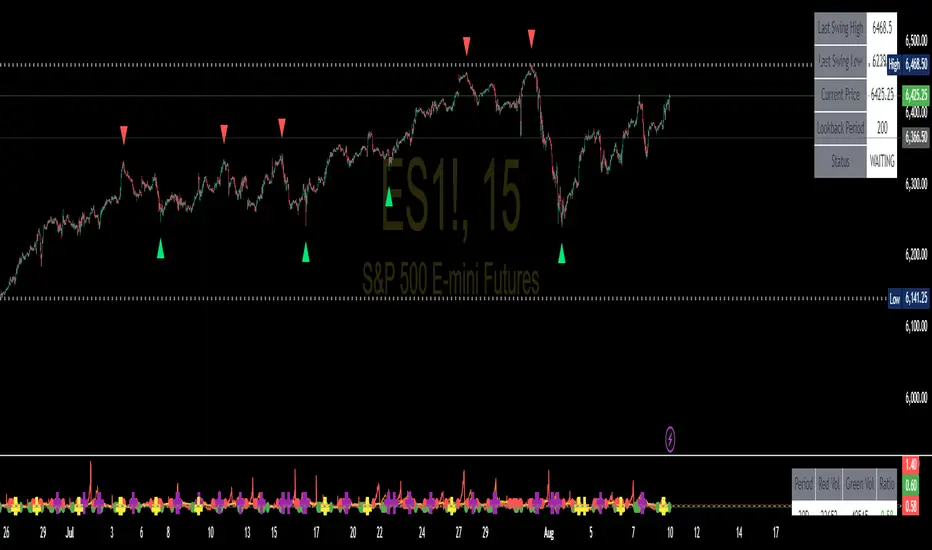
Swing High/Low SignalsSwing High/Low Signals – profit gang
Quickly spot recent market turning points with this clean swing high/low indicator.
Marks swing highs & lows with labels or triangles
Optional connecting lines & background highlights
Alerts when new swings form
Info table showing last swing levels & current price
Fully adjustable lookback period for any timeframe.
Disclaimer: For educational use only. Not financial advice.
Gann Swing PointsIndicator Logic
This is a GANN-style swing indicator that classifies bars based on their high/low structure relative to the previous bar.
I strongly encourage you to replay bars on Tradingview using this indicator to get a sense of how it creates pivot (or swing) points
Bar Classification:
Up-Bar (direction: 'up'): Higher High and Higher Low (HH/HL)
Down-Bar (direction: 'down'): Lower High and Lower Low (LH/LL)
Outside-Bar (generates 2 directions):
Green: 'down' then 'up'
Red: 'up' then 'down'
Inside-Bar: No direction generated (HL/LH)
Swing Line Logic
The swing line continues in the current direction until n opposite directions are detected.
n is the "n-direction" parameter (commonly set to 2, so 2 consecutive opposite direction is needed to turn the swing)
When n opposing directions occur, the swing turns, creating a pivot point
Inside bar is ignored, so e.g up-bar -> inside-bar -> up-bar generates "up", "up" direction
A top pivot is formed when the swing turns down
A bottom pivot is formed when it turns up
Note: This swing logic is inherently lagging — it only confirms tops/bottoms after the fact
This swing structure gives the system a clear and noise-resistant way to identify pivot points (swing-points)

Multi-Indicator Swing [TIAMATCRYPTO]v6# Strategy Description:
## Multi-Indicator Swing
This strategy is designed for swing trading across various markets by combining multiple technical indicators to identify high-probability trading opportunities. The system focuses on trend strength confirmation and volume analysis to generate precise entry and exit signals.
### Core Components:
- **Supertrend Indicator**: Acts as the primary trend direction filter with optimized settings (Factor: 3.0, ATR Period: 10) to balance responsiveness and reliability.
- **ADX (Average Directional Index)**: Confirms the strength of the prevailing trend, filtering out sideways or choppy market conditions where the strategy avoids taking positions.
- **Liquidity Delta**: A volume-based indicator that analyzes buying and selling pressure imbalances to validate trend direction and potential reversals.
- **PSAR (Optional)**: Can be enabled to add additional confirmation for trend changes, turned off by default to reduce signal filtering.
### Key Features:
- **Flexible Direction Trading**: Choose between long-only, short-only, or bidirectional trading to adapt to market conditions or account restrictions.
- **Conservative Risk Management**: Implements fixed percentage-based stop losses (default 2%) and take profits (default 4%) for a positive risk-reward ratio.
- **Realistic Backtesting Parameters**: Includes commission (0.1%) and slippage (2 points) to reflect real-world trading conditions.
- **Visual Signals**: Clear buy/sell arrows with customizable sizes for easy identification on the chart.
- **Information Panel**: Dynamic display showing active indicators and current risk settings.
### Best Used On:
Daily timeframes for cryptocurrencies, forex, or stock indices. The strategy performs optimally on assets with clear trending behavior and sufficient volatility.
### Default Settings:
Optimized for conservative position sizing (5% of equity per trade) with an initial capital of $10,000. The backtesting period (2021-2023) provides a statistically significant sample of varied market conditions.

Quarterly Theory ICT 03 [TradingFinder] Precision Swing Points🔵 Introduction
Precision Swing Point (PSP) is a divergence pattern in the closing of candles between two correlated assets, which can indicate a potential trend reversal. This structure appears at market turning points and highlights discrepancies between the price behavior of two related assets.
PSP typically forms in key timeframes such as 5-minute, 15-minute, and 90-minute charts, and is often used in combination with Smart Money Concepts (SMT) to confirm trade entries.
PSP is categorized into Bearish PSP and Bullish PSP :
Bearish PSP : Occurs when an asset breaks its previous high, and its middle candle closes bullish, while the correlated asset closes bearish at the same level. This divergence signals weakness in the uptrend and a potential price reversal downward.
Bullish PSP : Occurs when an asset breaks its previous low, and its middle candle closes bearish, while the correlated asset closes bullish at the same level. This suggests weakness in the downtrend and a potential price increase.
🟣 Trading Strategies Using Precision Swing Point (PSP)
PSP can be integrated into various trading strategies to improve entry accuracy and filter out false signals. One common method is combining PSP with SMT (divergence between correlated assets), where traders identify divergence and enter a trade only after PSP confirms the move.
Additionally, PSP can act as a liquidity gap, meaning that price tends to react to the wick of the PSP candle, making it a favorable entry point with a tight stop-loss and high risk-to-reward ratio. Furthermore, PSP combined with Order Blocks and Fair Value Gaps in higher timeframes allows traders to identify stronger reversal zones.
In lower timeframes, such as 5-minute or 15-minute charts, PSP can serve as a confirmation for more precise entries in the direction of the higher timeframe trend. This is particularly useful in scalping and intraday trading, helping traders execute smarter entries while minimizing unnecessary stop-outs.
🔵 How to Use
PSP is a trading pattern based on divergence in candle closures between two correlated assets. This divergence signals a difference in trend strength and can be used to identify precise market turning points. PSP is divided into Bullish PSP and Bearish PSP, each applicable for long and short trades.
🟣 Bullish PSP
A Bullish PSP forms when, at a market turning point, the middle candle of one asset closes bearish while the correlated asset closes bullish. This discrepancy indicates weakness in the downtrend and a potential price reversal upward.
Traders can use this as a signal for long (buy) trades. The best approach is to wait for price to return to the wick of the PSP candle, as this area typically acts as a liquidity level.
f PSP forms within an Order Block or Fair Value Gap in a higher timeframe, its reliability increases, allowing for entries with tight stop-loss and optimal risk-to-reward ratios.
🟣 Bearish PSP
A Bearish PSP forms when, at a market turning point, the middle candle of one asset closes bullish while the correlated asset closes bearish. This indicates weakness in the uptrend and a potential price decline.
Traders use this pattern to enter short (sell) trades. The best entry occurs when price retests the wick of the PSP candle, as this level often acts as a resistance zone, pushing price lower.
If PSP aligns with a significant liquidity area or Order Block in a higher timeframe, traders can enter with greater confidence and place their stop-loss just above the PSP wick.
Overall, PSP is a highly effective tool for filtering false signals and improving trade entry precision. Combining PSP with SMT, Order Blocks, and Fair Value Gaps across multiple timeframes allows traders to execute higher-accuracy trades with lower risk.
🔵 Settings
Mode :
2 Symbol : Identifies PSP and PCP between two correlated assets.
3 Symbol : Compares three assets to detect more complex divergences and stronger confirmation signals.
Second Symbol : The second asset used in PSP and correlation calculations.
Third Symbol : Used in three-symbol mode for deeper PSP and PCP analysis.
Filter Precision X Point : Enables or disables filtering for more precise PSP and PCP detection. This filter only identifies PSP and PCP when the base asset's candle qualifies as a Pin Bar.
Trend Effect : By changing the Trend Effect status to "Off," all Pin bars, whether bullish or bearish, are displayed regardless of the current market trend. If the status remains "On," only Pin bars in the direction of the main market trend are shown.
Bullish Pin Bar Setting : Using the "Ratio Lower Shadow to Body" and "Ratio Lower Shadow to Higher Shadow" settings, you can customize your bullish Pin bar candles. Larger numbers impose stricter conditions for identifying bullish Pin bars.
Bearish Pin Bar Setting : Using the "Ratio Higher Shadow to Body" and "Ratio Higher Shadow to Lower Shadow" settings, you can customize your bearish Pin bar candles. Larger numbers impose stricter conditions for identifying bearish Pin bars.
🔵 Conclusion
Precision Swing Point (PSP) is a powerful analytical tool in Smart Money trading strategies, helping traders identify precise market turning points by detecting divergences in candle closures between correlated assets. PSP is classified into Bullish PSP and Bearish PSP, each playing a crucial role in detecting trend weaknesses and determining optimal entry points for long and short trades.
Using the PSP wick as a key liquidity level, integrating it with SMT, Order Blocks, and Fair Value Gaps, and analyzing higher timeframes are effective techniques to enhance trade entries. Ultimately, PSP serves as a complementary tool for improving entry accuracy and reducing unnecessary stop-outs, making it a valuable addition to Smart Money trading methodologies.

Fibonacci Swing Trading BotStrategy Overview for "Fibonacci Swing Trading Bot"
Strategy Name: Fibonacci Swing Trading Bot
Version: Pine Script v5
Purpose: This strategy is designed for swing traders who want to leverage Fibonacci retracement levels and candlestick patterns to enter and exit trades on higher time frames.
Key Components:
1. Multiple Timeframe Analysis:
The strategy uses a customizable timeframe for analysis. You can choose between 4hour, daily, weekly, or monthly time frames to fit your preferred trading horizon. The high and low-price data is retrieved from the selected timeframe to identify swing points.
2. Fibonacci Retracement Levels:
The script calculates two key Fibonacci retracement levels:
0.618: A common level where price often retraces before resuming its trend.
0.786: A deeper retracement level, often used to identify stronger support/resistance areas.
These levels are dynamically plotted on the chart based on the highest high and lowest low over the last 50 bars of the selected timeframe.
3. Candlestick Based Entry Signals:
The strategy uses candlestick patterns as the only indicator for trade entries:
Bullish Candle: A green candle (close > open) that forms between the 0.618 retracement level and the swing high.
Bearish Candle: A red candle (close < open) that forms between the 0.786 retracement level and the swing low.
When these candlestick patterns align with the Fibonacci levels, the script triggers buy or sell signals.
4. Risk Management:
Stop Loss: The stop loss is set at 1% below the entry price for long trades and 1% above the entry price for short trades. This tight risk management ensures controlled losses.
Take Profit: The strategy uses a 2:1 risk-to-reward ratio. The take profit is automatically calculated based on this ratio relative to the stop loss.
5. Buy/Sell Logic:
Buy Signal: Triggered when a bullish candle forms above the 0.618 retracement level and below the swing high. The bot then places a long position.
Sell Signal: Triggered when a bearish candle forms below the 0.786 retracement level and above the swing low. The bot then places a short position.
The stop loss and take profit levels are automatically managed once the trade is placed.
Strengths of This Strategy:
Swing Trading Focus: The strategy is ideal for swing traders, targeting longer-term price moves that can take days or weeks to play out.
Simple Yet Effective Indicators: By only relying on Fibonacci retracement levels and basic candlestick patterns, the strategy avoids complexity while capitalizing on well-known support and resistance zones.
Automated Risk Management: The built-in stop loss and take profit mechanism ensures trades are protected, adhering to a strict 2:1 risk/reward ratio.
Multiple Timeframe Analysis: The script adapts to various market conditions by allowing users to switch between different timeframes (4hour, daily, weekly, monthly), giving traders flexibility.
Strategy Use Cases:
Retracement Traders: Traders who focus on entering the market at key retracement levels (0.618 and 0.786) will find this strategy especially useful.
Trend Reversal Traders: The strategy’s reliance on candlestick formations at Fibonacci levels helps traders spot potential reversals in price trends.
Risk Conscious Traders: With its 1% risk per trade and 2:1 risk/reward ratio, the strategy is ideal for traders who prioritize risk management in their trades.

RSI Swing Trading Setup (2-Period)A simple script that adjusts the RSI visibly in order to better accommodate swing trading and certain swing trading setups/strategies.
--------------------------------------------------------------------------------------------------------------------------------------------------------
Best used in conjunction with "Linear Regression Channel by LonesomeTheBlue" with 2.2σ (std.dev) and Show Fib Levels.
^Click image for a redirect to that script.
--------------------------------------------------------------------------------------------------------------------------------------------------------
In certain price action patterns:
A bearish reversal from a previously bullish move can indicate tops of a rally if the RSI moves from 0-40 to 60 (1)
A bullish reversal from a previously bearish move can indicate bottoms of a pullback if the RSI moves from 60-100 to 40 (2)
(USE THE LINEAR REGRESSION CHANNEL TO VALIDIFY THE RETRACEMENTS)
--------------------------------------------------------------------------------------------------------------------------------------------------------
(1)
--------------------------------------------------------------------------------------------------------------------------------------------------------
(2)
--------------------------------------------------------------------------------------------------------------------------------------------------------

DMI Swings (by Coinrule)The Directional Movement Index is a handy indicator that helps catch the direction in which the price of an asset is moving. It compares the prior highs and lows to draw three lines:
Positive directional line (+DI)
Negative directional line (-DI)
Average direction index (ADX)
DMI is simple to interpret. When +DI > - DI, it means the price is trending up. On the other hand, when -DI > +DI, the trend is weak or moving on the downside.
The ADX does not give an indication about the direction but about the strength of the trend.
Typically values of ADX above 25 mean that the trend is steeply moving up or down, based on the -DI and +D positioning. This script aims to capture swings in the DMI, and thus, in the trend of the asset, using a contrarian approach.
ENTRY
-DI is greater than +DI
ADX is greater than 45
EXIT
+DI is greater than -DI
ADX is greater than 45
Trading on high values of ADX, the strategy tries to spot extremely oversold and overbought conditions. Values of ADX above 45 may suggest that the trend has overextended and is may be about to reverse.
Our backtests suggest that this script performs well for very short-term scalping strategies on low time frames, such as the 1-minute.
The script considers a 0.1% trading fee to make results more realistic to those you can expect from live market conditions. So realistically, live results should be similar to backtested results.
You can plug this script directly into your crypto exchange using TradingView Signals on Coinrule.
Trade Safely!

Swing or scalping GOLD [RickAtwood] Swing or scalping - automatically determine the currently active trends. Various moving averages are used. It is also designed for any type of trader from scalping to swing.
The key 3 moving averages are designed to identify support and resistance. If the price bounces off them, boldly open and place a stop of 10-20 pips(currency pairs)
Functional
buy ---> green candles
sell ----> red candles
There are alerts for buy and sell based on crossovers
If the price is above the cloud then buy. If the price is below the cloud then sell. The main thing is to open deals only at the very beginning when the price starts to leave the cloud. Also, your stops will be minimal.
When testing this system, we opened 750 trades manually. Success rate of 71% for currency pairs and for gold
P.s If you have any questions about how to open, how to close deals. Always write to me, I will help you) Success to all.

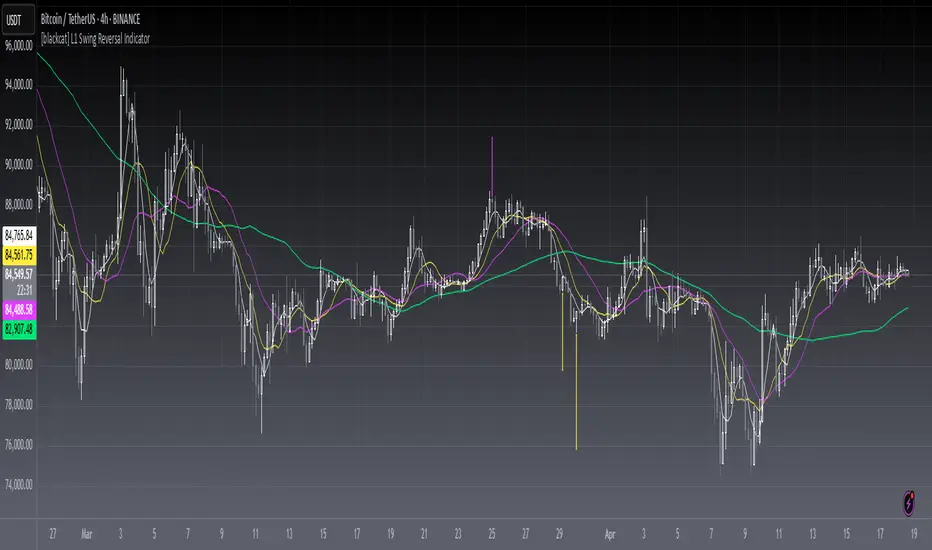
[blackcat] L1 Swing Reversal IndicatorLevel: 1
Background
Many asked me about swing reversal indicators. There are many but less of them can guarantee high win rate. Because market is complex, the reversals can be nested together, which means sub level reversals will be contained in higher level waves. This can be well explained by Elloit wave theory.
Function
Here it is a simple moving average based swing reversal indicator as an example for many others to improve it. Although it simple, it could be very powerful to dedicated trading pairs in specific time frame. One can adjust N1~N4 as SMA peiords from short to long to customized this indicator or even by trying different moving average types to enhance its accuracy.
Key Signal
N1~N4 --> SMA look back periods
OB --> Overbought Threshold
OS --> Oversold Threshold
Pros and Cons
Simpe but powerful. More feedbacks are appreciated.
Remarks
Easy to be customized or integrated to your trading system.
Readme
In real life, I am a prolific inventor. I have successfully applied for more than 60 international and regional patents in the past 12 years. But in the past two years or so, I have tried to transfer my creativity to the development of trading strategies. Tradingview is the ideal platform for me. I am selecting and contributing some of the hundreds of scripts to publish in Tradingview community. Welcome everyone to interact with me to discuss these interesting pine scripts.
The scripts posted are categorized into 5 levels according to my efforts or manhours put into these works.
Level 1 : interesting script snippets or distinctive improvement from classic indicators or strategy. Level 1 scripts can usually appear in more complex indicators as a function module or element.
Level 2 : composite indicator/strategy. By selecting or combining several independent or dependent functions or sub indicators in proper way, the composite script exhibits a resonance phenomenon which can filter out noise or fake trading signal to enhance trading confidence level.
Level 3 : comprehensive indicator/strategy. They are simple trading systems based on my strategies. They are commonly containing several or all of entry signal, close signal, stop loss, take profit, re-entry, risk management, and position sizing techniques. Even some interesting fundamental and mass psychological aspects are incorporated.
Level 4 : script snippets or functions that do not disclose source code. Interesting element that can reveal market laws and work as raw material for indicators and strategies. If you find Level 1~2 scripts are helpful, Level 4 is a private version that took me far more efforts to develop.
Level 5 : indicator/strategy that do not disclose source code. private version of Level 3 script with my accumulated script processing skills or a large number of custom functions. I had a private function library built in past two years. Level 5 scripts use many of them to achieve private trading strategy.
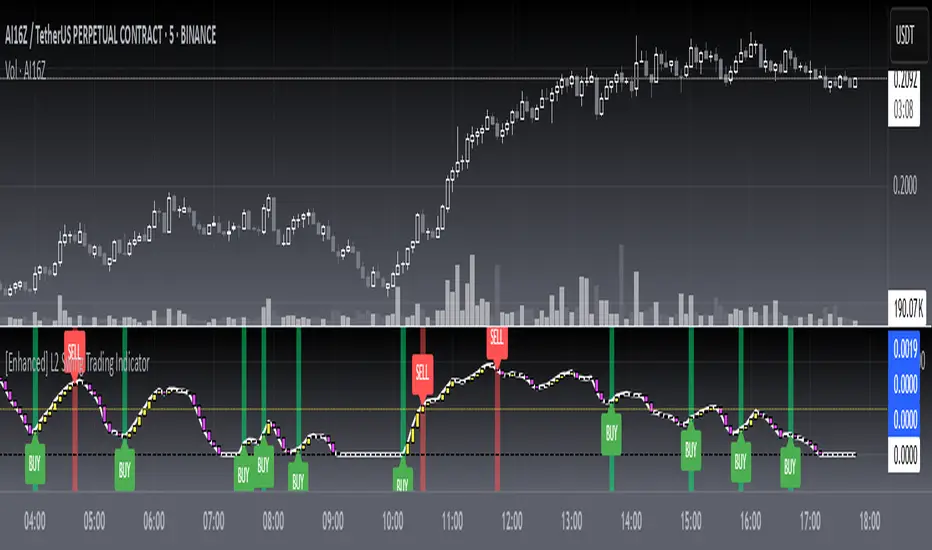
[blackcat] L2 Swing Trading IndicatorLevel: 2
Background
Swing trading is a type of trading aimed at making short to medium term profits from a trading pair over a period of a few days to several weeks. Swing traders mainly use technical analysis to look for trading opportunities. In addition to analyzing price trends and patterns, these traders can also use fundamental analysis.
Function
L2 Swing Trading Indicator
Key Signal
trend --> trend line with color candles standing for trend strength
pump --> whale pump indicator
top --> top zone for selling point
bbuy --> botton zone for buying point
varr1 ---> for selling points
bullbear --> use 50 as bull bear boundary
Pros and Cons
Pros:
1. Clear to see the trend reversals with strength changes
2. Whale pump indicator confirm the validity of trend reversals
Cons:
1. oversold zone is hidden due to using zero line as bottom
Remarks
NA
Readme
In real life, I am a prolific inventor. I have successfully applied for more than 60 international and regional patents in the past 12 years. But in the past two years or so, I have tried to transfer my creativity to the development of trading strategies. Tradingview is the ideal platform for me. I am selecting and contributing some of the hundreds of scripts to publish in Tradingview community. Welcome everyone to interact with me to discuss these interesting pine scripts.
The scripts posted are categorized into 5 levels according to my efforts or manhours put into these works.
Level 1 : interesting script snippets or distinctive improvement from classic indicators or strategy. Level 1 scripts can usually appear in more complex indicators as a function module or element.
Level 2 : composite indicator/strategy. By selecting or combining several independent or dependent functions or sub indicators in proper way, the composite script exhibits a resonance phenomenon which can filter out noise or fake trading signal to enhance trading confidence level.
Level 3 : comprehensive indicator/strategy. They are simple trading systems based on my strategies. They are commonly containing several or all of entry signal, close signal, stop loss, take profit, re-entry, risk management, and position sizing techniques. Even some interesting fundamental and mass psychological aspects are incorporated.
Level 4 : script snippets or functions that do not disclose source code. Interesting element that can reveal market laws and work as raw material for indicators and strategies. If you find Level 1~2 scripts are helpful, Level 4 is a private version that took me far more efforts to develop.
Level 5 : indicator/strategy that do not disclose source code. private version of Level 3 script with my accumulated script processing skills or a large number of custom functions. I had a private function library built in past two years. Level 5 scripts use many of them to achieve private trading strategy.
Gann Swings Trend CounterBased on Rick Santos ' Swing Charts V1 Darvas Box V0.1'
However I have migrated script to pine version 3, customized to suite and added a higher number for the trend count

[RS]Multiple Time Frame Range Swing V0EXPERIMENTAL:
(republishing, previous had alot of lines crowding the chart)
MTF Range Swing.

First 1H Signal on 01-Dec-2025 (BO/PB/RT) + Swing Exit-ARFirst 1H Signal on 01-Dec-2025 (BO/PB/RT) + Swing Exit-AR

Beakdoo swing trading boxHi forks,
I'm trader Baekdoosan who trading Equity from South Korea. This Baekdoo swing trading box indicate good buying position when it crossover the box.
Here's the ideas
1. It needs to crossover 1 month highest value and higher than 5 ema and 20 ema line
2. It also needs to crossover 1 month volume as well
3. Once 1,2 soaring candle emerge, it needs to correction time
4. 5 ema or 20 ema or center candle's 2/3 point x 0.95 (5% lower) would be the resistant line
5. center candle's 2/3 point line would be the buying point (you may can trade when it cross over
you can check above example chart and take a look what you have interested in.
hope this will help your trading on equity as well as crypto. I didn't try it on futures . Best of luck all of you. Gazua~!
Forex SWING TraderThis strategy is mainly designed for swing trading applied to FOREX.
In this case we make use of 2 moving averages but with different time frame, lets say 1h and 1 day.
When they cross above we would initially have a long trade, but in this strategy we trade it in reverse, so we would actually enter a short position.
The same for short trade.
At the same time we make use of hours for entry, so we can filter even better between the trades, and select the best possible hours for entries.
For exit we have 2 conditions : one is when we receive an opposite signal ( by default ).
The other is when a certain movement between moving averages, like lets say 1% of price movement, we will exit. This can act both as TP and SL.
