ALMA TrendlineThis is a simple indicator to make ALMA Trendline to be used as STOP LOSS guidance in trending market. The trendline will change color from GREEN to RED and vice versa once price crossing down or crossing up the trendline.
Tìm kiếm tập lệnh với "trend"

Crypto Volume/Strength ComparatorHello Traders,
Here is an attempt to perform comparative analysis between top cryptos based on strength (oscillator) and volume. Methodology used here is similar to Magic Number formula described in the post : Enhanced Magic Formula for fundamental analysis . But, instead of using fundamentals, we are making use of few technicals to derive similar outcome. Usage of the available stats will not be same as Magic number since we are using technicals.
⬜ Process
▶ Get crypto exchange based on prefix of instrument being used.
▶ For the given exchange, get data for all the tickers available in input fields.
▶ Calculate Oscillator, Momentum based on price for each tickers.
▶ Calculate Oscillator, Momentum based on volume for each tickers.
▶ Calculate Volatility for each tickers.
▶ Rank Price-Oscillator, Price-Momentum, Volume-Oscillator, Volume-Momentum, Volatility for each tickers.
▶ Calculate combined rank by adding up individual ranks.
▶ Calculate movement of rankings from bar to bar
▶ Sort tickers based on rank and populate them on table. Display direction of rankings.
⬜ Components
Display components are as follows:
⬜ Settings
Settings are pretty simple and straightforward
⬜ Calculations
▶ Oscillators : High values of oscillators are considered as ideal as the process is intended towards finding trend.
▶ Momentum : Momentum is calculated on the basis of Squeeze Momentum Indicator by @LazyBear.
▶ Volatility : Volatility is calculated on the basis of Williams Vix Fix by @ChrisMoody. Here too since we are in trend following mode, lower vix fix is considered ideal.
⬜ Few Notes
Tickers will show data only if selected exchange has them. Some tickers are not available in all exchanges. In that case, it will show NAN. This is kind of unavoidable as we need to have fixed size arrays for any calculations.
Indicator works only on crypto tickers which has valid exchange.
Tickers move through the rankings in real time. Background of all stats are based on gradient from green to red.
Tickers on top may not always have better long opportunity or tickers at bottom may not always be optimal for shorting. We need to consider how long the instrument may stay in the position or how fast it is moving in opposite direction. Hence, directions of the ranking movement are also shown on the table.

TrendRangeIdentifier V2This is the enhanced version of TrendRangeIdentifier:
Highlights of this version are:
Different ATR multiplier used based on trend.
Supertrend is used for trend bias for determining which ATR to use on which side
Crossover is based on option selected. It can be either high, low or close price which is determined by crossover type selected.
Remaining parameters remain same as that of original indicator.

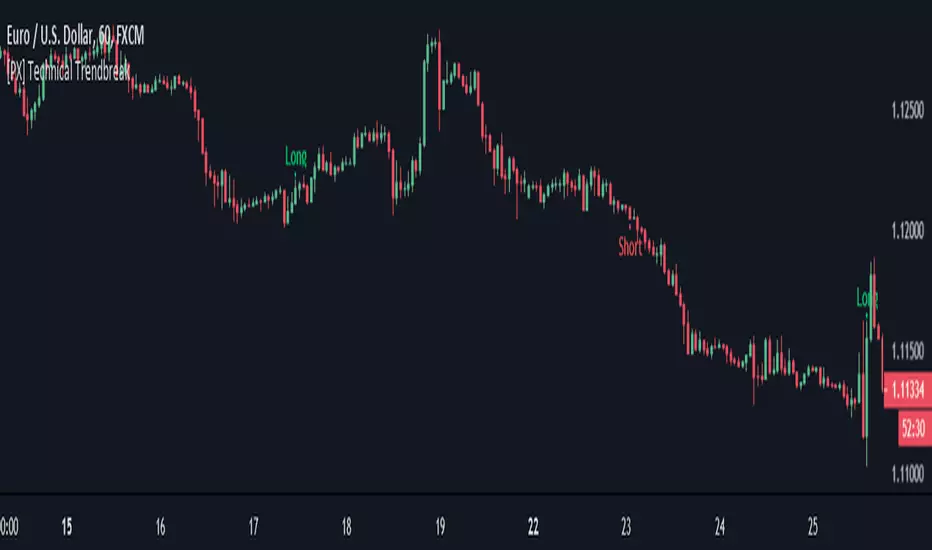
[PX] Technical TrendbreakThis script identifies a technical break of the current trend. Its shows when the swing point before the most recent extreme (high or low) is taken out. The indicator can help you to identify when the current trend is weakening or momentum is slowing down. It is not a standalone script, that you should use for automated trading. It works best when a clear trend is in progress and new extremes are made (such as all-time-high, all-time-low). It should be avoided for sideways movements.
The length parameter determines how many candles should be taken into consideration for calculation of the extremes.
If you are looking for someone to develop your own indicator or trading strategy, don't hesitate to get in touch with me here on TradingView or below.
Contact:
www.pascal-simon.de
info@pascal-simon.de
Multi-Timeframe Trend Table - EMA Based Trend Analysis📊 Stay Aligned with Higher Timeframe Trends While Scalping
This powerful indicator displays real-time trend direction for 1-hour and 4-hour timeframes in a clean, easy-to-read table format. Perfect for traders who want to align their short-term trades with higher timeframe momentum.
🎯 Key Features
Multi-Timeframe Analysis: Monitor 1H and 4H trends while trading on any timeframe (3min, 5min, 15min, etc.)
EMA-Based Logic: Uses proven EMA 50 and EMA 100 crossover methodology
Visual Clarity: Color-coded table with green (uptrend) and red (downtrend) indicators
Customizable Display: Toggle EMA values and adjust table position
Real-Time Updates: Automatically refreshes with each bar close
Lightweight: Minimal resource usage with efficient data requests
📈 How It Works
The indicator determines trend direction using a simple but effective rule:
UPTREND: Price is above both EMA 50 AND EMA 100
DOWNTREND: Price is below either EMA 50 OR EMA 100
🔧 Settings
Show EMA Values: Display actual EMA 50/100 values in the table
Table Position: Choose from 4 corner positions (Top Right, Top Left, Bottom Right, Bottom Left)
Plot Current EMAs: Optional display of EMA lines on your current chart
💡 Trading Applications
✅ Trend Confirmation: Ensure your trades align with higher timeframe direction
✅ Risk Management: Avoid counter-trend trades in strong directional markets
✅ Entry Timing: Use lower timeframe for entries while respecting higher timeframe bias
✅ Scalping Enhancement: Perfect for 1-5 minute scalping with higher timeframe context
🎨 Visual Design
Clean, professional table design
Intuitive color coding (Green = Up, Red = Down)
Compact size that doesn't obstruct your chart
Clear typography for quick reading
📋 Perfect For
Day traders and scalpers
Swing traders seeking trend confirmation
Multi-timeframe analysis enthusiasts
Traders who want simple, effective trend identification
🚀 Easy Setup
Add to any chart (works on all timeframes)
Customize table position and settings
Start trading with higher timeframe awareness
Watch the table update automatically
No complex configurations needed - just add and trade!
This indicator is designed for educational and informational purposes. Always combine with proper risk management and your own analysis.

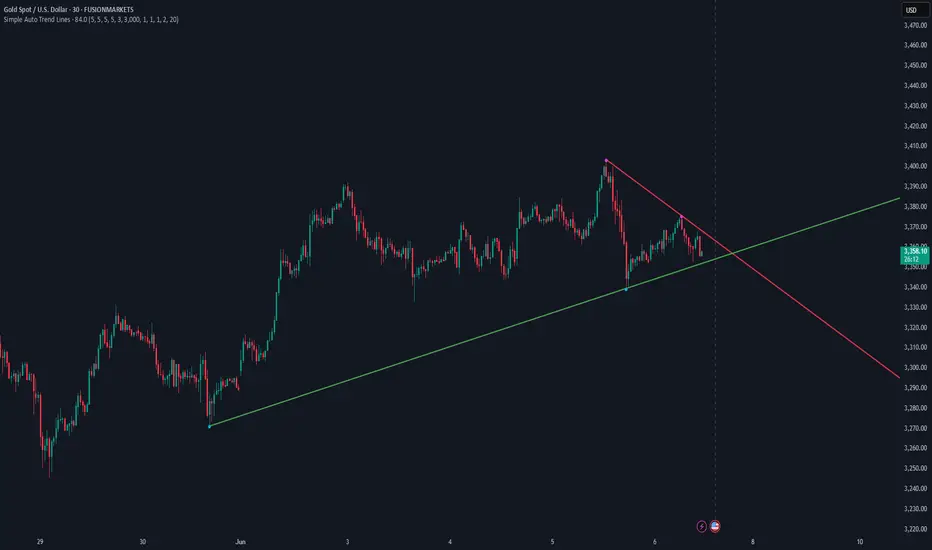
Simple Auto Trend LinesOpinionated way of drawing automatic trend lines. It draws automatically trend lines based on specified top/bottom strengths with multiple sets in order to keep track of multiple levels of interest.
Has the ability to hide invalidated trendlines if price moves away from it.
Donchian Channel Trend Tracker by KellyLikesCrypto### Overview
This indicator is written in Pine Script® (version 6) and is designed to overlay on a price chart. It combines the classic Donchian Channel—a tool popular among trend-following traders—with additional trend-tracking features. By identifying when the channel’s highs and lows are making new extreme values, the indicator helps signal potential trend shifts. It is especially suited for scalpers using 1-hour charts, as it provides clear, actionable signals for rapid entry and exit decisions.
---
### Key Components & Inputs
1. **User Inputs:**
- **Length:** The period over which the indicator calculates the highest high and the lowest low (default is 27 bars). This value can be adjusted to smooth or tighten the channel based on the trader’s preference.
- **Offset:** A parameter allowing the plotted lines to be shifted left or right on the chart, providing flexibility in aligning the indicator with price action.
2. **Donchian Channel Calculations:**
- **Lower Bound (`lower`):** Calculated using `ta.lowest(length)`, it identifies the lowest low over the defined period.
- **Upper Bound (`upper`):** Determined by `ta.highest(length)`, capturing the highest high during the same period.
- **Basis:** The midline of the channel, computed as the average of the upper and lower bounds. This line can serve as an equilibrium or reference point in the trend analysis.
---
### Visual Representation
- **Plotting the Channels:**
- The **basis** is plotted in a standout orange color (#FF6D00) to make the central trend reference easily visible.
- The **upper** and **lower** bounds are plotted in blue (#2962FF), creating clear boundaries for the price action.
- The area between these two lines is filled with a semi-transparent blue, enhancing the visual context of the channel and helping traders quickly assess whether price is near an extreme or within a normal range.
---
### Trend Identification Logic
Beyond plotting the basic Donchian Channel, the indicator introduces additional logic to track short-term trend changes:
1. **Higher Highs and Higher Lows:**
- **Higher High (`higherHigh`):** This condition checks if the current upper bound is greater than the previous bar’s upper bound, signaling a potential upward push.
- **Higher Low (`higherLow`):** Similarly, it checks if the current lower bound exceeds the previous bar’s lower bound, reinforcing an upward trend if the support level is rising.
2. **Lower Highs and Lower Lows:**
- **Lower High (`lowerHigh`):** This evaluates if the current upper bound is less than that of the previous bar, indicating a possible downward shift.
- **Lower Low (`lowerLow`):** It verifies if the current lower bound is lower than the previous bar’s, further confirming a bearish tendency.
The use of the `nz()` function ensures that on the very first bar—where no previous data exists—the code handles the values gracefully without causing errors.
---
### Visual Markers for Trend Signals
To make trend signals immediately apparent:
- **Markers are Plotted on the Chart:**
- **Green Labels ("HH" and "HL"):** These are placed on the chart when the indicator detects higher highs or higher lows, suggesting bullish momentum.
- **Red Labels ("LH" and "LL"):** These markers are shown when lower highs or lower lows are detected, indicating bearish pressure.
Each label is plotted either above or below the corresponding bar, ensuring that the chart remains uncluttered and that the trend signals are clear.
---
### Scalping Strategy on 1-Hour Charts
This indicator is specifically tailored for scalping strategies on 1-hour charts. Scalping involves capturing small, rapid profits from short-term price movements, and the clear trend signals provided by this tool can help traders pinpoint optimal entry and exit points. Here’s how it integrates into a scalping strategy:
- **Quick Trend Identification:** The green markers (HH and HL) suggest bullish conditions ideal for quick long entries, while the red markers (LH and LL) signal bearish conditions suitable for short entries.
- **Timing and Precision:** On a 1-hour chart, the indicator’s sensitivity to higher highs and lower lows allows traders to make rapid decisions aligned with the prevailing trend.
- **Complementary Analysis:** While the indicator provides fast signals, it is recommended to use it alongside additional tools (like oscillators or volume analysis) and strict risk management practices, ensuring that scalpers can confirm entries and exits efficiently.
By leveraging the indicator’s visual cues within a broader scalping framework, traders can enhance their ability to capture quick moves, thus optimizing their overall strategy on 1-hour timeframes.
---
### Conclusion
The “Donchian Channel Trend Tracker by KellyLikesCrypto” is a powerful tool for visualizing price extremes and trend direction. By combining the classical Donchian Channel with additional trend-tracking markers, it offers traders a clear and immediate way to assess whether the market is gaining bullish momentum or beginning to turn bearish. Its customizable parameters and clear visual signals make it particularly effective for a scalping strategy on 1-hour charts, where rapid decision-making is crucial.
This detailed breakdown should provide a comprehensive understanding of how each component of the indicator works together and how it can be effectively integrated into a short-term scalping strategy.

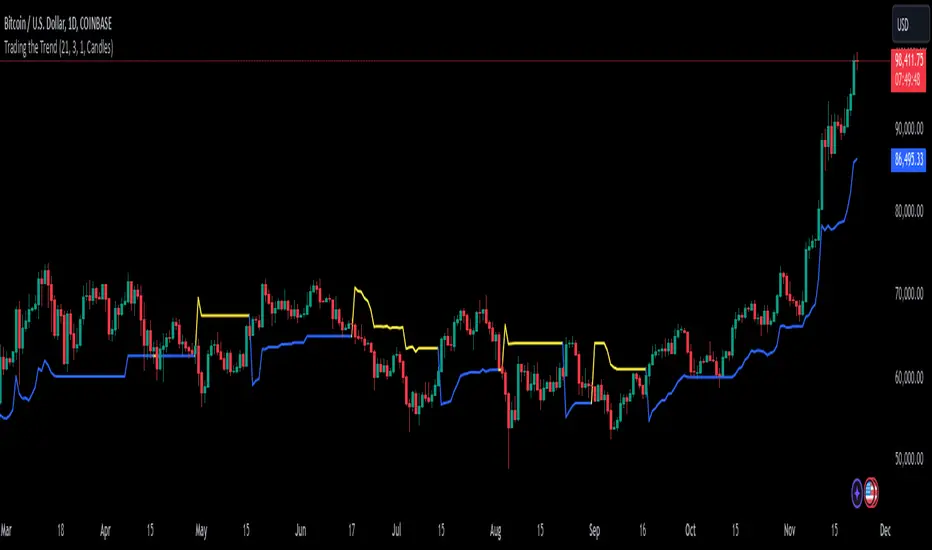
Trading the TrendTrading the Trend Indicator by Andrew Abraham (TASC, 1998)
The Trading the Trend indicator, developed by Andrew Abraham, combines volatility and trend-following principles to identify market direction. It uses a 21-period weighted average of the True Range (ATR) to measure volatility and define uptrends and downtrends.
Calculation: The True Range (highest high minus lowest low) is smoothed using a 21-period weighted moving average. This forms the basis for the trend filter, setting dynamic thresholds for trend identification.
Uptrend: Higher highs are confirmed when price stays above the upper threshold, signaling long opportunities.
Downtrend: Lower lows are identified when price stays below the lower threshold, favoring short positions.
This system emphasizes trading only in the direction of the prevailing trend, filtering out market noise and focusing on sustained price movements.
The trendline changes her color. When there is an uptrend the trendline is blue and when the trend is downward the trendline is yellow.
Coins Trend Tracker HTThe Coins Trend Tracker HT script provides a powerful tool for monitoring and comparing the trend signals of multiple cryptocurrencies based on their Exponential Moving Averages (EMAs). This script is particularly useful for traders who want to keep track of multiple coins across different timeframes and identify potential trading opportunities based on EMA crossovers.
Features:
Customizable Coin Selection: Users can select up to four different cryptocurrencies to monitor.
Flexible Timeframes: Users can choose two different timeframes for EMA calculations to suit their trading strategies.
Visual Trend Indicators: The script displays trend indicators (🚀 for bullish and 💀 for bearish) based on the EMA crossover status for each coin and timeframe.
Conditional Cell Coloring: Table cells are color-coded based on the EMA crossover conditions, helping users quickly identify bullish or bearish trends.
Opacity Control: Users can adjust the opacity of the table cell colors for better visualization on the chart.
How It Works:
Coin Selection: Users can select up to four different cryptocurrencies to monitor by entering their ticker symbols.
Timeframe Selection: Users can select two different timeframes for the EMA calculations. The script calculates the 5-period and 20-period EMAs for each coin and timeframe.
EMA Crossovers: The script checks for EMA crossovers (EMA 5 crossing above or below EMA 20) and updates the trend indicators and cell colors accordingly.
Table Display: The script displays a table with the selected coins, their current prices, and trend indicators for the chosen timeframes. The background color of the table cells changes based on the EMA crossover status.
Script Logic:
The get_price function retrieves the latest price of the selected coin for the specified timeframe.
The get_ema_cross function calculates the 5-period and 20-period EMAs and checks for crossover conditions.
The fill_row function populates the table with the coin data, trend indicators, and conditionally colored cells.
The table header and data rows are updated based on the user-selected coins, timeframes, and EMA crossover conditions.
Usage:
Add the script to your TradingView chart.
Customize the coin selection, timeframes, text color, default cell color, bullish and bearish cross colors, and cell opacity through the input settings.
The script will display a table with the selected coins, their current prices, and trend indicators based on the EMA crossovers for the chosen timeframes.

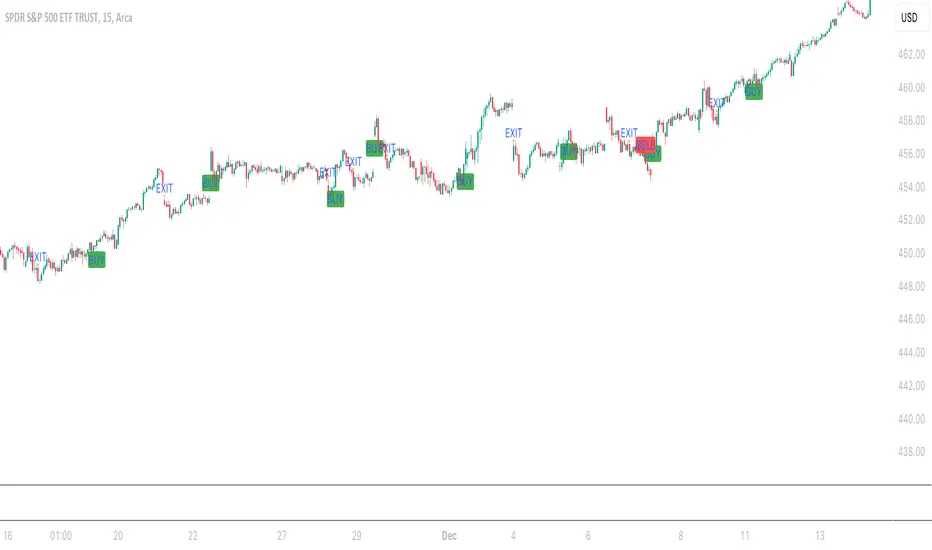
Aleem Trend Supertrend EMA Title: "Supertrend and 200 EMA Crossover Strategy"
Description:
This script is designed to provide traders with a robust and original trading strategy by combining the Supertrend indicator with a 200-period Exponential Moving Average (EMA). The core concept is to utilize the strengths of both indicators to determine optimal entry and exit points.
The Supertrend indicator is well-regarded for its precision in signaling trend reversals by considering the volatility of the market, as measured by the Average True Range (ATR). It is particularly useful for identifying ongoing trends and potential reversals.
The 200 EMA is a widely-used indicator that many traders look to as a determinant of the long-term trend. When the price is above the 200 EMA, the overall market sentiment is considered bullish, and when below, bearish.
By combining these two, the script generates a Buy signal under the following conditions:
When the Supertrend turns bullish (color changes from red to green) with the closing price above the 200 EMA, or
When the price crosses above the 200 EMA while the Supertrend is already green.
A Sell signal is generated when:
The Supertrend turns bearish (color changes from green to red) with the closing price below the 200 EMA, or
The price crosses below the 200 EMA while the Supertrend is already red.
To avoid repetitive signals and to maintain clarity, the script has been enhanced with a feature to prevent multiple consecutive Buy or Sell signals. Once a Buy or Sell signal is generated, the script will not produce another identical signal until an opposing signal or an exit condition is met.
Exit signals for both Buy and Sell positions are provided to indicate when the trend is weakening or reversing, based on the Supertrend's color change in relation to the 200 EMA.
This strategy is flexible and can be utilized across various time frames and asset classes. It aims to aid traders in making more informed decisions by highlighting potential reversals and continuations in the market trend.
Usage:
To use this script, traders should observe the Buy and Sell signals as potential entry points. Exit signals should be taken as prompts to close positions or to protect profits with stop-loss adjustments. As with all strategies, it's recommended to use this in conjunction with other analysis methods and to backtest thoroughly before live implementation.
Multi-Timeframe Trend TableThis is the first publication of an indicator to show trend on the higher timeframes and is an English version of the "Mtf Supertrend Table" coded by FxTraderProAsistan. Credit goes to him for the genesis of this work. I updated the original code to Pinescript V.5 and modified it to suit my needs. Please enjoy.
This trend table indicator has the following features:
1. Trend Mode : Option to select the method of determining trend, using the Pinescript built-in ta.supertrend function or finding trend based on the cross of 20 and 50 EMA
2. 6 trend timeframes of your choosing, with show/hide
3. Optional feature to include the DXY (US dollar) trends, for the timeframes chosen. Useful for instruments that react to changes in the US dollar
4. ATR settings to adjust the Supertrend parameters. Default values are an ATR length of 10 and a Factor of 3

Pivot TrendLine with typeIntro
The simplest version of the indicator automatically draws trendLine on your charts, with newest Type syntax.
Type is some thing like type or interface in typescript or Structure in Clang.
with type key word you can write more clear code in pinescript.
Usage
You can change the looking back length settings to get more proper lines you want.
There is also a switch to turn off the historical trendlines .
You can use this to build more advanced indicators or strategies.
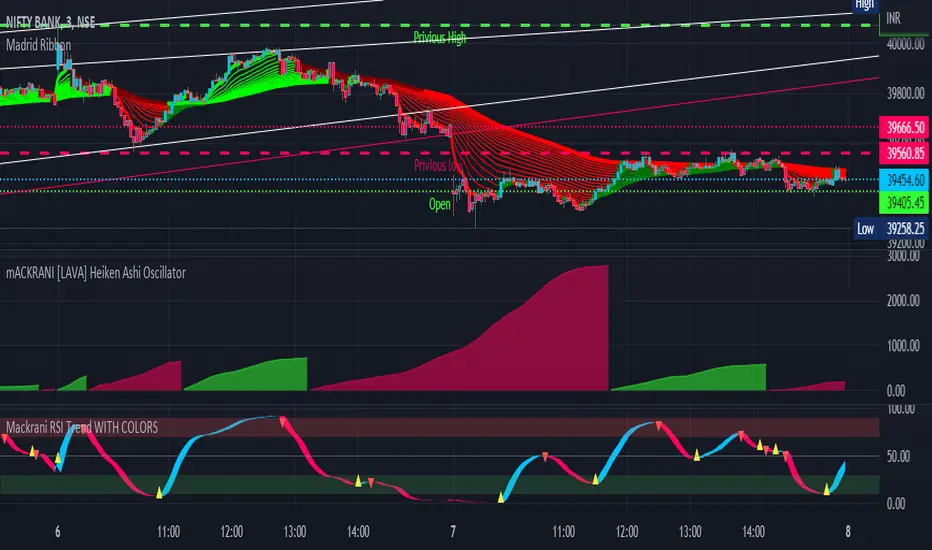
Mackrani RSI Trend WITH COLORSMACKRANI RSI WITH COLORS
Hull Trend is a hybrid indicator with RSI of HULL Signal. The Hull MA is combined with RSI to see if the Hull MA Buy/Sell Signal is in overbought or oversold condition. Buy Sell Signals are plotted based on settings of OB/OS or RSI .
This indicator is very useful to see if the Trend is in Exhaustion or Beginning of a Trend. Entry and Exit conditions can be more precise based on OB/OS condition of price action. In addition normal RSI trend is plotted with trend color from Hull MA. Best Performance with Heiken Ashi Candle
:- OB/OS Settings provided
:- Hull Buy/Sell Signals plotted
:- Double RSI FAST and DEFAULT signal with crossover
:- Bar Color applied based on Hull RSI Trend
:- Hull Trend + RSI + Price Action
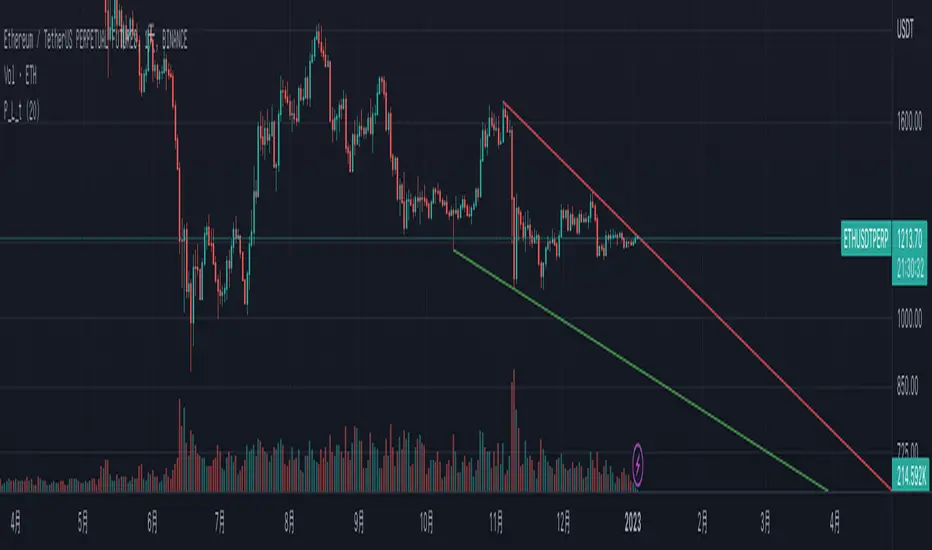
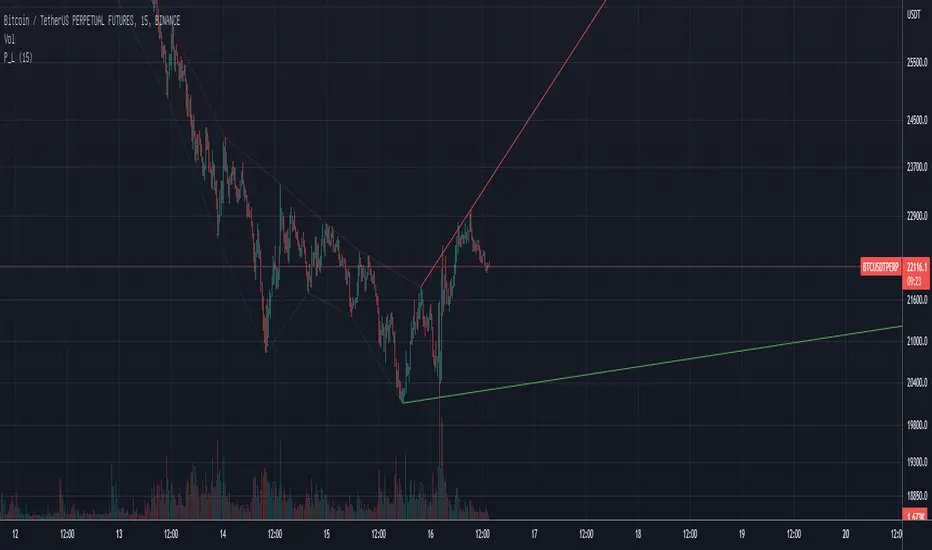
Pivot TrendLineThe simplest version of the indicator automatically draws trendLine on your charts, with build-in functions only.
You can change the looking back length settings to get more proper lines you want.
There is also a switch to turn off the historical trendlines.
You can use this to build more advanced indicators or strategies.
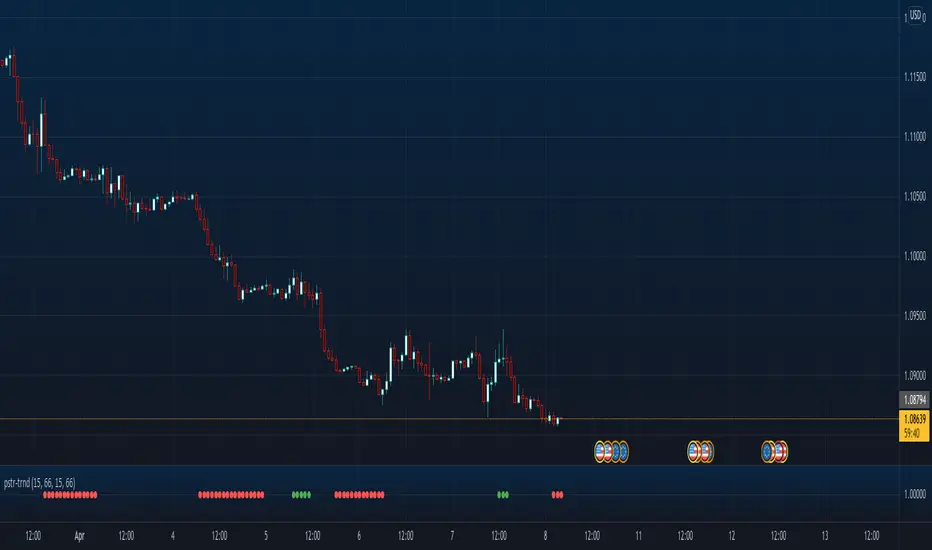
Poster Trend AnalysisThis trend analysis indicator is an idea from:
Stocks & Commodities V. 40:03 (8–12): Intraday Patterns Of Price Change by Richard Poster, PhD
We decide an uptrend or downtrend is in play, if there are certain percentage of bars across N bars where the direction is the same. The default settings use what the article says, 66% of adjacent 15 bars must be in the same direction, to be trending. While the article isn't precise about what up or down bars mean, this indicator assumes an up direction if close is greater than the open.
The indicator also allows differing configurations for up and downtrend analysis, though the defaults, as per the article, are the same.
Volatility Percentile🎲 Volatility is an important measure to be included in trading plan and strategy. Strategies have varied outcome based on volatility of the instruments in hand.
For example,
🚩 Trend following strategies work better on low volatility instruments and reversal patterns work better in high volatility instruments. It is also important for us to understand the median volatility of an instrument before applying particular strategy strategy on them.
🚩 Different instrument will have different volatility range. For instance crypto currencies have higher volatility whereas major currency pairs have lower volatility with respect to their price. It is also important for us to understand if the current volatility of the instrument is relatively higher or lower based on the historical values.
This indicator is created to study and understand more about volatility of the instruments.
⬜ Process
▶ Volatility metric used here is ATR as percentage of price. Other things such as bollinger bandwidth etc can also be used with few changes.
▶ We use array based counters to count ATR values in different range. For example, if we are measuring ATR range based on precision 2, we will use array containing 10000 values all initially set to 0 which act as 10000 buckets to hold counters of different range. But, based on the ATR percentage range, they will be incremented. Let's say, if atr percent is 2, then 200th element of the array is increased by 1.
▶ When we do this for every bar, we have array of counters which has the division on how many bars had what range of atr percent.
▶ Using this array, we can calculate how many bars had atr percent more than current value, how many had less than current value, and how many bars in history has same atr percent as current value.
▶ With these information, we can calculate the percentile of atr percentage value. We can also plot a detailed table mentioning what percentile each range map to.
⬜ Settings
▶ ATR Parameters - this include Moving average type and Length for atr calculation.
▶ Rounding type refers to rounding ATR percentage value before we put into certain bucket. For example, if ATR percentage 2.7, round or ceil will make it 3, whereas floor will make it 2 which may fall into different buckets based on the precision selected.
▶ Precision refers to how much detailed the range should be. If precision set to 0, then we get array of 100 to collect the range where each value will represent a range of 1%. Similarly precision of 1 will lead to array of 1000 with each item representing range of 0.1. Default value used is 2 which is also the max precision possible in this script. This means, we use array of 10000 to track the range and percentile of the ATR.
▶ Display Settings - Inverse when applied track percentile with respect to lowest value of ATR instead of high. By default this is set to false. Other two options allow users to enable stats table. When detailed stats are enabled, ATR Percentile as plot is hidden.
▶ Table Settings - Allows users to select set size and coloring options.
▶ Indicator Time Window - Allow users to select particular timeframe instead of all available bars to run the study. By default windows are disabled. Users can chose start and end time individually.
Indicator display components can be described as below:

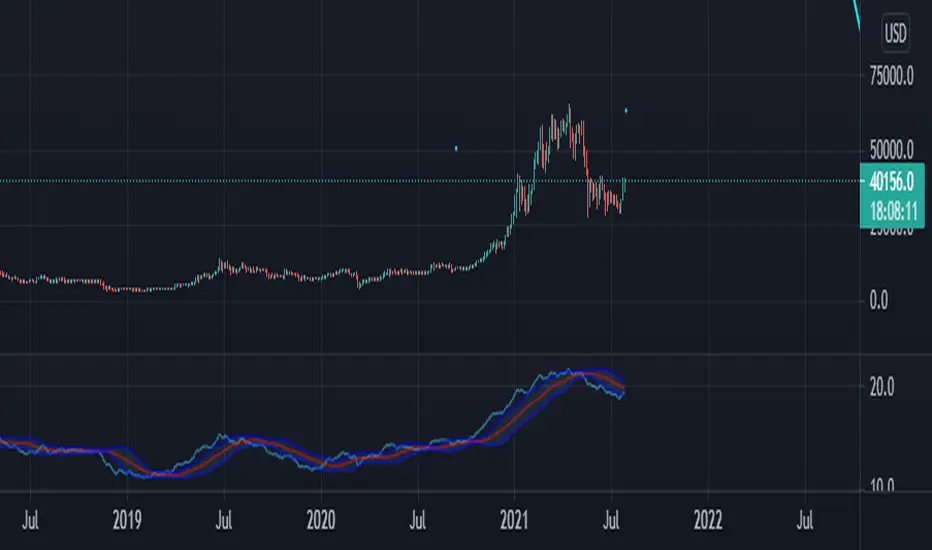
Currency Strength Meter [HeWhoMustNotBeNamed]⬜ Note: This is not the strength of currency pairs. But, in this script we are trying to derive strength of individual currencies by matching against single base currency.
⬜ Process
This is based on similar concept as that of Magic Numbers for stocks. Idea is simple.
▶ Calculate strength of each currency against USD. Derive the strength for both price movement and volume movement.
▶ Similarly calculate momentum of price and volume change.
▶ If USD is base currency, inverse momentum and strength index for the given symbol.
▶ Once these calculations are done, rank each currencies based on individual score on given things.
▶ Add up all the ranks to derive combined rank
▶ sort the currencies in the ascending order of overall rank.
⬜ USAGE
▶ Identify a base currency. In our case, we have used USD as base currency as it is easy to get pairs of all currencies with USD.
▶ Identify most used combos for all other currencies which are paired with USD. Fx pair can either have USD as base currency or quote currency. It is desirable to use the pair which is most traded. For example, USDJPY is more traded pair than JPYUSD - hence it is advisable to use USDJPY instead of JPYUSD. Similarly AUDUSD is more traded than USDAUD - hence choosing AUDUSD for the purpose of this exercise is better approach. Notice that USDJPY has USD as base currency whereas AUDUSD has USD as quote currency. These calculations are handled internally to derive the right outcome irrespective of position of USD in the pair.
▶ Identify the forex broker which has all the selected forex tickers. All comparison is done against a single broker. Hence, choosing broker which does not wide range of forex pairs will show NAN for many rows.
▶ Once we set these, we get tabular output containing strength and oscillator based trend indexes for both price and volume indicator. Currencies are ordered in descending order of strength. Hence, top of the list can be considered as currency having highest strength and bottom of the table can be considered as currency having lowest strength. Please note that the calculation is valid only for selected timeframe and users can set other parameters such as moving average type, oscillator type, length etc which can alter the outcome.
▶ Use multiple timeframes to find out stronger and weaker currencies. Use directional indicators to understand where they are heading. Combine all these info to come up with currency pair you would like to trade :)
⬜ Settings
▶ Main settings and Currencies
Base Currency : This is set to USD by default as rest of the tickers used are paired with USD. Whatever the base currency is selected, rest of the tickers should follow the same combination.
Timeframe : Timeframe for which rankings need to be calculated.
Currencies : These should be the currency pair which involve base currency defined in the setting on either side.
▶ Display
Table : Allows users to set table location and size of the table. By default this is set to middle center and default size is normal. If user want to use multiple timeframes side by side, they can do so by changing these display settings.
Stat Type : To show either comparative ranking or actual indicator values

Inverse Divergence [HeWhoMustNotBeNamed]Experimental.
In regular scenario divergence calculation follows these procedure
Pivots on price are considered as primary source
They are compared with pivots on oscillators
Trend bias of price is used
This is an experimental version where
Pivots on oscillators are considered as primary source
They are compared with pivots on price
Trend bias of oscillator is used. Using percentrank to define oscillator trend
Caution: Not meant for trading :)

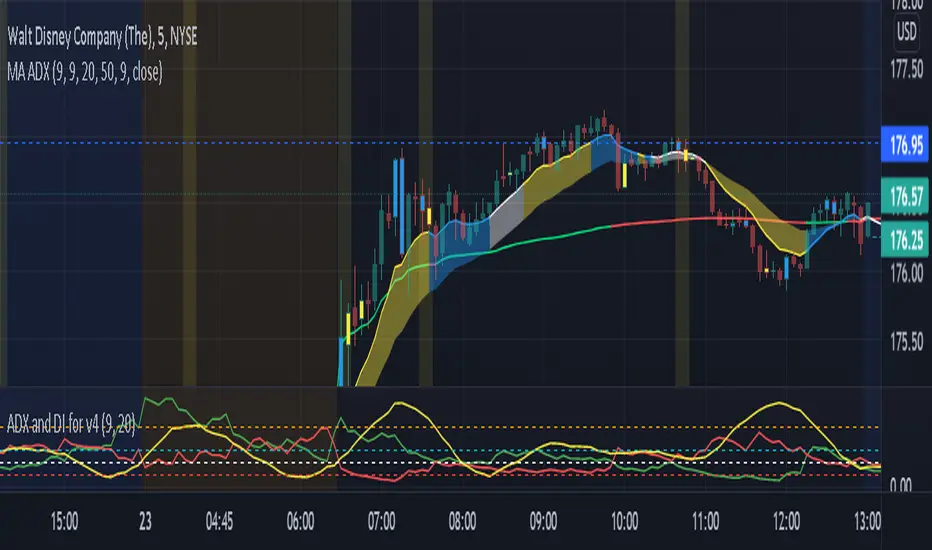
ADX and DI EMA Trend LineADX: The average directional index (ADX) is a technical analysis indicator used by some traders to determine the strength of a trend.
DI: The directional movement index (DMI) is an indicator developed by J. Welles Wilder in 1978 that identifies in which direction the price of an asset is moving. ... Conversely, if -DI is above +DI, then there is more downward pressure on the price. This indicator may help traders assess the trend direction.
EMA: The exponential moving average (EMA) is a technical chart indicator that tracks the price of an investment (like a stock or commodity) over time. The EMA is a type of weighted moving average (WMA) that gives more weighting or importance to recent price data.
UPDATE: This current indicator has been changed from MA and EMA trend lines the 9 and the 50, and also added Inside & Outside bars...You can toggle anything Off or On
The code in this indicator calculates the value of each ADX and DI (+/-) value to give a green color for DI + trend and a red color for DI - trend, and lastly white for no direction...The nice part of this code is the 50 EMA will be your bull or bear transition level. The colors heading to the ema will tell you if we are still bull or bear heading to the EMA.
I also changed the ADX to become the 9 EMA with Yellow showing a ADX positive rate of change, Blue showing a negative rate of change, and white to show that the trend has no direction.
Open settings to adjust how big or small you want the ema lines to be and adjust colors for what works for you. Hopefully you enjoy this update
Multilevel ZigZag SupertrendVery much similar to :
I have slightly changed code to accommodate multiple zigzags. Also removed possibility of external source to keep it simple.
Indicator shows 2 Level zigzag based supertrends. Second zigzag used is multi level zigzag and hence, this acts as higher timeframe filter and can be considered as overall trend bias.
Price Adjusted ADX Trend IdentifierUsed to identify trend by applying advance decline formula directly to price action. The result is smoothed activity that incorporates trend strength so that minor pullbacks and consolidation that result from large moves do not cloud the overall trend of the chart. Also sideways action will identify the end of a trend sooner by incorporating the shrinking advance decline activity into price action.
The value is less important than the trend identification against the shown imbedded Bollinger band.
The script allows for advance decline length to be adjusted. Set at 2. Longer will be less reactive shorter will be more reactive.
I have not traded this indicator but it may be useful in identifying smoother trends. Possibly using the cross of the ADX line against the Bollinger upper/lower/mid lines.
Enjoy.
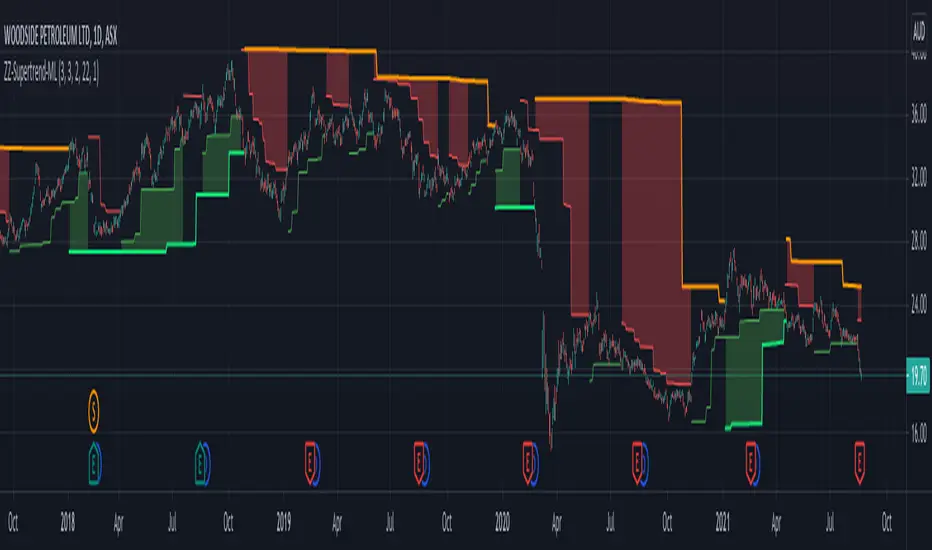
ZigZag SupertrendBack to my favourite supertrend. But, this time on the basis of zigzag pivots.
This is similar to forming supertrend based on pivot high lows - but instead of using pivot poitns, we are using zigzag pivots here.
Zigzag is derived using the same method as this script:
But, have removed labels and display options of zigzag. Older lines are also immediately deleted so that it can work well in lower timeframes without any error. Number of zigzaglines to be kept in memory depends on the parameter History
WaitForConfirmation option when selected only considers the confirmed zigzaglines and will ignore present zigzag line which is forming. This is not going to make much difference as the present zigzag line will be always opposite to low or high it formed and hence will not affect the stop loss levels or reversals.
WaitForClose is for supertrend determination. When checked uses close prices. If unchecked uses highs and lows for supertrend direction update.
ATR parameters allow you to set an adjustment below pivot high lows. This is required because support and resistence are often zones rather than single point. Hence, adds bit more wiggle room for trend continuation and delays frequent reversals on pullbacks.

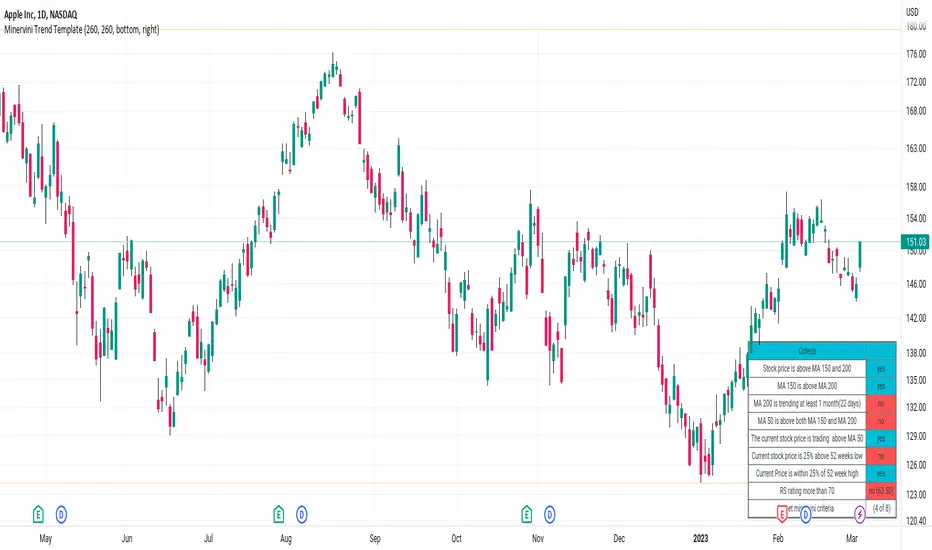
Minervini Trend TemplateMinervini Trend Template
1. Stock price is above MA 150 and 200
2. MA 150 is above MA 200
3. MA 200 is trending at least 1 month(22 days)
4. MA 50 is above both MA 150 and MA 200
5. Current stock price is 25% above 52 weeks low
6. Current Price is within 25% of 52 week high
7. RS Ratings