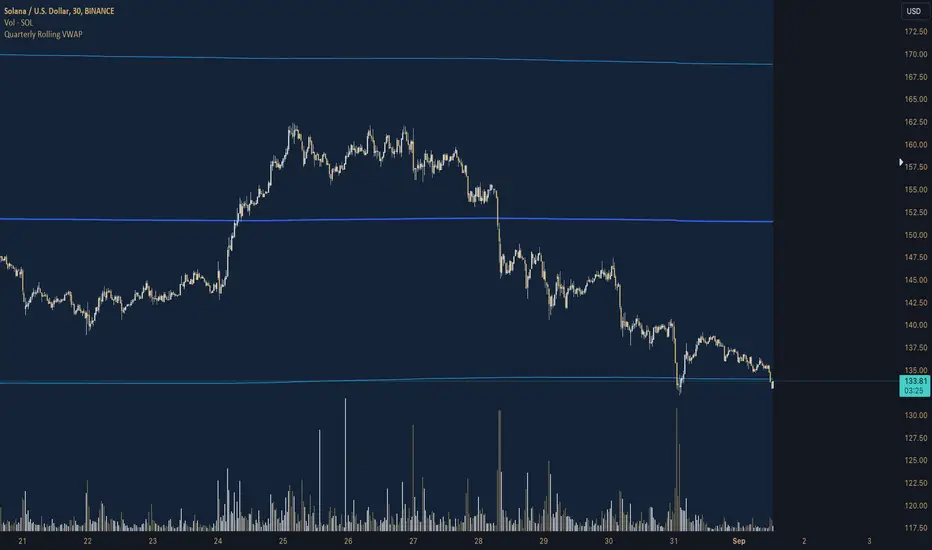
Quarterly Rolling VWAP# Quarterly Rolling VWAP Indicator
This custom indicator calculates and displays a Volume-Weighted Average Price (VWAP) that resets at the beginning of each quarter, providing traders with a medium-term perspective on price action relative to trading volume.
## Key Features:
1. **Quarterly Reset**: The VWAP calculation automatically resets at the beginning of each quarter, allowing for a rolling analysis that adapts to changing market conditions.
2. **Standard Deviation Bands**: The indicator includes two sets of bands based on standard deviations from the VWAP, helping to identify potential support and resistance levels.
3. **Customizable Appearance**: Users can adjust the colors of the VWAP line and bands, as well as control the visibility and transparency of the bands.
4. **Flexible Band Multipliers**: The distance of the bands from the VWAP can be adjusted using customizable multipliers.
## Indicator Logic:
1. **Quarterly Detection**:
- The script uses a function `isNewQuarter()` to determine the start of a new quarter.
- It calculates the timestamp for the start of the current quarter and checks for changes in this value.
2. **VWAP Calculation**:
- The `calcVWAP()` function computes the Volume-Weighted Average Price.
- It maintains running sums of price * volume and volume, which reset at the start of each quarter.
- The VWAP is calculated as the ratio of these sums.
3. **Standard Deviation Calculation**:
- The `calcStdDev()` function computes the standard deviation of price from the VWAP.
- It uses a similar approach to VWAP, maintaining running sums that reset quarterly.
4. **Band Calculation**:
- Two sets of bands are calculated using the VWAP, standard deviation, and user-defined multipliers.
- Upper and lower bands are plotted at 1x and 2x the standard deviation by default, but these are customizable.
5. **Plotting**:
- The main VWAP line is plotted with user-defined color and width.
- Bands are plotted conditionally based on user preference.
- The area between bands is filled with a semi-transparent color for better visualization.
## Trading Applications:
- **Medium-Term Trend Analysis**: The quarterly VWAP provides a broader perspective on price trends compared to daily or weekly VWAPs.
- **Support and Resistance**: The VWAP line and bands can act as dynamic support and resistance levels.
- **Mean Reversion Strategies**: Traders can look for potential reversals when price reaches the outer bands.
- **Volatility Assessment**: The width of the bands gives an indication of recent price volatility relative to volume.
- **Quarter-over-Quarter Comparison**: By resetting each quarter, the indicator allows for easy comparison of price action across different quarters.
This Quarterly Rolling VWAP indicator is particularly useful for traders focusing on medium-term strategies or those who want to incorporate a broader market context into their analysis. It combines the power of volume-weighted pricing with a quarterly perspective, offering a unique tool for technical analysis
Tìm kiếm tập lệnh với "vwap"
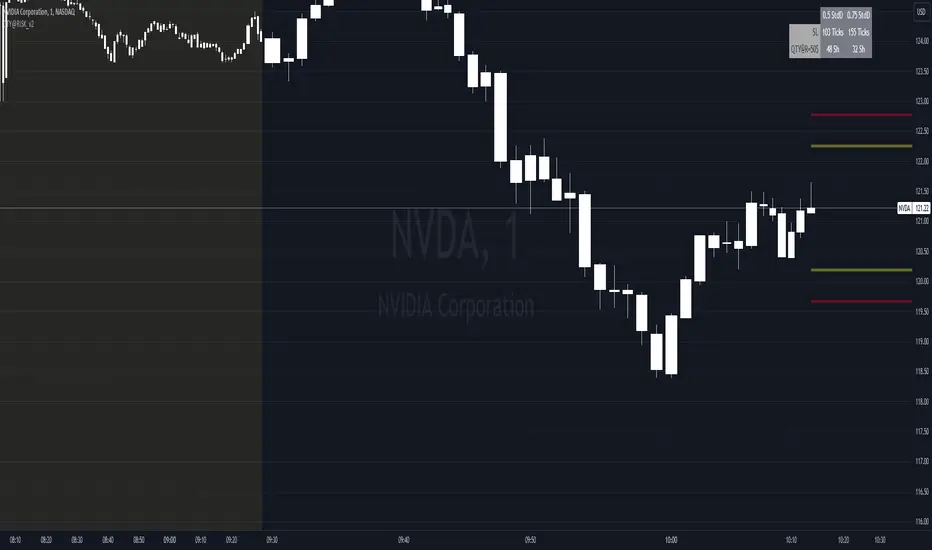
QTY@RISK VWAP based calculationVWAP Volatility-Based Risk Management Calculator for Intraday Trading
Overview
This script is an innovative tool designed to help traders manage risk effectively by calculating position sizes and stop-loss levels using the Volume Weighted Average Price (VWAP) and its standard deviation (StdDev). Unlike traditional methods that rely on time-based calculations, this approach is time-independent within the intraday timeframe, making it particularly useful for traders seeking precision and efficiency.
Key Concepts
VWAP (Volume Weighted Average Price): VWAP is a trading benchmark that represents the average price a security has traded at throughout the day, based on both volume and price. It provides insight into the average price level over a specific period, helping traders understand the market trend.
StdDev (Standard Deviation): In the context of VWAP, the standard deviation measures the volatility around the VWAP. It provides a quantifiable range that traders can use to set stop-loss levels, ensuring they are neither too tight nor too loose.
How the Script Works
1. VWAP Calculation: The script calculates the VWAP continuously as the market trades, integrating both price and volume data.
2. Volatility Measurement: It then computes the standard deviation of the VWAP, giving a measure of market volatility.
3. Stop-Loss Calculation: Using user-defined StdDev factors, the script calculates two stop-loss levels. These levels adjust dynamically based on market conditions, ensuring they remain relevant throughout the trading session.
4. Position Sizing: By incorporating your risk tolerance, the script determines the appropriate position size. This ensures that your maximum loss per trade does not exceed your predefined risk value.
How to Use the Calculator
1. Select Two VWAP StdDev Factors: Choose two standard deviation factors for calculating stop-loss levels. For example, you might choose 0.5 and 0.75 to set conservative and aggressive stop-losses respectively.
2. Set Your Trading Account Size: Enter your total trading capital. For example, $50,000.
3. Maximum Lot Size: Define the maximum number of shares you are willing to trade in a single position. For instance, 200 shares.
4. Risk Value per Trade: Input the maximum amount of money you are willing to risk on a single trade. For instance, $50.
5. Plotting Options: If you wish to visualize the stop-loss levels, enable the plot option and choose the price base for the plot, such as the closing price or the average of the high and low prices (hl2).
Example of Use
1. Initial Setup: After the market opens, wait for at least 15 minutes to ensure the VWAP has stabilized with sufficient volume data.
2. Parameter Configuration: Input your desired parameters into the calculator. For instance:
- VWAP StdDev Factors: 0.5 and 0.75
- Trading Account Size: $50,000
- Maximum Lot Size: 200 shares
- Risk Value per Trade: $50
- Plot Option: On, using "hl2" or "close" as the price base
3. Execution: Based on the inputs, the script calculates the position size and stop-loss levels. If the calculated stop-loss falls within the selected VWAP StdDev range, it will provide you with precise stop-loss prices.
4. Trading: Use the calculated position size and stop-loss levels to execute your trades confidently, knowing that your risk is managed effectively.
Advantages for Traders
- Time Independence: By relying on VWAP and its StdDev, the calculations are not dependent on specific time intervals, making them more adaptable to real-time trading conditions.
- Focus on Strategy: Novice traders can focus more on their trading strategies rather than getting bogged down with complex calculations.
- Dynamic Adjustments: The script adjusts stop-loss levels dynamically based on evolving market conditions, providing more accurate and relevant risk management.
- Flexibility: Traders can tailor the calculator to their risk preferences and trading style by adjusting the StdDev factors and risk parameters.
By incorporating these concepts and using this risk management calculator, traders can enhance their trading efficiency, improve their risk management, and ultimately make more informed trading decisions.
Aggregated VWAP by AncheAbout this indicator
Aggregated VWAP shows you a combined VWAP of different assets which you can choose inside the options panel.
This allows you to select the same asset from multiple exchanges and the indicator plots a VWAP based on all the prices of the selected tickers.
The above image shows you the VWAP of the current asset (red, thick line) and an Aggregated VWAP of BTCUSD from this exchange + 5 others (black line). This clearly shows a discrepancy between both values.
How to use
Open the options of the indicator, at the bottom you will find 5 input fields to select 5 tickers. This allows you to select your asset from different exchanges so that their value gets computed inside the value for the Aggregated VWAP.
Inside the "style" settings you can change colors, lines, etc.

RTH & ETH VWAPs (Unified Style)AVWAP indicator showing only the current session. Shows ETH VWAP even when RTH is turned on. Has standard deviation and fills for settings.

SMA VWAP BANDS [qrsq]Description
This indicator is used to find support and resistance utilizing both SMA and VWAP. It can be used on lower and higher time frames to understand where price is likely to reject or bounce.
How it works
Rather than using the usual calculation for the VWAP, instead this script smooths the volume first with the SMA and then respectively calculates the smoothed multiplication of high, low and close price with the volume individually. These values are then divided by the smoothed volume to find individual VWAP's for each of the sources. The standard deviations of these are calculated, resulting in an upper, lower and middle band. It is essentially VWAP bands with some smoothed calculations in the middle.
How to use it
I like to use the bands for LTF scalping as well as HTF swings.
For scalping:
I tend to use either the 5m or 15m TF
I then set the indicator's TF to 1m
I will take a scalp based on the bands confluence with other PA methods, if price is being either supported or rejected.
For swings:
I tend to use a variety of TFs, including: 30m, 1H, 4H, D
I then set the indicator's TF to "Chart"
I will take a swing based on the bands confluence with other PA methods, if price is being either supported or rejected.
I also tend to use them on perpetual contracts as the volume seems to be more consistent and hence results in more accurate support and resistance.

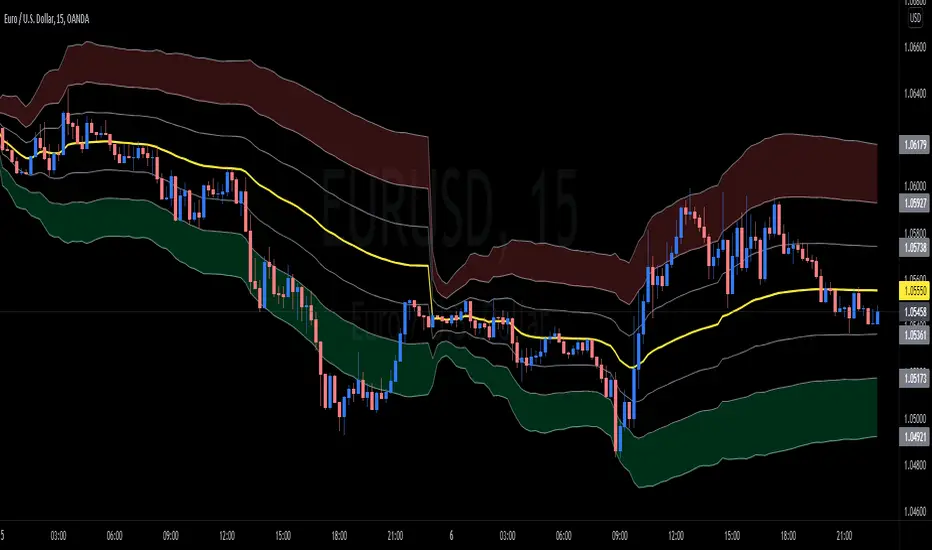
wnG - VWAP MOD Modified version of VWAP :
Classic VWAP with 6 levels based on the Average True Range to identify the distance and distribution of the prices around the VWAP.
There are 2 calcul methodologies for the bands
- Last 24 Hours Average True Range
- Progressive Average True Range starting from 00:00
As prices tend to move around the VWAP level, favor LONG positions in the GREEN ZONE (and SHORT in the RED ZONE).
How to use it :
Avoid taking long position when price is in the RED ZONE
Avoid taking short position when price is in the GREEN ZONE
==> Adjust the settings depending on your timeframe and asset
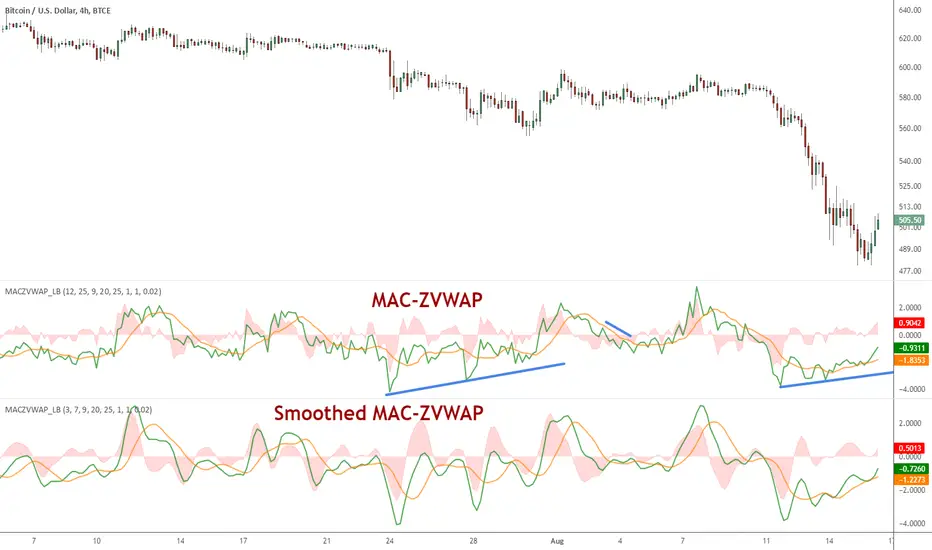
MAC-Z VWAP Indicator [LazyBear]This a modified MAC-Z using Z-VWAP. Since this uses VWAP, the signals are derived indirectly from both volume and price action.
I have also included a way to smooth MACZ-VWAP, you can enable it via options page.
Note that this will not work on any FX pair, as volume is not available.
Referenced indicators:
Z-distance from VWAP:
MAC-Z Indicator:
Z-Score:
Complete list of my indicators:
GDoc: docs.google.com
Chart:
Dual Session VWAPSeparate VWAP with 1 standard deviation band for the regular session as well as electronic session

Chart Champions - Part 1 - nPOC - Levels - VWAPsThank you for sparing you time to read my indicator.
This indicator has been created as a suite of 3. This was to ensure that those with only the Free Trading View account could benefit (with their restriction to 3 indicators). Please ensure you install each indicator and read each indicator write up to fully understand what has tried to achieved.
Chart Champions – Part 1 –Lvls nPOC VWAPS
This indicator is broken down into:
• Levels
• VWAPS
• Naked Point of Control
Levels
It displays the levels to the right of the price Axis to enable the user to have a cleaner chart.
The below levels will automatically appear:
dOpen – pdHigh – pdLow – pdEQ – pwEQ
Optional Levels include:
mOpen – pmOpen – pdOpen – dbyOpen – wOpen – pwOpen
VWAPs
Optional VWAPs
Daily (including pdVWAP close) – Weekly – Monthly
Naked Points of Control (nPOC)
To view the nPOC move the chart back in time to pick up the nPOCs.
Chart Champions – Part 2 – CCV IBs POC
This indicator is broken down into:
• Chart Champions Value
• Initial Balance
• Points of Control
Chart Champions Value (CCV)
CCV is based on the 80% rule of the dOpen opening outside of the pdVAH/pdVAL. Please do you own research to fully understand how this trading strategy works (readily avaliable online).
Initial Balance (IB)
IB is based on the first 60 minutes of the market opening. It captures the highest and lowest points within that 60 minutes. Please do you own research to fully understand how this trading strategy works (readily avaliable online).
Points of Control (POCs)
POC are the price levels where the most volume was traded.
Developing POC (dPOC) will constantly move with volume/price action through out the day.
Optional POCs
Previous Day POC (pdPOC) – Day Before Yesterday POC (dbyPOC)
Chart Champions – Part 3 – Sessions - Manual Input
This indicator is broken down into:
• Manual Inputs (daily, weekly, monthly)
• IGOR SessionsTtimes
• Pre + Market Openings
Manual Input
Daily x3
Weekly x 3
Monthly x 3
This allows the trader to put in specific levels.
IGOR Session Times
This is a user specific requirement to highlight cetain times during the day, displayed at the bottom of the chart in the colour strip.
Pre + Market Openings
This allows the user to see when pre market trading has started and with the live maket has started, displayed at the top of the chart in colours.
A huge thank you goes out to:
Stackoverflow users AnyDozer and Bjorn.
TV user ahancock for allow me use of this code.
Disclaimer the lower the timeframe the more information it processes.

Triple ATR Adaptive MAs + VWAP Option + Clouds + Candle Trend V2Another one of my experiences ... combining things...
📘 Indicator Description – Triple ATR Adaptive Moving Averages with VWAP Influence
This indicator plots three adaptive moving averages whose behavior changes dynamically based on market volatility (ATR) and optionally VWAP deviation.
Because they adapt in real time to both volatility and VWAP pressure, their movement, slope, and reaction speed differ significantly from traditional moving averages.
🔶 1. ATR-Adaptive Moving Averages
Each of the three MAs uses a custom adaptive formula:
ATR (Average True Range) is measured over a chosen period.
Higher ATR → more volatility → the MA becomes more reactive and moves closer to price.
Lower ATR → stable market → the MA becomes smoother and slower.
This creates a volatility-aware smoothing factor, making the MA expand, contract, and respond to market conditions in ways a classic SMA, EMA, or HMA cannot.
🔷 2. Optional VWAP Influence
Each MA has an independent toggle allowing it to be influenced by VWAP.
When enabled:
The MA is gently “pulled” toward VWAP.
The strength of this attraction is determined by the VWAP Influence parameter (0–1).
This causes the moving averages to behave differently from normal MAs:
In trending markets, the ATR and price push the MA away from VWAP.
In mean-reverting or balanced conditions, VWAP pulls the MA back toward fair value.
The result is an MA that reflects both trend pressure and fair-value pressure.
🔶 3. Visual Behavior: Non-Traditional Movement
Because each MA is simultaneously influenced by volatility, trend magnitude, and VWAP deviation, their shape is often very distinct from normal moving averages.
They may:
Respond faster during high volatility
Flatten out earlier during consolidation
Curve toward VWAP when price becomes extended
Separate or compress depending on ATR strength
This is intentional and essential, since the goal is to show:
✔ Volatility expansion
✔ Trend exhaustion
✔ Overextended price relative to VWAP
✔ Dynamic trend confirmation
Rather than simply smoothing past price.
🔷 4. Three Independent Adaptive Lines
Each of the three moving averages has:
Its own ATR length
Its own sensitivity multiplier
Its own optional VWAP influence
Its own color and trail
This allows the user to combine:
a fast volatility-adaptive trend line
a mid-range adaptive baseline
a slow adaptive long-trend MA
All adapting independently to volatility and VWAP conditions.
🔶 5. Optional Candle Coloring
The indicator can color candles according to trend strength derived from the fast/slow MAs.
Stronger trends produce more vivid colors. Neutral or conflicting trends produce softer colors.
This adds a visual layer to identify:
Trend direction
Trend strength
Volatility state
Market compression
at a glance.
📌 Summary
This indicator does not behave like standard SMAs or EMAs because each line dynamically adapts to:
🔸 ATR (volatility)
🔸 VWAP (fair value)
This makes the indicator extremely responsive to market conditions while still reducing noise during stable phases.
It provides a more realistic, context-aware, and intelligent representation of price behavior compared to traditional moving averages.

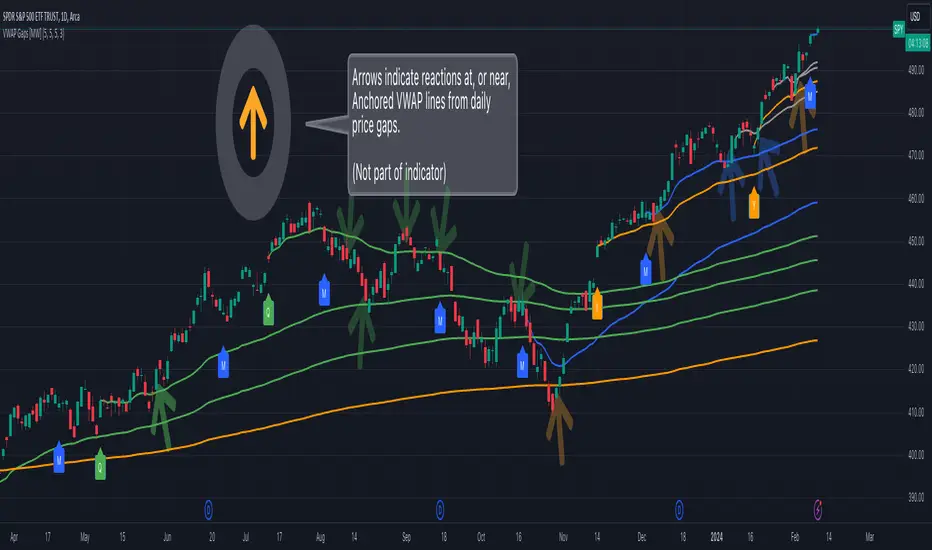
Multi VWAP from Gaps [MW]Multi VWAP from Gaps
Introduction
The Multi VWAP from Gaps tool extends the concept of using the Anchored Volume Weighted Average Price, popularized by its founder, Brian Shannon, founder of AlphaTrends. It creates automatic AVWAPS for anchor points originating at the biggest gaps of the week, month, quarter and year. Currently, most standard VWAP tools allow users to place custom anchored VWAPs, but the routine of doing this for every equity being watched can become cumbersome. This tool makes that process multi-times easier. Considering that large gaps can represent a shift in market structure, this tool provides unique and immediate insight into how past daily price gaps can and have affected price action.
Settings
LABEL SETTINGS
Show Biggest Gap of Week | Month | Quarter : Toggle labels that identify the location of the biggest gaps for the selected time period.
Show Big Labels : Toggle labels from showing the date and gap size to just showing a single letter (W/M/Q/Y) designating the time period that the gap is from.
Hide All Labels : Turn labels off and on.
MAX VWAP LINES
Max Weekly | Monthly | Quarterly | Yearly Lines : How many VWAP lines, starting from today, should be shown for the specified time period. Max: 5
SHOW VWAP LINES
Show Weekly | Monthly | Quarterly | Yearly Lines : This feature allows you to remove lines for the specified time period.
Calculations
This indicator does not provide buy or sell signals. It is simply the VWAP calculated starting from an “anchor point”, or start time. It is calculated by the summation of Price x Volume / Volume for the period starting at the anchor point.
How to Interpret
According to Brian Shannon, VWAP is an objective measure of what the average trader has paid for a particular equity over a given period, and is the value that large institutional investors frequently use as a trade signal. Therefore, by definition, when the price is above an AVWAP, buyers are in control for that period of time. Likewise, if the price is below the AVWAP, sellers are in control for that period of time.
VWAPs that coincide with important events, such as FOMC meetings, CPI reports, earnings reports, have added significance. In many cases, these events can cause gaps to happen in day-to-day price movement, and can affect market structure going forward.
Practically speaking, price action can tend to change direction when a significant VWAP is hit, voiding buy and sell signals. Like moving averages, this indicator can show, in real-time, how a buy or sell signal should be interpreted. A significant AVWAP line is a point of interest, and can serve as strong support or resistance, because large institutions may be using those values for entries or exits. For a great analysis of how to use AVWAP, visit the AlphaTrends channel on Youtube here or you can buy Brian Shannon’s “Anchored VWAP” book on Amazon.
Other Usage Notes and Limitations
It's important for traders to be aware of the limitations of any indicator and to use them as part of a broader, well-rounded trading strategy that includes risk management, fundamental analysis, and other tools that can help with reducing false signals, determining trend direction, and providing additional confirmation for a trade decision. Diversifying strategies and not relying solely on one type of indicator or analysis can help mitigate some of these risks.
Additionally, in order to build the VWAP calculations, past data is needed that may not be available on shorter timeframes. The workaround is that for some longer-term VWAP lines on shorter timeframes, you may see less than the total of lines that you selected in settings. This is particularly the case with quarterly VWAP lines on the 5 minute timeframe for some equities.
Acknowledgements
This script uses the MarketHolidays library by @Protervus. Also, for debugging, the JavaScript-style Debug Console by @algotraderdev was invaluable. Special thanks to @antsmuzic for helping review and debug the script. And, of course, without Brian Shannon's books, videos, and interviews, this indicator would would not have happened.
|AG| VWAP ANALYSIS|AG| VWAP ANALYSIS
The volume-weighted average price (VWAP) is a trading benchmark used by traders that gives the average price security has traded throughout the day, based on both volume and price.
It is important because it provides traders with insight into both the trend and value of the security.
VWAP is calculated by adding up the $ traded for every transaction (price multiplied by the number of shares traded) and then dividing by the total shares traded.
A detailed formula and calculations could be found here:
-> fanf2.user.srcf.net
Actually, TradingView has an option for Anchored Vwap is a really good implementation for specific analysis.
The following script takes into account the #Time_Period_Change and plots the VWAP calculation.
The #Time_Period Available for this script are:
-> Day
-> Week
-> Monthly
-> Quarter
-> Year
1. The option that we have is the SOURCE:
-> HLC3 (High, Low, Close)/3 is the right way to calculate VWAP.
-> But I included other traditional options:
-> open, high, low, close, hl2, hlc3, ohlc4
2. The option of Turn ON/OFF VWAP
-> Timeframe selection:
-> All, 1. Day, 2. Week, 3. Month, 4. Quarter, 5. Year, 6. >=Weekly, 7. >=Montlhy
-> With this, we could select the time for plotting the VWAP. And some cool features such as >= that we are going to plot different Timeframes VWAP calculations.
-> Vwap Label:
-> We could select if show labels or not
3. The option of Turn ON/OFF Previous VWAP Level
-> VWAP of one selected Time Period is going to end with a final price this level most of the time is retested and gives us a good opportunity for entry into one trade.
Or could be used as Stop Loss.
-> Timeframe selection:
-> 1. Day, 2. Week, 3. Month, 4. Quarter, 5. Year, 6. >=Weekly, 7. >=Montlhy, 8. >=Daily
-> Factor
-> The factor options lead as increment the extension of the previous time period.
-> Example: D is the normal time period and with factor, we change from 1D to 2D in order to extend previous levels of VWAP.
->The Factor option is only available in 1. Day and 2. Week. With a Min Value of 1 and a Maximum Value of 50.
-> Labels:
-> We could select if show labels or not
4. The option of Turn ON/OFF Standard Deviation Bands
-> Label:
-> We could select if show labels or not
-> Timeframe selection:
-> 1. Day, 2. Week, 3. Month, 4. Quarter, 5. Year
5. The option of Turn ON/OFF Previous Standard Deviation
-> Timeframe selection:
-> None, 1. Day, 2. Week, 3. Month, 4. Quarter, 5. Year, 6. >=Weekly, 7. >=Montlhy, 8. Quarter & Year
-> STDEV LEVEL
-> Since there are different options for Standard Deviation I included 4 options
-> 1
-> 2
-> 3
-> User Selection
-> In this option we could select any NUMBER for STVDEV 0.25 of step.
-> Label:
-> We could select if show labels or not
6. The Lockback Setting
-> This Script also includes an option to only plot a certain amount of days back.
The main reason in order to have a more clear chart.
-> We could select between:
-> PLOT ALL
-> CUSTOM
-> If we select Custom Then we could select the Number of Days Back that is going to be plotted.
7. Color Theme
Here we select the color (Visual Desing)
-> Color Theme
-> Text Color
-> Here I use the recent input.color option added for TradingView making the color selection really simple
8. Time Period Highlighter
-> In this option, we could select one time period in order to plot one tiny background and identify the change in the time period.
-> Timeframe selection:
-> 1. Day, 2. Week, 3. Month, 4. Quarter, 5. Year
9. Label Offset
-> Finally, this option leads us to change the position of the labels into the X-axis by default 20.
This script has many options the combinations and the possibilities of making different analyses are bast.
Here some examples of what we could make:
DEFAULT SETTING:
PREVIOUS VWAP FOR TIME PERIOD >= WEEK
(work good as S&D levels)
PREVIOUS VWAP Week WITH A FACTOR OF 4
STANDARD DEVIATION BANDS - DAY
STANDARD DEVIATION BANDS - WEEK
STANDARD DEVIATION BANDS - MONTH
STANDARD DEVIATION BANDS - QUARTER
STANDARD DEVIATION BANDS - YEAR
PREVIOUS STANDARD DEVIATION - DAY SDTV 3
PREVIOUS STANDARD DEVIATION - WEEK SDTV 3
USING STANDARD DEVIATION BANDS - WEEK
WITH LOCKBACK -> PLOT ALL
WITH CUSTOM 30 DAYS
I think the options possibilities of analysis using #VWAP are truly awesome.
I like the relationship that one previous VWAP has with Standard Pivot Points.
Good Luck,
Anderson,

Multi-Anchor VWAP | Trade Symmetry🧩 Multi-Anchor VWAP
Description:
Dynamic VWAP anchored to Session, Week, Month, Quarter, and Year — all in one view.
Full Description:
This indicator plots multiple VWAPs (Volume-Weighted Average Prices) simultaneously — each anchored to a different time period:
Session, Week, Month, Quarter, and Year.
💡 Ideal for traders who track institutional mean reversion and liquidity zones across multiple timeframes.
Features
✅ Session, Weekly, Monthly, Quarterly, and Yearly Anchored VWAPs
✅ Independent color and visibility controls for each anchor
✅ Adjustable label position and size
✅ Option to hide VWAPs on Daily or higher charts
✅ Clean and efficient performance
This tool helps you visualize volume-weighted mean levels where price often reacts — offering a clear map of bias and equilibrium across all major time horizons.

Kviatek - Multi Hour VWAPThis is an experimental script, that plots 24 VWAPs, each starting at a new hour and lasting for 24hours.
After using session anchored VWAPs i kept wondering if the price reacts to VWAPs that begin at periods lower than sessions.
Color of each VWAP changes upon crossovers of the following VWAP, giving us an understanding of trends and whether we're trading with the trend or against it.
By the nature of the script I recommend using it on low timeframes, 5 and 15-minute ones ideally.

Fallback VWAP (No Volume? No Problem!) – Yogi365Fallback VWAP (No Volume? No Problem!) – Yogi365
This script plots Daily, Weekly, and Monthly VWAPs with ±1 Standard Deviation bands. When volume data is missing or zero (common in indices or illiquid assets), it automatically falls back to a TWAP-style calculation, ensuring that your VWAP levels always remain visible and accurate.
Features:
Daily, Weekly, and Monthly VWAPs with ±1 Std Dev bands.
Auto-detection of missing volume and seamless fallback.
Clean, color-coded trend table showing price vs VWAP/bands.
Uses hlc3 for VWAP source.
Labels indicate when fallback is used.
Best Used On:
Any asset or index where volume is unavailable.
Intraday and swing trading.
Works on all timeframes but optimized for overlay use.
How it Works:
If volume == 0, the script uses a constant fallback volume (1), turning the VWAP into a TWAP (Time-Weighted Average Price) — still useful for intraday or index-based analysis.
This ensures consistent plotting on instruments like indices (e.g., NIFTY, SENSEX,DJI etc.) which might not provide volume on TradingView.

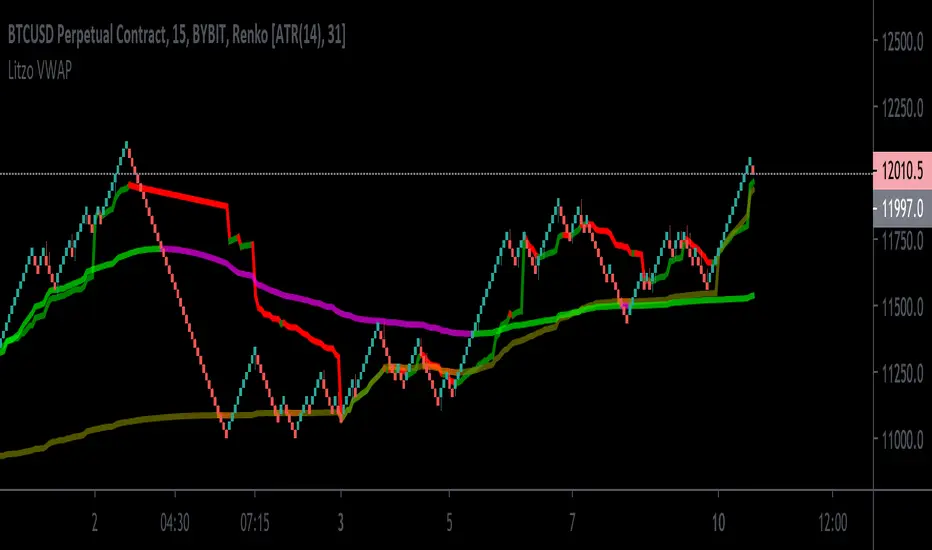
Litzo VWAPA basic VWAP that shows both session and weekly VWAP in one.
Defaults: source HLC3
Session VWAP: Price above : Line=Green. Price Below: Line=Red
Weekly VWAP: Price above: Line=Blue, Price Below: Line=Orange
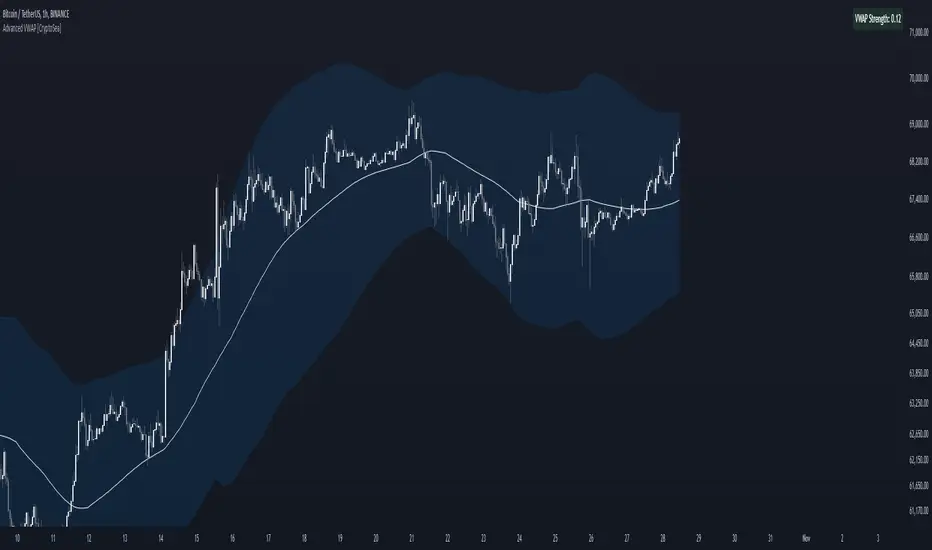
Advanced VWAP [CryptoSea]The Advanced VWAP is a comprehensive volume-weighted average price (VWAP) tool designed to provide traders with a deeper understanding of market trends through multi-layered VWAP analysis. This indicator is ideal for those who want to track price movements in relation to VWAP bands and detect key market levels with greater precision.
Key Features
Multi-Timeframe VWAP Bands: Includes multiple VWAP bands with different lookback periods (5, 10, 25, and 50), allowing traders to observe short-term and long-term price behavior.
Smoothed Band Options: Offers optional smoothing of VWAP bands to reduce noise and highlight significant trends more clearly.
Dynamic Median Line Display: Plots the median line of the VWAP bands, providing a reference for price movements and potential reversal zones.
VWAP Trend Strength Calculation: Measures the strength of the trend based on the price's position relative to the VWAP bands, normalized between -1 and 1 for easier interpretation.
In the example below we can see the VWAP Forecastd Cloud, which consists of multiple layers of VWAP bands with varying lookback periods, creating a dynamic forecast visualization. The cloud structure represents potential future price ranges by projecting VWAP-based bands outward, with darker areas indicating higher density and overlap of the bands, suggesting stronger support or resistance zones. This approach helps traders anticipate price movement and identify areas of potential consolidation or breakout as the price interacts with different layers of the forecast cloud.
How it Works
VWAP Calculation: Utilizes multiple VWAP calculations based on various lookback periods to capture a broad range of price behaviors. The indicator adapts to different market conditions by switching between short-term and long-term VWAP references.
Smoothing Algorithms: Provides the ability to smooth the VWAP bands using different moving average types (SMA, EMA, SMMA, WMA, VWMA) to suit various trading strategies and reduce market noise.
Trend Strength Analysis: Computes the trend strength based on the price's distance from the VWAP bands, with a value range of -1 to 1. This feature helps traders identify the intensity of uptrends and downtrends.
Alert Conditions: Includes alert options for crossing above or below the smoothed median line, as well as touching the smoothed upper or lower bands, providing timely notifications for potential trading opportunities.
This image below illustrates the use of smoothed VWAP bands, which provide a cleaner representation of the price's relationship to the VWAP by reducing market noise. The smoothed bands create a flowing cloud-like structure, making it easier to observe significant trends and potential reversal points. The circles highlight areas where the price interacts with the smoothed bands, indicating potential key levels for trend continuation or reversal. This setup helps traders focus on meaningful movements and filter out minor fluctuations, improving the identification of strategic entry and exit points based on smoother trend signals.
Application
Strategic Entry and Exit Points: Helps traders identify optimal entry and exit points based on the interaction with VWAP bands and trend strength readings.
Trend Confirmation: Assists in confirming trend strength by analyzing price movements relative to the VWAP bands and detecting significant breaks or touches.
Customized Analysis: Supports a wide range of trading styles by offering adjustable smoothing, band settings, and alert conditions to meet specific trading needs.
The Advanced VWAP by is a valuable addition to any trader's toolkit, offering versatile features to navigate different market scenarios with confidence. Whether used for day trading or longer-term analysis, this tool enhances decision-making by providing a robust view of price behavior relative to VWAP levels.
Timeweighted Colored VWAP with SlopeHey, traders!
This script calculates the VWAP's change rate against ATR in a number of k-lines. It controls the VWAP line's color based on the average change rate, and it changes its color in a time-weighted way.
1. Calculating vwapValue's rate of change
2. Controlling Line's color based on the average change rate against ATR
3. Calculating average change rate in the past k-lines
K线的数量:计算多少根K线的VWAP值的变化率的平均值,相当于用K线的数量来时间加权
变化率阈值:线条颜色变化的阈值,VWAP值的变化率比这个大或者小时改变颜色,否则延续原来的颜色
Good luck with your trading!

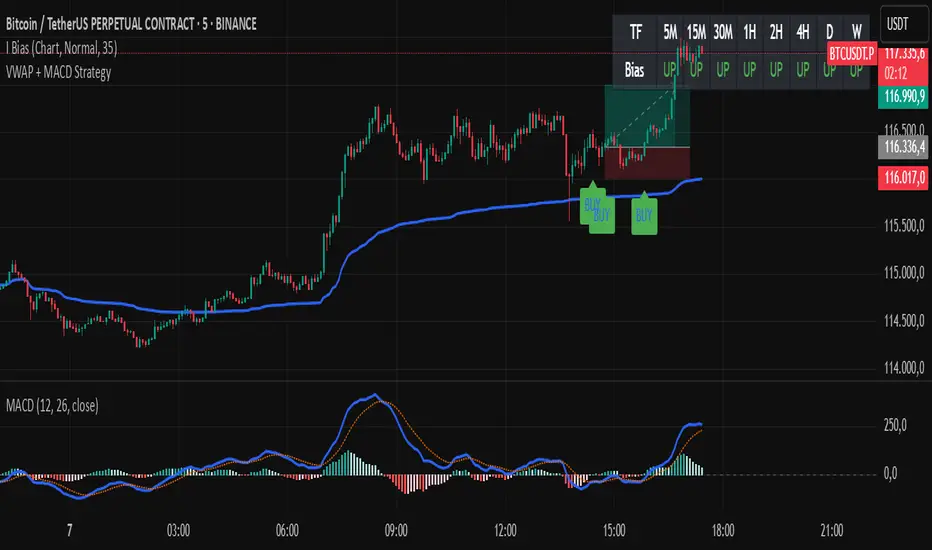
VWAP + MACD Estrategia MilloVWAP + MACD Strategy
This indicator combines the VWAP (Volume Weighted Average Price) with MACD (Moving Average Convergence Divergence) to create buy and sell signals. It helps traders identify potential market entry and exit points based on price action and momentum.
Conditions for Buy:
The price must be above the VWAP.
The MACD line crosses above the signal line (bullish crossover).
The MACD line is below the zero line.
Conditions for Sell:
The price must be below the VWAP.
The MACD line crosses below the signal line (bearish crossover).
The MACD line is above the zero line.
Features:
The VWAP line is plotted to represent the average price, weighted by volume, over a specified period.
Buy signals appear when all conditions are met for an upward price movement.
Sell signals appear when all conditions are met for a downward price movement.
MACD and Signal Line: The MACD helps to confirm momentum, while the signal line indicates possible trend reversals.
Customizable: You can modify the VWAP and MACD parameters to suit different trading strategies.
This strategy is designed for intraday traders and scalpers, aiming to catch quick movements while being aware of market momentum.
Feel free to share this description along with the code! Let me know if you need any adjustments or further explanations.
Bollinger Bands + VWAP + 4-State MACD BackgroundBollinger Bands + VWAP + 4-State MACD Background
An all-in-one technical analysis indicator combining three proven tools with an intelligent momentum-based background visualization system.
📊 FEATURES
Bollinger Bands
Standard Bollinger Bands implementation with full customization options:
Adjustable period length (default: 20)
Multiple moving average types: SMA, EMA, SMMA (RMA), WMA, VWMA
Configurable standard deviation multiplier (default: 2.0)
Visual fill between bands to highlight volatility zones
Offset capability for forward/backward display
Session VWAP (Volume Weighted Average Price)
Automatically resets at the start of each trading session:
Calculates true volume-weighted average price
Resets daily to provide fresh reference levels
Customizable source input (default: HLC3)
Adjustable line appearance (color and width)
Can be toggled on/off as needed
4-State MACD Background System
This is the unique feature of this indicator. The chart background dynamically changes based on MACD momentum analysis, providing instant visual feedback on trend strength and direction:
🟢 Strong Bullish (Bright Green)
MACD line is above signal line
Histogram is growing (momentum accelerating upward)
Indicates strong upward momentum
🟢 Weak Bullish (Pale Green)
MACD line is above signal line
Histogram is shrinking (momentum decelerating)
Early warning signal that uptrend may be weakening
🔴 Strong Bearish (Bright Red)
MACD line is below signal line
Histogram is falling (momentum accelerating downward)
Indicates strong downward momentum
🔴 Weak Bearish (Pale Red)
MACD line is below signal line
Histogram is rising (momentum decelerating)
Early warning signal that downtrend may be weakening
🎯 HOW TO USE
For Trend Trading:
Strong colored backgrounds indicate confirmed momentum in that direction - consider staying with the trend
Weak colored backgrounds signal potential momentum exhaustion - watch for possible reversals
Use VWAP as a dynamic support/resistance level
Bollinger Band breakouts combined with strong MACD backgrounds can confirm trend strength
Price above VWAP + strong bullish background = bullish bias
Price below VWAP + strong bearish background = bearish bias
For Mean Reversion:
Price touching upper/lower Bollinger Bands with weak MACD background may suggest potential reversal
VWAP acts as a mean reversion anchor during range-bound sessions
Background color shifts from strong to weak often precede price direction changes
Look for price return to VWAP when extended beyond bands with weakening momentum
Signal Confirmation:
Strongest signals occur when multiple indicators align:
BB breakout + MACD strong color + price above/below VWAP
Price rejection at BB bands + MACD color weakening
VWAP support/resistance hold + MACD color change
⚙️ SETTINGS
All components are fully customizable through organized input groups:
Bollinger Bands Group:
Period length
Moving average type (SMA/EMA/SMMA/WMA/VWMA)
Source (close/open/high/low/etc.)
Standard deviation multiplier
Offset
VWAP Group:
Toggle show/hide
Source calculation method
Line color
Line width
MACD Group:
Toggle background on/off
Fast length (default: 12)
Slow length (default: 26)
Signal length (default: 9)
Source
Four separate color settings for each momentum state
All colors include transparency controls
💡 EDUCATIONAL VALUE
This indicator teaches important concepts:
How volatility (Bollinger Bands) relates to price movement
The importance of volume-weighted pricing (VWAP)
Momentum analysis through MACD
How combining multiple timeframes and indicators can provide confluence
The difference between trend strength and trend direction
⚠️ IMPORTANT NOTES
This indicator is for educational and informational purposes only
No indicator is perfect - always use proper risk management
Past performance does not guarantee future results
Combine with your own analysis and risk tolerance
Test thoroughly on historical data before live trading
This is not financial advice - use at your own risk
🔧 TECHNICAL DETAILS
Pine Script Version 6
Overlay indicator (displays on price chart)
All calculations use standard, well-documented formulas
Minimal lag due to efficient coding
Compatible with all timeframes and instruments
No repainting - all signals are confirmed on bar close
📝 CHANGELOG
Version 1.0
Initial release
Bollinger Bands with multiple MA types
Session VWAP with daily reset
4-state MACD background system
Full customization options
Developed for traders who want multiple confirmation signals in a clean, organized format without cluttering their charts with separate indicator panels.

Institutional VWAP Suite (Lite Compatible)The **Institutional VWAP Suite (Lite Compatible)** brings true institutional volume-weighted price analysis to every trader — even on TradingView Lite/Free accounts where standard VWAP tools are restricted.
This script recreates the most important VWAP models used by banks, funds, and high-frequency desks, including:
• **Daily VWAP** (exchange-accurate)
• **Weekly VWAP** (manually accumulated)
• **Monthly VWAP** (manually accumulated)
• **Rolling Window VWAP** (array-based, fully Lite-compatible)
All calculations avoid blocked functions like `ta.sum` or session-restricted VWAP calls. Everything is built manually from volume and price to ensure accuracy across all accounts and all markets.
### Features
• Multi-timeframe VWAPs (Daily/Weekly/Monthly)
• Manual Rolling VWAP with adjustable length
• Optional VWAP bands (Lite-safe)
• Clean visuals with color-coded levels
• Optimized arrays for fast, stable performance
• Free-tier compatible — no premium functions required
This tool is designed for traders who want institutional structure, premium-level VWAP calculations, and consistent execution regardless of plan level. Perfect for scalpers, day traders, futures traders, and anyone who uses intraday volume profiles.
### Recommended Use
• Map directional bias using Daily vs Weekly VWAP
• Use Monthly VWAP for macro trend context
• Track intraday mean reversion with Rolling VWAP
• Use VWAP bands as dynamic support/resistance zones
A simple, powerful, no-restrictions VWAP engine — built for everyone.

VWAP – Pivot Pairs (SECONDS‑BASED RESET)VWAP – Pivot Pairs (SECONDS-BASED RESET) is a Pine Script v6 indicator for TradingView that combines pivot-based breakout detection with resettable VWAP (Volume Weighted Average Price) calculations over user-defined rolling time periods in seconds.It identifies high and low swing pivots via breakout logic, then calculates two VWAP lines per anchor:One using high/low as the price source,
One using close as the price source.
These form "pivot pairs" that reset automatically at the start of each custom-duration period (e.g., every 300 seconds), starting from a user-defined UTC time of day (default: 09:30 UTC).Visuals include:Colored VWAP lines (high pair: red, low pair: green),
Semi-transparent fill zones between each pair,
Optional toggles to show/hide high or low pairs.
Use CasesUse Case
Description
Intraday Scalping (1–15 min charts)
Use 60–300 second resets to capture micro-trends within larger sessions. VWAP pairs act as dynamic support/resistance after breakouts.
High-Frequency / Algo Validation
Backtest strategies on tick/second charts where traditional session resets fail. Align resets with exchange micro-sessions or volatility windows.
Opening Range Breakout (ORB) Enhancement
Set period_seconds = 1800 (30 min) and start time = 09:30 UTC → VWAP builds only on first 30 mins post-open, then floats. Pairs show deviation from ORB mean.
Range-Bound Market Analysis
In choppy markets, VWAP pairs converge near fair value. Divergence signals potential breakout. Fill color intensity shows conviction.
Multi-Timeframe Confluence
Overlay on 1-second chart with 300s reset → matches 5-minute structure. Use close-based VWAP for entries, high/low-based for stops.
Key Features SummaryFeature
Function
period_seconds
Rolling window length in seconds (e.g., 300 = 5 min)
period_start_time
UTC time-of-day anchor (default: 09:30)
new_period logic
Triggers full reset of pivots + VWAP on exact second boundary
breakingHigher / breakingLower
Detects confirmed breakouts (not just close above high)
Dual VWAP per anchor
ta.vwap(high) and ta.vwap(close) for range-aware mean
Fill zones
Visual value area between high/close VWAPs
Toggle visibility
Independently show/hide high or low pivot pairs
How It Works – Step-by-StepTime Engine Converts user inputs → milliseconds
Calculates current period start time using integer division from epoch
Detects exact bar when new period begins (new_period = true)
On New Period Resets both high/low anchors to current bar’s h and l
Forces VWAP recalculation from this bar forward
Breakout Detection Only triggers on strong candles (rising/falling, non-doji)
Requires open/close beyond prior pivot → avoids wicks-only breaks
VWAP Accumulation ta.vwap(source, reset_condition) restarts when anchor resets
Two sources per side → shows where volume clustered (at highs vs closes)
Plotting Four lines + two fills
Clean, customizable, overlay-friendly
Pro TipsUse on Heikin Ashi for smoother breakout signals.
Combine with volume profile to validate VWAP clusters.
For crypto, set period_start_time = 0 (00:00 UTC) for clean 4-hour resets.
Add alerts on new_period or breakingHigher for automation.
In short: This is a precision VWAP tool for time-boxed, pivot-driven mean reversion and breakout trading, ideal for scalpers, day traders, and algo developers needing sub-session granularity.

Rolling Midpoint of Price & VWAP with ATR BandsThe Rolling Midpoint of Price & VWAP with ATR Bands indicator is a dual-equilibrium concept that fuses price-range structure and traded-volume flow into one continuously updating hybrid model. Traditional VWAPs reset each session and reflect where trading occurred by volume, while midpoints used here reveal where price has structurally balanced between extremes. This script merges both ideas into a cohesive, dynamic system. The Rolling Price Midpoint (50 % of range) represents the structural fair-value line, calculated as the average of the highest high and lowest low over a selected window. The Rolling VWAP (Volume-Weighted Window) tracks the flow-based fair-value line by weighting each bar’s typical price by its volume. Together, these components form the Hybrid Equilibrium — the adaptive center of gravity that shifts as price and volume evolve. Surrounding this equilibrium, ATR Bands at ± 2.226 ATR and ± 5.382 ATR define volatility envelopes that expand and contract with market energy. The result is a living cloud that breathes with the market: compressing during phases of balance and widening during impulsive movements, offering traders a clear visual framework for understanding equilibrium, volatility, and directional bias in real time.
➖
⚙️ Auto-Preset System
The Auto-Preset System intelligently adjusts lookback windows for both the Price Midpoint and VWAP calculations according to the active chart timeframe.
This ensures that the indicator automatically adapts to any trading style — from scalping on 1-minute charts to swing trading on daily or weekly charts — without manual tuning.
🔹 How It Works
When Auto-Preset mode is enabled, the script dynamically selects the most effective lookback lengths for each timeframe.
These presets are optimized to balance responsiveness and stability, maintaining consistent real-world coverage (e.g., the same approximate duration of price data) across all intervals.
📊 Preset Mapping Table
| Chart Timeframe | Price Midpoint Lookback | VWAP Lookback |
|:----------------:|:-----------------------:|:--------------:|
| 1–3m | 13 bars | 21 bars
| 5–10m | 21 bars | 34 bars
| 15–30m | 34 bars | 55 bars
| 1–2 hr | 55 bars | 89 bars
| 4 hr-1D | 89 bars | 144 bars
| 1W | 144 bars | 233 bars
| 1M | 233 bars | 377 bars
⚡ Notes & Customization
- Manual Override: Turn off Auto-Preset Mode to specify your own custom lookback lengths.
- Consistency Across Scales: These adaptive values keep the indicator visually coherent when switching between timeframes — avoiding distortions that can occur with static lengths.
- Practical Benefit: Traders can maintain a single chart layout that self-tunes seamlessly, removing the need to manually recalibrate settings when shifting from short-term to long-term analysis.
In short, the Auto-Preset System is designed to make this hybrid equilibrium tool timeframe-aware — automatically scaling its logic so that the cloud behaves consistently, regardless of chart resolution.
➖
🌐 Hybrid Equilibrium Envelope
The core hybrid midpoint acts as the mean of structural (price) and volumetric (VWAP) balance.
ATR-based bands project natural expansion zones:
🔸+2.226 / –2.226 ATR → inner equilibrium (controlled trend)
*🔸+5.382 / –5.382 ATR → outer volatility extension (over-stretch / reversion zones)
Color-coded fills show regime strength:
* 🟧 Upper Outer (+5.382) – strong bullish expansion
* 🟩 Upper Inner (+2.226) – trending equilibrium
* 🔴 Lower Inner (–2.226) – mild bearish control
* 🟣 Lower Outer (–5.382) – volatility exhaustion
➖
🧭 Higher-Timeframe Framework
Two macro anchors — Price length of 144 and VWAP length of 233 — outline higher-timeframe bias zones. These help confirm when local momentum aligns with (or fades against) long-term structure.
Labels on the right show active lookback values for quick readout:
`$(13) V(21)` → current rolling pair
`$144 / V233` → macro anchors
➖
🧩 Chart Examples
**AMD 15m (Equilibrium Expansion)**
Price steadily rides above the hybrid midpoint as teal and orange (bullish) ATR zones widen, confirming a phase of controlled bullish volatility and healthy trend expansion.
BTCUSD 1m (Volatility Compression)
Bitcoin coils tightly inside the teal-to-maroon equilibrium bands before breaking out.
The hybrid midpoint flattens and ATR envelopes contract, signaling a state of balance before volatility expansion.
ETHUSD 15m (Transition from Compression → Impulse)
Ethereum transitions from purple-zone compression into a clear upper-band expansion.
The hybrid midpoint breaks above the macro VWAP 233, confirming the shift from equilibrium to directional momentum.
SOFI 1m (Micro Bias Reversal)
SOFI’s intraday structure flips as price reclaims the hybrid midpoint.
The macro VWAP 233 flattens, signaling a transition from oversold lower bands back toward equilibrium and early trend recovery.
➖
🎯 How to Use
1. Bias Detection – Price > Hybrid Midpoint → bullish; < → bearish.
2. Volatility Gauge – Watch band spacing for compression / expansion cycles.
3. Confluence Checks – Align Hybrid Midpoint with HTF 233 VWAP for strong continuation signals.
4. Mean Reversion Zones – Outer bands highlight areas where probability of snap-back increases.
➖
🔧 Inputs & Customization
Auto Presets toggle
🔸Manual Lookback Overrides** for fine-tuning
🔸Plot Window Length** (show recent vs full history)
🔸ATR Sensitivity & Fill Opacity** controls
🔸Label Padding / Font Size** for cleaner overlay visuals
➖
🧮 Formula Highlights
➖Rolling Midpoint = (highest(high,N) + lowest(low,N)) / 2
➖Rolling VWAP = Σ(Typical Price×Vol) / Σ(Vol)
➖Hybrid = (PriceMid + VWAP) / 2
➖Upper₂ = Hybrid + ATR×2.226
➖Lower₂ = Hybrid − ATR×2.226
➖Upper₅ = Hybrid + ATR×5.382
➖Lower₅ = Hybrid − ATR×5.382
➖
🎯 Ideal For
➡️ Traders who want adaptive fair-value zones that evolve with both price and volume.
➡️ Analysts who shift between scalping, swing, and position timeframes, and need a tool that self-adjusts.
➡️ Those who rely on visual structure clarity to confirm setups across changing volatility conditions.
➡️ Anyone seeking a hybrid model that unites structural range logic (midpoint) and flow-based balance (VWAP).
➖
🏁 Final Word
This script is more than a visual overlay — it’s a complete trend and structure framework built to adapt with market rhythm. It helps traders visualize equilibrium, momentum, and volatility as one cohesive system. Whether you’re seeking clean trend alignment, dynamic support/resistance, or early warning signs of reversals, this indicator is tuned to help you react with confidence — not hindsight.
➖
Remember — no single indicator should ever stand alone. For best results, pair it with price action context, higher-timeframe structure, and complementary tools such as moving averages or trendlines. Use it to confirm setups, not define them in isolation.
💡 Turn logic into clarity, structure into trades, and uncertainty into confidence.
