MACD Volume VWAP Scalping (2min) by Obiii📘 Strategy Description (for TradingView)
MACD Volume VWAP Scalping Strategy (2-Minute Intraday Momentum)
This strategy is designed for scalpers and short-term intraday traders who focus on capturing small, high-probability moves during the most active hours of the trading session — typically between 9:45 AM and 11:30 AM (New York time).
The system combines three key momentum confirmations:
MACD crossovers to detect short-term trend shifts,
Volume spikes to validate real market participation, and
VWAP / EMA alignment to filter trades in the direction of the prevailing intraday trend.
🔹 Entry Logic
Long Entry:
MACD line crosses above the signal line
Both MACD and Signal are above zero
Current volume > average of the last 10 candles
Price is above VWAP and (optionally) above EMA 9 and EMA 20
Short Entry:
MACD line crosses below the signal line
Both MACD and Signal are below zero
Current volume > average of the last 10 candles
Price is below VWAP and (optionally) below EMA 9 and EMA 20
🎯 Exit Logic
Fixed Take Profit: +0.25%
Fixed Stop Loss: -0.15% to -0.20%
Optionally, switch to the 5-minute chart after entry to monitor momentum and manage exits more smoothly.
⚙️ Recommended Settings
Timeframe: 2 minutes (entries), 5 minutes (monitoring)
Market Session: 9:45 AM – 11:30 AM EST
Assets: Highly liquid instruments such as SPY, QQQ, NVDA, TSLA, AAPL, or large-cap momentum stocks.
💡 Notes
This is a momentum-based scalping strategy — precision and discipline are key.
It performs best in high-volume environments where clear direction emerges after the morning volatility settles.
The system can be fine-tuned for different profit targets, MACD settings, or volume thresholds depending on volatility.
Tìm kiếm tập lệnh với "vwap"

FDF – Step 4 (Touch-21 + Trend/VWAP + Channel + Prev75% toggle)FDF — EMAs + VWAP Retest Entry System (A++ Signal Mode Compatible)
This indicator is designed for traders who follow a structured pullback and continuation entry method using the 9 EMA, 21 EMA, and VWAP as trend and momentum guides.
The system highlights high-probability retest entries when price pulls back into the EMA channel and shows strength in the direction of trend. It also includes optional A++ wick filters for traders who want to refine entries only to the strongest momentum candles.
Core Logic
A trade setup is identified when:
Trend is defined by the EMA alignment
• Long bias when EMA9 > EMA21
• Short bias when EMA9 < EMA21
Price retests the 21 EMA
• The candle must touch or cross the 21 EMA
• Designed to time pullbacks, not breakouts
Entry Confirmation
• Candle closes back in channel or breaks away in the trend direction
• Optional requirement: price must be on the correct side of VWAP for intraday trend alignment
A++ Wick Filter Mode (Optional)
Enable this mode to restrict entries to only high-dominance candles:
Dominant wick must exceed the opposing wick by a chosen percentage
Opposing wick can optionally be limited to a % of body size
Helps avoid weak, indecisive, or absorption candles
This mode is optional — turn it off to allow standard FDF entries.
Signals
When conditions are met, the script plots:
Green Triangle → Long entry signal
Red Triangle → Short entry signal
(Entries are plotted only after candle close to avoid repainting.)
Best Use
• Works on 5m / 15m / 1H intraday trend structures
• Pairs well with market structure + liquidity zones
• Designed for disciplined traders who wait for trend alignment and controlled pullbacks
Disclaimer
This tool is provided for educational and research purposes only.
It is not financial advice. Always test your setup and manage risk appropriately.

Volume-Price Divergence Indicator (OBV + VWAP, Multi-Timeframe)Description:
This indicator helps you identify volume-price divergences and potential trend weakness across any specified timeframe.
Features:
Volume bars with moving average – green for bullish, red for bearish, with orange SMA to detect low-volume situations.
Custom OBV calculation with divergence detection – highlights when price makes new highs/lows but OBV does not.
VWAP deviation alerts – signals when price moves far from VWAP while volume remains low, indicating potential fake breakouts.
Fully configurable – select any reference timeframe, adjust volume MA, OBV period, and VWAP deviation threshold.
Visual markers – easily spot bullish/bearish divergences and volume-price mismatches directly on your chart.
Use case:
Spot early trend exhaustion points.
Identify fake breakouts or weak rallies/drops.
Combine with your existing trading strategy for more informed entries and exits.
Structural Liquidity Signals [BullByte]Structural Liquidity Signals (SFP, FVG, BOS, AVWAP)
Short description
Detects liquidity sweeps (SFPs) at pivots and PD/W levels, highlights the latest FVG, tracks AVWAP stretch, arms percentile extremes, and triggers after confirmed micro BOS.
Full description
What this tool does
Structural Liquidity Signals shows where price likely tapped liquidity (stop clusters), then waits for structure to actually change before it prints a trigger. It spots:
Liquidity sweeps (SFPs) at recent pivots and at prior day/week highs/lows.
The latest Fair Value Gap (FVG) that often “pulls” price or serves as a reaction zone.
How far price is stretched from two VWAP anchors (one from the latest impulse, one from today’s session), scaled by ATR so it adapts to volatility.
A “percentile” extreme of an internal score. At extremes the script “arms” a setup; it only triggers after a small break of structure (BOS) on a closed bar.
Originality and design rationale, why it’s not “just a mashup”
This is not a mashup for its own sake. It’s a purpose-built flow that links where liquidity is likely to rest with how structure actually changes:
- Liquidity location: We focus on areas where stops commonly cluster—recent pivots and prior day/week highs/lows—then detect sweeps (SFPs) when price wicks beyond and closes back inside.
- Displacement context: We track the last Fair Value Gap (FVG) to account for recent inefficiency that often acts as a magnet or reaction zone.
- Stretch measurement: We anchor VWAP to the latest N-bar impulse and to the Daily session, then normalize stretch by ATR to assess dislocation consistently across assets/timeframes.
- Composite exhaustion: We combine stretch, wick skew, and volume surprise, then bend the result with a tanh transform so extremes are bounded and comparable.
- Dynamic extremes and discipline: Rather than triggering on every sweep, we “arm” at statistical extremes via percent-rank and only fire after a confirmed micro Break of Structure (BOS). This separates “interesting” from “actionable.”
Key concepts
SFP (liquidity sweep): A candle briefly trades beyond a level (where stops sit) and closes back inside. We detect these at:
Pivots (recent swing highs/lows confirmed by “left/right” bars).
Prior Day/Week High/Low (PDH/PDL/PWH/PWL).
FVG (Fair Value Gap): A small 3‑bar gap (bar2 high vs bar1 low, or vice versa). The latest gap often acts like a magnet or reaction zone. We track the most recent Up/Down gap and whether price is inside it.
AVWAP stretch: Distance from an Anchored VWAP divided by ATR (volatility). We use:
Impulse AVWAP: resets on each new N‑bar high/low.
Daily AVWAP: resets each new session.
PR (Percentile Rank): Where the current internal score sits versus its own recent history (0..100). We arm shorts at high PR, longs at low PR.
Micro BOS: A small break of the recent high (for longs) or low (for shorts). This is the “go/no‑go” confirmation.
How the parts work together
Find likely liquidity grabs (SFPs) at pivots and PD/W levels.
Add context from the latest FVG and AVWAP stretch (how far price is from “fair”).
Build a bounded score (so different markets/timeframes are comparable) and compute its percentile (PR).
Arm at extremes (high PR → short candidate; low PR → long candidate).
Only print a trigger after a micro BOS, on a closed bar, with spacing/cooldown rules.
What you see on the chart (legend)
Lines:
Teal line = Impulse AVWAP (resets on new N‑bar extreme).
Aqua line = Daily AVWAP (resets each session).
PDH/PDL/PWH/PWL = prior day/week levels (toggle on/off).
Zones:
Greenish box = latest Up FVG; Reddish box = latest Down FVG.
The shading/border changes after price trades back through it.
SFP labels:
SFP‑P = SFP at Pivot (dotted line marks that pivot’s price).
SFP‑L = SFP at Level (at PDH/PDL/PWH/PWL).
Throttle: To reduce clutter, SFPs are rate‑limited per direction.
Triggers:
Triangle up = long trigger after BOS; triangle down = short trigger after BOS.
Optional badge shows direction and PR at the moment of trigger.
Optional Trigger Zone is an ATR‑sized box around the trigger bar’s close (for visualization only).
Background:
Light green/red shading = a long/short setup is “armed” (not a trigger).
Dashboard (Mini/Pro) — what each item means
PR: Percentile of the internal score (0..100). Near 0 = bullish extreme, near 100 = bearish extreme.
Gauge: Text bar that mirrors PR.
State: Idle, Armed Long (with a countdown), or Armed Short.
Cooldown: Bars remaining before a new setup can arm after a trigger.
Bars Since / Last Px: How long since last trigger and its price.
FVG: Whether price is in the latest Up/Down FVG.
Imp/Day VWAP Dist, PD Dist(ATR): Distance from those references in ATR units.
ATR% (Gate), Trend(HTF): Status of optional regime filters (volatility/trend).
How to use it (step‑by‑step)
Keep the Safety toggles ON (default): triggers/visuals on bar‑close, optional confirmed HTF for trend slope.
Choose timeframe:
Intraday (5m–1h) or Swing (1h–4h). On very fast/thin charts, enable Performance mode and raise spacing/cooldown.
Watch the dashboard:
When PR reaches an extreme and an SFP context is present, the background shades (armed).
Wait for the trigger triangle:
It prints only after a micro BOS on a closed bar and after spacing/cooldown checks.
Use the Trigger Zone box as a visual reference only:
This script never tells you to buy/sell. Apply your own plan for entry, stop, and sizing.
Example:
Bullish: Sweep under PDL (SFP‑L) and reclaim; PR in lower tail arms long; BOS up confirms → long trigger on bar close (ATR-sized trigger zone shown).
Bearish: Sweep above PDH/pivot (SFP‑L/P) and reject; PR in upper tail arms short; BOS down confirms → short trigger on bar close (ATR-sized trigger zone shown).
Settings guide (with “when to adjust”)
Safety & Stability (defaults ON)
Confirm triggers at bar close, Draw visuals at bar close: Keep ON for clean, stable prints.
Use confirmed HTF values: Applies to HTF trend slope only; keeps it from changing until the HTF bar closes.
Performance mode: Turn ON if your chart is busy or laggy.
Core & Context
ATR Length: Bigger = smoother distances; smaller = more reactive.
Impulse AVWAP Anchor: Larger = fewer resets; smaller = resets more often.
Show Daily AVWAP: ON if you want session context.
Use last FVG in logic: ON to include FVG context in arming/score.
Show PDH/PDL/PWH/PWL: ON to see prior day/week levels that often attract sweeps.
Liquidity & Microstructure
Pivot Left/Right: Higher values = stronger/rarer pivots.
Min Wick Ratio (0..1): Higher = only more pronounced SFP wicks qualify.
BOS length: Larger = stricter BOS; smaller = quicker confirmations.
Signal persistence: Keeps SFP context alive for a few bars to avoid flicker.
Signal Gating
Percent‑Rank Lookback: Larger = more stable extremes; smaller = more reactive extremes.
Arm thresholds (qHi/qLo): Move closer to 0.5 to see more arms; move toward 0/1 to see fewer arms.
TTL, Cooldown, Min bars and Min ATR distance: Space out triggers so you’re not reacting to minor noise.
Regime Filters (optional)
ATR percentile gate: Only allow triggers when volatility is at/above a set percentile.
HTF trend gate: Only allow longs when the HTF slope is up (and shorts when it’s down), above a minimum slope.
Visuals & UX
Only show “important” SFPs: Filters pivot SFPs by Volume Z and |Impulse stretch|.
Trigger badges/history and Max badge count: Control label clutter.
Compact labels: Toggle SFP‑P/L vs full names.
Dashboard mode and position; Dark theme.
Reading PR (the built‑in “oscillator”)
PR ~ 0–10: Potential bullish extreme (long side can arm).
PR ~ 90–100: Potential bearish extreme (short side can arm).
Important: “Armed” ≠ “Enter.” A trigger still needs a micro BOS on a closed bar and spacing/cooldown to pass.
Repainting, confirmations, and HTF notes
By default, prints wait for the bar to close; this reduces repaint‑like effects.
Pivot SFPs only appear after the pivot confirms (after the chosen “right” bars).
PD/W levels come from the prior completed candles and do not change intraday.
If you enable confirmed HTF values, the HTF slope will not change until its higher‑timeframe bar completes (safer but slightly delayed).
Performance tips
If labels/zones clutter or the chart lags:
Turn ON Performance mode.
Hide FVG or the Trigger Zone.
Reduce badge history or turn badge history off.
If price scaling looks compressed:
Keep optional “score”/“PR” plots OFF (they overlay price and can affect scaling).
Alerts (neutral)
Structural Liquidity: LONG TRIGGER
Structural Liquidity: SHORT TRIGGER
These fire when a trigger condition is met on a confirmed bar (with defaults).
Limitations and risk
Not every sweep/extreme reverses; false triggers occur, especially on thin markets and low timeframes.
This indicator does not provide entries, exits, or position sizing—use your own plan and risk control.
Educational/informational only; no financial advice.
License and credits
© BullByte - MPL 2.0. Open‑source for learning and research.
Built from repeated observations of how liquidity runs, imbalance (FVG), and distance from “fair” (AVWAPs) combine, and how a small BOS often marks the moment structure actually shifts.

Elite MA Trend Overlay [9/21/50/200 + VWAP + HMA]🔍 What It Is:
The Elite MA Trend Overlay is a professional-grade moving average system built for day traders, scalpers, and swing traders who need clear, visual trend confirmation and precise entry zones across all timeframes.
This overlay combines 5 industry-proven tools into one compact indicator for sniper-level decision making:
EMA 9 – Entry momentum
EMA 21 – Microstructure guide
EMA 50 – Trend bias filter
EMA 200 – Institutional macro direction
VWAP – Intraday fair value (used by pros)
Hull MA (HMA) – Early shift detector
It also features auto-detected trend zones using color-coded background shading to help you instantly know if the market is in a bullish or bearish regime.
🧠 How It Works:
The script dynamically plots the short-term to long-term moving averages to reflect real-time market structure. When all EMAs are aligned in one direction, a colored background highlights the dominant trend:
✅ Green background = Bullish trend (9 > 21 > 50 > 200)
🔻 Red background = Bearish trend (9 < 21 < 50 < 200)
The VWAP line acts as a magnet and decision zone—traders use it for intraday entries or exits. The Hull Moving Average adapts quickly to price shifts, making it perfect for spotting early reversals before the EMAs cross.
🎯 Why It Helps Traders Succeed:
This indicator:
Removes guesswork: Know instantly if you’re in a strong trend or chop zone.
Filters bad trades: Avoid entering against structure or into volatility traps.
Improves timing: Use pullbacks to EMAs or Hull MA flips for sniper entries.
Works across timeframes: From scalping 1-minute to swing trading daily charts.
Whether you're trading gold, forex, stocks, or crypto — this overlay gives you clean, professional structure that keeps you disciplined and sharp.
⚙️ Features:
On/off toggles for VWAP & Hull MA
Minimalist, clutter-free plotting
Auto background color zones
Supports Pine Script v6 (latest version)
👑 Recommended Use:
Confirm trend with background + EMA alignment
Enter on pullbacks to EMA 21 or 50
Use Hull MA or RSI for early reversal detection
Exit at VWAP reversion or trend exhaustion
💬 “Structure is everything. Trade with the flow, not against it.”

RSI + VWAP Strategy by vipindaskr🔍 This script combines RSI and VWAP for intraday trend-based entries.
✅ *Buy Signal:*
- Price above VWAP
- RSI > 60
- Green background + up triangle shown
❌ *Sell Signal:*
- Price below VWAP
- RSI < 40
- Red background + down triangle shown
📈 Ideal for Nifty 50 intraday traders using 5-minute chart.
Developed by vipindaskr 💻

EMA 8/21/50 + VWAP Crossover Alert IndicatorOverview of the Indicator
This is a custom Pine Script v5 indicator for TradingView titled "EMA 8/21/50 + VWAP Crossover Alert Indicator" (short title: "EMA+VWAP Cross Alert"). It's designed as an overlay indicator, meaning it plots directly on your price chart rather than in a separate pane. The primary purpose is to detect and alert on crossovers between the 8-period Exponential Moving Average (EMA) and the 21-period EMA, which can signal potential bullish or bearish momentum shifts. These are classic short-term trend reversal or continuation signals often used in trading strategies like momentum or swing trading.
To enhance analysis, it also includes:
A 50-period EMA for medium-term trend context (e.g., to confirm if the overall trend aligns with the crossover).
A Volume Weighted Average Price (VWAP) line, which provides a benchmark for the average price weighted by volume, useful for identifying intraday value areas or fair price levels.
The indicator works across all timeframes (e.g., Daily, 4H, 1H, 15M, 5M, 3M) because the calculations are based on the chart's current bars and adapt to volatility and data resolution. It's not a trading strategy (no entry/exit logic or backtesting), but an alert tool—signals are visual and can trigger notifications in TradingView. Always combine it with risk management, as crossovers can produce false signals in ranging or choppy markets.

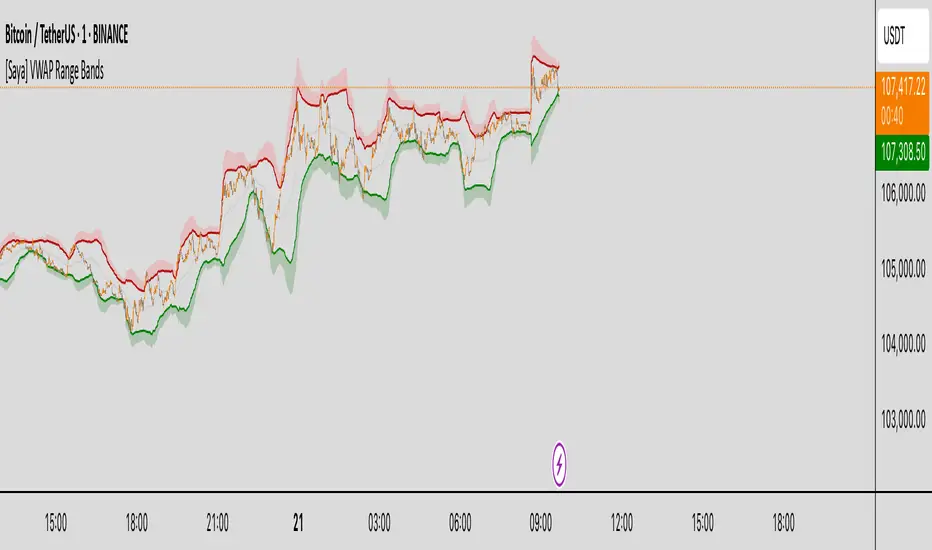
[Saya] VWAP Range Bands VWAP Range Bands is a custom volatility-based indicator that visualizes dynamic support and resistance zones using a volume-weighted average price (VWAP) combined with adaptive deviation bands.
🔍 Features:
• VWAP-based midline for mean reversion insight
• Dynamic upper and lower bands based on average deviation or standard deviation
• Visual highlights when price crosses extreme zones
• Optional deviation count table to monitor how often price breaks out
Great for identifying high-probability reversal or continuation areas in both trending and ranging markets.
Volume-Weighted Pivot BandsThe Volume-Weighted Pivot Bands are meant to be a dynamic, rolling pivot system designed to provide traders with responsive support and resistance levels that adapt to both price volatility and volume participation. Unlike traditional daily pivot levels, this tool recalculates levels bar-by-bar using a rolling window of volume-weighted averages, making it highly relevant for intraday traders, scalpers, swing traders, and algorithmic systems alike.
-- What This Indicator Does --
This tool calculates a rolling VWAP-based pivot level, and surrounds that central pivot with up to five upper bands (R1–R5) and five lower bands (S1–S5). These act as dynamic zones of potential resistance (R) and support (S), adapting in real time to price and volume changes.
Rather than relying on static session or daily data, this indicator provides continually evolving levels, offering more relevant levels during sideways action, trending periods, and breakout conditions.
-- How the Bands Are Calculated --
Pivot (VWAP Pivot):
The core of this system is a rolling Volume-Weighted Average Price, calculated over a user-defined window (default 20 bars). This ensures that each bar’s price impact is weighted by its volume, giving a more accurate view of fair value during the selected lookback.
Volume-Weighted Range (VW Range):
The highest high and lowest low over the same window are used to calculate the volatility range — this acts as a spread factor.
Support & Resistance Bands (S1–S5, R1–R5):
The bands are offset above and below the pivot using multiples of the VW Range:
R1 = Pivot + (VW Range × multiplier)
R2 = R1 + (VW Range × multiplier)
R3 = R2 + (VW Range x multiplier)
...
S1 = Pivot − (VW Range × multiplier)
S2 = S1 − (VW Range × multiplier)
S3 = S2 - (VW Range x multiplier)
...
You can control the multiplier manually (default is 0.25), to widen or tighten band spacing.
Smoothing (Optional):
To prevent erratic movements, you can optionally toggle on/off a simple moving average to the pivot line (default length = 20), providing a smoother trend base for the bands.
-- How to Use It --
This indicator can be used for:
Support and resistance identification:
Price often reacts to R1/S1, and the outer bands (R4/R5 or S4/S5) act as overshoot zones or strong reversal areas.
Trend context:
If price is respecting upper bands (R2–R3), the trend is likely bullish. If price is pressing into S3 or lower, it may indicate sustained selling pressure or a breakdown.
Volatility framing:
The distance between bands adjusts based on price range over the rolling window. In tighter markets, the bands compress — in volatile moves, they expand. This makes the indicator self-adaptive.
Mean reversion trades:
A move into R4/R5 or S4/S5 without continuation can be a sign of exhaustion — potential for reversal toward the pivot.
Alerting:
Built-in alerts are available for crosses of all major bands (R1–R5, S1–S5), enabling trade automation or scalp alerts with ease.
-- Visual Features --
Fuchsia Lines: Mark all Resistance (R1–R5) levels.
Lime Lines: Mark all Support (S1–S5) levels.
Gray Circle Line: Marks the rolling pivot (VWAP-based).
-- Customizable Settings --
Rolling Length: Number of bars used to calculate VWAP and VW Range.
Multiplier: Controls how wide the bands are spaced.
Smooth Pivot: Toggle on/off to smooth the central pivot.
Pivot Smoothing Length: Controls how many bars to average when smoothing is enabled.
Offset: Visually shift all bands forward/backward in time.
-- Why Use This Over Standard Pivots? --
Traditional pivots are based on previous session data and remain fixed. That’s useful for static setups, but may become irrelevant as price action evolves. In contrast:
This system updates every bar, adjusting to current price behavior.
It includes volume — a key feature missing from most static pivots.
It shows multiple bands, giving a full view of compression, breakout potential, or trend exhaustion.
-- Who Is This For? --
This tool is ideal for:
Day traders & scalpers who need relevant intraday levels.
Swing traders looking for evolving areas of confluence.
Algorithmic/systematic traders who rely on quantifiable, volume-aware support/resistance.
Traders on all assets: works on crypto, stocks, futures, forex — any chart that has volume.

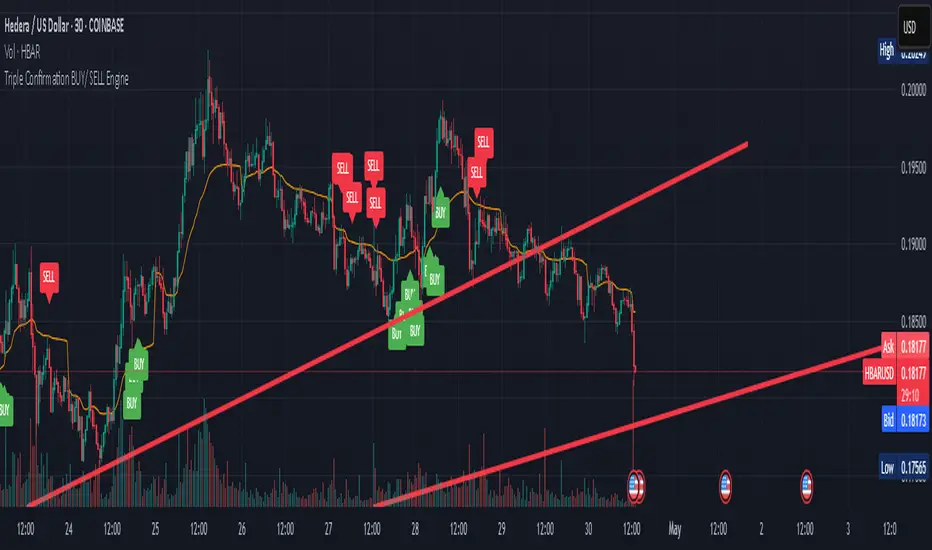
Triple Confirmation Buy/Sell Engine VWAP + MACD + RSIDescription:
This custom-built indicator generates high-confidence Buy/Sell signals using a powerful combination of MACD momentum, RSI strength, and VWAP trend confirmation — designed for cleaner entries and fewer false signals.
Unlike traditional scripts that rely on only one indicator (and produce noisy or early signals), this system requires triple confirmation, greatly increasing signal quality and reducing false trades.
✅ Buy Signal Conditions:
MACD histogram turns green (momentum shift positive)
RSI crosses above 50 (bullish strength confirmation)
Price closes above VWAP (trend confirmation)
🔻 Sell Signal Conditions:
MACD histogram turns red (momentum shift negative)
RSI crosses below 50 (weakening trend)
Price closes below VWAP (bearish confirmation)
🛠 Best For:
Trend traders seeking higher probability entries
Swing traders who want to catch bigger moves
Crypto, stocks, forex traders looking for simple, effective signals
NR4/NR7 + Trend + MACD + VWAP FilterThe Ultimate Momentum-Compression Strategy
This strategy merges the power of price compression and trend confirmation, ensuring you're trading when the market is coiled and ready to move. By combining multiple filters—NR4/NR7, trend alignment, MACD momentum, and VWAP support—this setup identifies high-probability trade opportunities in dynamic, trending stocks. Here's how it works:
NR4/NR7 Patterns: These are narrow-range days where the current price range is smaller than the previous 4 or 7 days. This signals potential breakout or continuation setups, as the market is compressing before making a move.
Trend Confirmation: To ensure you're not trading against the current trend, the price must be above the 20 EMA, and the 10 EMA must be above the 20 EMA. This confirms a bullish structure, with the price trending in your favour.
MACD Momentum: The fast MACD line must be above the slow MACD line, confirming the trend is not only intact but also gaining momentum.
VWAP Filter: Price must be above the VWAP (Volume Weighted Average Price). This is the final confirmation that the market is in a strong, bullish phase, with buyers dominating the market.
By requiring all these conditions to align, this strategy takes the guesswork out of day trading. It ensures you're trading within a well-established trend, with compression patterns and momentum backing your trade. The result? You’re entering positions with confidence and clarity, poised to ride strong, sustained moves.
This strategy is for the trader who values both flexibility and discipline—able to capture dynamic moves while staying aligned with market structure and momentum. It’s a refined, systematic approach that makes decisions clear, without the emotional second-guessing.

Pivot Levels with EMA Trend📌 Trend Change Levels with EMA Trend
✨ Description:
This TradingView script identifies clean trend change levels based on 1-hour structure shifts and filters them to keep only those not invalidated. It follows the "Jake Ricci" method, each level is printed at the beginning of the candle that changes the trend, on a 1 hour chart. For precision, make sure to exclude after/pre market and only use the levels on regular hours charts.
It includes dynamic EMAs (9, 50, 200), intraday VWAP, the daily open level printed, and a visual trend label based on EMA(9) slope.
Designed for intermediate traders, it helps build bias, manage entries, and avoid false setups by focusing on clean, reactive levels that the market respects.
🔧 Core Logic:
On the 1H chart, the script compares current and previous closes to detect trend direction. If the trend flips (e.g., up to down), the open of the candle that caused the flip becomes a candidate level.
Only levels that remain untouched by future candle closes are plotted — this filters out “weak” levels that price already violated (which means, a candle closes after passing through the level).
These levels become key S/R zones and often act as reaction points during pullbacks, traps, and liquidity sweeps.
The idea is to check how the price reacts to those levels. Usually there's a clean retest of the level. After that, if the price continues in that direction, it tends to reach the following level.
🔹 Included Tools:
🟣 Trend Change Levels (1H):
Fixed horizontal lines based on confirmed shifts in trend, shown only when not broken.
📉 EMAs (9 / 50 / 200):
Visibility can be set per timeframe. Use for trend context.
📍 EMA Trend Label:
Shows \"UP\", \"DOWN\", or \"RANGE\" based on EMA(9) slope.
🔵 VWAP (Intraday Reset):
Real-time volume-weighted average price that resets daily. Useful for fair value zones and reversion plays.
🟠 Daily Open Line:
Plot of the current day’s open. Used for intraday directional bias. Usually: DO NOT take longs below the Open Print, DO NOT take shorts above it.
📊 ATR Table:
Displays current ATR multiplier on the chart. It's useful to understand if the market is expanding or not.
📈 How to Use It (Strategy):
1. Start on the 1H chart to generate levels.
Only the open of candles that reversed trend are considered — and only if future candles didn’t close through them. I suggest manually adding horizontal lines to mark again the levels, so that they stick to all the timeframes.
2. Use the trend label to decide your bias — \"UP\" for long setups, \"DOWN\" for shorts. Avoid trading against the slope.
3. Switch to the 5m chart and wait for price to approach a plotted level. These are often used for manipulation, retests, or clean reversals.
4. Look for confirmation: rejection candles, break-and-retest, strong engulfing candles, or traps above/below the level. ALWAYS check the price action around the level, along with the volume.
5. Check if VWAP or an EMA is near the level. If yes, the confluence strengthens the trade idea.
6. Use the ATR value to understand if the market is expanding (candles are bigger than the ATR). You don't want to stay in a slow and ranging trade.
✅ Example Entry Flow:
1. On the 1H chart, note a trend change level printed recently.
2. Check the current trend label — if it says \"UP,\" prefer longs.
3. Wait for price to retrace toward the level.
4. On the 5m, look for a bullish engulfing candle or trap setup at the level.
5. Check if VWAP and EMA(50) are near. If yes, execute the trade.
6. Set stop just under the low of the candle prior to your entry. Ideally, a retracing candle.
To be clear: imaging to be LONG, you wait for a retracement that should touch your level. You wait for a candle that resumes the LONG trend, enter when it breaks the high of the previous candle (sill in retracement), you place your stop under the candle prior to your entry.
Notes:
No repainting — levels only show up after confirmed shifts.
Removes broken levels for chart clarity and reliability.
Helps spot high-probability pullback zones and fakeouts.
Perfect confluence tool to support price action, SMC, or EMA strategies.
Works across multiple timeframes with customizable inputs.
👤 Ideal For:
Intraday traders looking for reactive entry points and direction confirmation.
Swing traders wanting to pinpoint continuation zones or reversal pivots.
🚨 Final Note: This indicator doesn’t generate buy/sell signals. It improves your trade filtering by identifying areas the market already respected and reacting to them with price action. Combine it with your own system , test it in replay, and use screenshots to document setups.
📌 If used with discipline, this becomes a precision tool — not a signal generator.

ScalpSwing Pro SetupScript Overview
This script is a multi-tool setup designed for both scalping (1m–5m) and swing trading (1H–4H–Daily). It combines the power of trend-following , momentum , and mean-reversion tools:
What’s Included in the Script
1. EMA Indicators (20, 50, 200)
- EMA 20 (blue) : Short-term trend
- EMA 50 (orange) : Medium-term trend
- EMA 200 (red) : Long-term trend
- Use:
- EMA 20 crossing above 50 → bullish trend
- EMA 20 crossing below 50 → bearish trend
- Price above 200 EMA = uptrend bias
2. VWAP (Volume Weighted Average Price)
- Shows the average price weighted by volume
- Best used in intraday (1m to 15m timeframes)
- Use:
- Price bouncing from VWAP = reversion trade
- Price far from VWAP = likely pullback incoming
3. RSI (14) + Key Levels
- Shows momentum and overbought/oversold zones
- Levels:
- 70 = Overbought (potential sell)
- 30 = Oversold (potential buy)
- 50 = Trend confirmation
- Use:
- RSI 30–50 in uptrend = dip buying zone
- RSI 70–50 in downtrend = pullback selling zone
4. MACD Crossovers
- Standard MACD with histogram & cross alerts
- Shows trend momentum shifts
- Green triangle = Bullish MACD crossover
- Red triangle = Bearish MACD crossover
- Use:
- Confirm swing trades with MACD crossover
- Combine with RSI divergence
5. Buy & Sell Signal Logic
BUY SIGNAL triggers when:
- EMA 20 crosses above EMA 50
- RSI is between 50 and 70 (momentum bullish, not overbought)
SELL SIGNAL triggers when:
- EMA 20 crosses below EMA 50
- RSI is between 30 and 50 (bearish momentum, not oversold)
These signals appear as:
- BUY : Green label below the candle
- SELL : Red label above the candle
How to Trade with It
For Scalping (1m–5m) :
- Focus on EMA crosses near VWAP
- Confirm with RSI between 50–70 (buy) or 50–30 (sell)
- Use MACD triangle as added confluence
For Swing (1H–4H–Daily) :
- Look for EMA 20–50 cross + price above EMA 200
- Confirm trend with MACD and RSI
- Trade breakout or pullback depending on structure

Time-Based VWAP (TVWAP)(TVWAP) Indicator
The Time-Based Volume Weighted Average Price (TVWAP) indicator is a customized version of VWAP designed for intraday trading sessions with defined start and end times. Unlike the traditional VWAP, which calculates the volume-weighted average price over an entire trading day, this indicator allows you to focus on specific time periods, such as ICT kill zones (e.g., London Open, New York Open, Power Hour). It helps crypto scalpers and advanced traders identify price deviations relative to volume during key trading windows.
Key Features:
Custom Time Interval:
You can set the exact start and end times for the VWAP calculation using input settings for hours and minutes (24-hour format).
Ideal for analyzing short, high-liquidity periods.
Dynamic Accumulation of Price and Volume:
The indicator resets at the beginning of the specified session and accumulates price-volume data until the end of the session.
Ensures that the TVWAP reflects the weighted average price specific to the chosen session.
Visual Representation:
The indicator plots the TVWAP line only during the specified time window, providing a clear visual reference for price action during that period.
Outside the session, the TVWAP line is hidden (na).
Use Cases:
ICT Scalp Trading:
Monitor price rebalances or potential liquidity sweeps near TVWAP during important trading sessions.
Mean Reversion Strategies:
Detect pullbacks toward the session’s average price for potential entry points.
Breakout Confirmation:
Confirm price direction relative to TVWAP during kill zones or high-volume times to determine if a breakout is supported by volume.
Inputs:
Start Hour/Minute: The time when the TVWAP calculation starts.
End Hour/Minute: The time when the TVWAP calculation ends.
Technical Explanation:
The indicator uses the timestamp function to create time markers for the session start and end.
During the session, the price-volume (close * volume) is accumulated along with the total volume.
TVWAP is calculated as:
TVWAP = (Sum of (Price × Volume)) ÷ (Sum of Volume)
Once the session ends, the TVWAP resets for the next trading period.
Customization Ideas:
Alerts: Add notifications when the price touches or deviates significantly from TVWAP.
Different Colors: Use different line colors based on upward or downward trends.
Multiple Sessions: Add support for multiple TVWAP lines for different time periods (e.g., London + New York).

ANIL's OHCL, VWAP and EMA CrossPrevious Week High and Low:
This part calculates the previous week's high and low values and plots them as continuous blue lines. The plot.style_line ensures the lines are drawn continuously.
Previous Day Open, High, Low, Close:
The script uses request.security to get the previous day's open, high, low, and close values. These are plotted as continuous lines in different colors:
Open: Green
High: Red
Low: Orange
Close: Purple
VWAP (Volume Weighted Average Price):
The VWAP is calculated using ta.vwap(close) and plotted with a thick black line.
Exponential Moving Averages (EMAs):
The script calculates two EMAs: one with a 9-period (fast) and one with a 21-period (slow).
The EMAs are plotted as continuous lines:
Fast EMA: Blue
Slow EMA: Red
EMA Cross:
The script checks for EMA crossovers and crossunders:
A crossover (fast EMA crossing above slow EMA) triggers a buy signal (green label below the bar).
A crossunder (fast EMA crossing below slow EMA) triggers a sell signal (red label above the bar).
Customization:
You can adjust the fastLength and slowLength variables to change the period of the EMAs.
You can modify the line colors and line thickness to match your preferred style.
The buy and sell signals can be customized further with different shapes or additional conditions for signal generation.
This script provides a comprehensive and visually distinct indicator with the previous week's and day's levels, VWAP, and EMA crossover signals.
Rolling Reversion BandsRolling Reversion Bands: A Technical Trading Indicator
This indicator helps traders spot potential reversal opportunities by showing where price might be overextended and likely to return to average levels. It combines two powerful technical tools - Volume Weighted Average Price (VWAP) and Hull Moving Average (HMA) smoothing - to create a more reliable signal.
Key Features:
Golden centerline: A smoothed VWAP that filters out market noise
Uses volume-weighted pricing for better accuracy than simple averages
HMA smoothing reduces false signals while staying responsive to real moves
Works like a "fair value" level that price tends to return to
Colored bands:
Turquoise bands (#32f0dd): Show shorter-term price ranges (100 periods)
Pink/red bands (#c2024f): Show longer-term price ranges (200 periods)
Two levels for each color (inner and outer bands)
How to Use It:
When price moves outside the bands, it might be overextended
The golden HMA-smoothed VWAP centerline acts as a target level where price often returns to
Wider bands show higher volatility, narrower bands show lower volatility
You can toggle different bands on/off to keep your chart clean
Customization:
Adjust HMA smoothing to make the centerline more or less responsive
Change how wide you want the bands to be
Turn different bands on or off as needed
The indicator combines advanced technical concepts (VWAP, HMA, volatility bands) in a visually clean way, using smoothing techniques to reduce noise and help identify clearer trading opportunities.

Three Anchored Moving Averages (VWAP / SMA / EMA)
This indicator allows users to anchor three types of moving averages (Simple Moving Average (SMA), Exponential Moving Average (EMA), and Volume Weighted Average Price (VWAP)) to specific points in time (anchor points)
Key Features:
Select from three Moving Average Types:
Simple Moving Average (SMA): Averages the closing prices over a specified period.
Exponential Moving Average (EMA): Gives more weight to recent prices, making it more responsive to new information.
Volume Weighted Average Price (VWAP): Averages the price weighted by volume, useful for understanding the average price at which the asset has traded over a period.
Up to Three Anchor Points:
Users can set up to three different anchor points to calculate the moving averages from specific dates and times. This allows for analysis of price action starting from significant points or specific events. For example, you can anchor to the low and high of a move to identify key levels or to points where the price takes off from a previous anchored MA.
Customisable Sentiment Options:
Each anchor point can be associated with a sentiment input (Auto, Bull, Bear, None), which influences if the MAs are displayed as lines or zones/bands:
Auto: Automatically determines the sentiment based on whether anchor points are on pivot highs and lows. If anchored to a pivot high, the system will assume a bearish sentiment and display a red band or zone between the MA OHLC4 and High. Anchoring to a pivot low will display a green band (OHLC4 - Low).
Bull: Forces a bullish sentiment (Green Band - OHLC4 to Low)
Bear: Forces a bearish sentiment (Red Band - OHLC4 to High)
None: Ignores sentiment and displays a single line (OHLC4)
Chart Matching:
The indicator includes an option to display the moving averages only if the chart symbol matches a specified ticker. This feature ensures that the indicator is relevant to the specific asset being analysed.
How to Use the Indicator:
1. Set Anchor Points: When added to your chart, select three anchor points by point and click. If you only wish to anchor to a single point, click on that point three times and disable the other two in settings once the indicator is applied.
2. Select Moving Average Type: Choose between SMA, EMA, or VWAP using the dropdown menu. EMAs are the most responsive.
3. Enable/Disable Anchor Points: Use the checkboxes to enable or disable each anchor point.
4. Select Sentiment Type: Choose between Auto, Bull, Bear, or None.
5. Chart Matching: Optionally, specify a chart symbol to restrict the indicator's display to that particular asset.
6. Interpret the Plots: The indicator plots the high, mid, and low values of the selected moving average type from each anchor point. The fills between these plots help identify potential support and resistance zones. These should be used as points of interest for pullback reversals or potential continuation if the price breaks through.
Practical Applications:
Trend Analysis: Identify the overall trend direction from specific historical points.
Support and Resistance: Determine key dynamic support and resistance levels based on anchored moving averages.
Event-Based Analysis: Anchor the moving averages to significant events (e.g., earnings releases, economic data) to study their impact on price trends.
Multi Timeframe Analysis: Higher Timeframe Anchors can be used to identify longer term trend analysis. Switching to a lower timeframe for execution triggers at these points wont distort the MA levels as they are anchored to a specific point in time
Intraday or Swing Trading: trend analysis using anchor points can be used for any style of trading (Intraday / Swing / Invest). Use anchored levels as points of interest and wait for hints in price action to try and catch the next move.

Pivot Points + Day First Candle Breakout + VWAP + Supertrend This indicator amalgamates several key indicators to provide a comprehensive analysis for trading decisions, including SuperTrend, Pivot Points, VWAP, along with the Day First Candle Breakout strategy.
Key Features:
Day First Candle Breakout: Identifies potential breakout opportunities based on the first candle of the trading day. It utilizes the high and low of the initial trading range to determine entry points.
Timeframe Selection: Allows users to select the timeframe for analyzing the first candle (e.g., 5, 15, or 60 minutes).
Previous Day and Week High/Low: Displays the high and low of the previous day and week to provide additional context for trading decisions and assess the strength of the trend.
Trend Strength Analysis: Indicates whether the current price is above or below the previous day's high or low, signaling a stronger bullish or bearish trend respectively.
SuperTrend Indicator: Visualizes the trend direction and potential reversal points based on the SuperTrend indicator. It helps traders to stay aligned with the prevailing trend and avoid premature exits.
Pivot Points: Presents key support and resistance levels derived from Pivot Points, assisting traders in identifying potential reversal or breakout zones.
VWAP (Volume Weighted Average Price): Plots VWAP to provide insight into the average price traded over a given period, aiding in determining the fair value of the asset and potential buying/selling zones.
Trading Signals:
Buy Signal: Triggered when the price exceeds the high of the initial trading range after an upward price gap.
Sell Signal: Generated when the price falls below the low of the initial trading range after a downward price gap.
Caveats for Effective Trading:
Extended Trading Ranges: Adjusts support and resistance levels if the initial trading range extends beyond the defined timeframe.
Morning Noise Consideration: Exercises caution during volatile morning sessions to avoid false breakouts and whipsaws.
Pullbacks and Narrow Range Bars: Looks for opportunities during pullbacks or when the price forms narrow range bars to enter trades, reducing the risk of sudden reversals.

OneThingToRuleThemAll [v1.4]This script was created because I wanted to be able to display a contextual chart of commonly used indicators for scalping and swing traders, with the ability to control the visual representation on the charts as their cross-overs, cross-unders, or changes of state happen in real time. Additionally, I wanted the ability to control how or when they are displayed. While looking through other community projects, I found they lacked the ability to full customize the output controls and values used for these indicators.
The script leverages standard RSI/MACD/VWAP/MVWAP/EMA calculations to help a trader visually make more informed decisions on entering or exiting a trade, depending on their understanding on what the indicators represent. Paired with a table directly on the chart, it allows a trader to quickly reference values to make more informed decisions without having to look away from the price action or look through multiple indicator outputs.
The main functionality of the indicator is controlled within the settings directly on the chart. There a user can enable the visual representations, or disable, and configure how they are displayed on the charts by altering their values or style types.
Users have the ability to enable/disable visual representations of:
The indicator chart
RSI Cross-over and RSI Reversals
MACD Uptrends and Downtrends
VWAP Cross-overs and Cross-unders
VWAP Line
MVWAP Cross-overs and Cross-unders
MVWAP Line
EMA Cross-overs and Cross-unders
EMA Line
Some traders like to use these visual indications as thresholds to enter or exit trades. Its best to find out which ones work the best with the security you are trying to trade. Personally, I use the table as a reference in conjunction with the RSI chart indicators to help me decide a logical trailing stop if I am scalping. Some users might like the track EMA200 crossovers, and have visual representations on the chart for when that happens. However, users may use the other indicators in other methods, and this script provides the ability to be able to configure those both visually and by value.
The pine script code is open source and itself is fairly straightforward, it is mostly written to provide the ultimate level of control the the user of the various indicators. Please reach out to me directly if you would like a further understanding of the code and an explanation on anything that may be unclear.
Enjoy :)
-dead1.

Rolling VWAP OscillatorTL;DR - TradingView's Rolling VWAP as centered oscillator
I really like TradingView's rolling VWAP (Rolling Volume-Weighted Average Price - RVWAP) indicator. But I also like clean charts that's why I'm mainly using indicators which are not displayed on the chart. Instead of simply moving the RVWAP to another pane I turned it into a centered oscillator. This allows me checking the RVWAP while having my chart clean.
You can find the oroginal RVWAP here .
Creds to TradingView for creating this indicator 👍
* I also added a fourth deviation band, gradient colors and the option to switch between candles and lines.

5EMA BollingerBand Nifty Stock Scanner
What ?
We all heard about (well: over-heard) 5-EMA strategy. Which falls into the broader category of mean reversal type of trading setup.
What is mean reversal?
Price (or any time series, in fact) tries to follow a mean . Whenever price diverges from the mean it tries to meet it back.
It is empirically observed by some traders (I honestly don't know who first time observed it) that in Indian context specially, 5 Exponential Moving Average (5-EMA) works pretty good as that mean.
So whenever price moves away from that 5-EMA, it ultimately comes back and attain total nirvana :) Means: if price moved way higher than the 5EMA without touching it, then price will correct to meet it's 5-EMA and if price moved way lower, it will be uplifted to meet it's 5-EMA. Funny - but it works !
Now there are already enough social media coverage on this 5-EMA strategy/setup. Even TradingView has some excellent work done on these setups. Kudos to all those great souls.
So when we came to know about this, we were thinking what we should do for the community. Because it is well cover topic (specially in Indian context). Also, there are public indicators.
Then we thought why not come up with a scanner which will scan all the Nifty-50 constituent stocks and find out on the fly, real-time which all stocks are matching this 5-EMA setup and causing a Buy/Sell trade recommendation.
Hence here we are with the first version of our first scanner on the 5EMA setup (well it has some more masala than merely a 5-EMA setup).
Why?
Parts of why is already covered up.
Now instead of blindly following 5-EMA setup, we added the Bollinger band as well. Again: it's also not new. There are enough coverage in social media about the 5-EMA+BB strategy/setup. We mercilessly borrowed from all of these.
Suppose you have an indicator.
Now you apply the indicator in your chart. And then you need to (rock) and roll through your watchlist of Nifty-50 stocks (note: TradingView has no default watchlist of Nifty-50 stock by default - you have to create one custom watchlist to list all manually) to find out which all are matching the setup, need to take a note about the trade recomendations (entry, SL, target) and other stuffs like VWAP, Volume, volatility (Bollinger Band Width).
Not any more.
This scanner will track all the Nifty-50 stocks (technically: 40 stocks other than Banking stocks) and provide which one to Buy or Sell (if any), what's the entry, SL, target, where is the VWAP of the day, what's the picture in volume (high, low, rising, falling) and the implied volatility (using Bolling band width). Also it has a naive alerting mechanism as well.
In fact the code is there to monitor the (Future) OI also and all the OI drama (OI vs price and all the 4 stuffs like long build up, long unwinding, short covering, short buildup). But unfortunately, due to some limitations of the TradingView (that one can not monitor more than 40 `ta.security` call) we have to comment out the code. If you wish you can monitor only 20 stocks and enable the OI monitoring also (20 for stocks + 20 for their OI monitoring .. total 40 `ta.security` call).
How?
To know the divergence from 5-EMA we just check if the high of the candle (on closing) is below the 5-EMA. Then we check if the closing is inside the Bollinger Band (BB). That's a Buy signal. SL: low of the candle, T: middle and higher BB.
Just opposite for selling. 5-EMA low should be above 5-EMA and closing should be inside BB (lesser than BB higher level). That's a Sell signal. SL: high of the candle, T: middle and lower BB.
Along with we compare the current bar's volume with the last-20 bar VWMA (volume weighted moving average) to determine if the volume is high or low.
Present bar's volume is compared with the previous bar's volume to know if it's rising or falling.
VWAP is also determined using `ta.vwap` built-in support of TradingView.
The Bolling Band width is also notified, along with whether it is rising or falling (comparing with previous candle).
Simple, but effective.
Customization
As usual the EMA setup (5 default), the BB setup (20 SMA with 1.5 standard deviation), we provided option wherther to include or exclude BB role in the 5-EMA setup (as we found out there are two schools of thought .. some people use BB some don't. Lets make all happy :))
We also provide options to choose other symbols using Settings if they wish so. We have the default 40 non banking Nifty stocks (why non-banking? - Bank Nifty is in ATH :) .. enough :)). But if user wishes can monitor others too (provided the symbol is there in TradingView).
Although we strongly recommend the timeframe as 30 minutes , you can choose what's fit you most.
The output of the scanner is a table. By default the table is placed in the right-bottom (as we are most comfortable with that). However you can change per your wish. We have the option to choose that.
What is unique in it ?
This is more of an indicator. This is a scanner (of Nifty-50 stocks). So you can apply (our recommendation is in 30m timeframe) it to any chart (does not matter which chart it is) and it will show every 30 mins (which is also configurable) which all stocks (along with trade levels) to Buy and Sell according to the setup.
It will ease your trading activity.
You can concentrate only on the execution, the filtering you can leave it to this one.
Limitations
There is a build in limitation of the TradingView platform is that one can call only upto 40 securities API. Not beyond that. So naturally we are constraint by that. Otherwise we could monitor 190 Nifty F&O stocks itself.
30m is the recommended timeframe. In very lower (say 5m) this script tends to go out of heap (out of memory). Please note that also.
How to trade using this?
Put any chart in 30m (recommended) timeframe.
Apply this screener from Indicators (shortcut to launch indicators is just type / in your keyboard).
This will provide the Buy (shown in green color) or Sell (shown in red color) recommendations in a table, at every 30m candle closing.
Note the volume and BB width as well.
Wait for at least 2 5-minutes candles to close above/below the recommended level .
Take the trade with the SL and target mentioned.
Mentions
@QuantNomad. The whole implementation concept we mercilessly borrowed from him, even some of his code snippet we took it (after asking him through one of his videos comment section and seeking explicit permission which he readily granted within an hour). Thank You sir @QuantNomad. Indebted to you.
Monika (Rawat) ji: for reviewing, correcting, providing real time examples during live market hours, often compromising her own trading activities, about the effectiveness and usefulness of this setup. Thank You madam ji. Indebted to you.
There are innumerable contents in social media about this. Don't even know whom all we checked. Thanks to all of them.
Happy Trading (in stocks - isn't enough of Indices already?)
Disclaimer
This piece of software does not come up with any warrantee or any rights of not changing it over the future course of time.
We are not responsible for any trading/investment decision you are taking out of the outcome of this indicator.

[blackcat] L3 Stock VWAP Slope in DegreesLevel 3
Background
Smooth VWAP based on stock turnover and calculate the slope of the smoothed VWAP
Function
This is a technical indicator for stocks only. Because of the use of TradingView's financial functions, the scope of use is limited to stocks. It will give an error when you use it for other trading pairs. According to if the VWAP is smoothed according to the stock turnover rate, and the angle of the VWAP is calculated to judge the trend. The specific method of use is: the fast line crosses the slow line at a large angle, which can be regarded as a buy intervention point, and the fast line crosses the slow line in a small amount and then steps back on the slow line, which can also be regarded as a buy intervention point. The slow line is the 3-period moving average of the fast line.
Remarks
Feedbacks are appreciated.

Neo Matrix
What is NeonMoney Indicator?
NeonMoney Indicator is a trend following indicator which gives strong support and resistance indications with some moving averages.
Description
After the long research of 2 years along with 100’s of indicators & oscillators we have created this wonderful indicator which can avoid signals in a choppy market & gives perfect signal to buy and sell at a right time with high winning probability and higher reward to risk.
Main part of this indicator is timeframe period that is it shifts from one to another pivots , vwap and MAs tf automatically which helps in top down analysis.
This indicator is made with Vwap , MA, cpr and fibonacci pivots calculations. It can be useful to trade every market like in crypto, forex, commodities and as well as stock market . To use this indicator trader must have basic understanding of candle pattern and chart pattern identification studies with moving averages retrenchments.
This indicator works well & gives better results if you have moving average retrenchment knowledge. When candles are retrenching specific moving average line then also sometimes traders get confuse whether to enter with moving average direction / favor or not. So, to come out from this confusion this indicator is very useful. Because it gives signal in moving average favors and target at pivot levels. So ultimately traders gain some confident on his/her trade that he/she is in the right side of the market.
Another advantage of this indicator is in some of the criteria it gives fix signal in-between the candle formation & once signal is given then it will not change.
About uses instruction and components.
Time frame – 1m, 3m , 15m, 1H, 4H, DailyTF
Components: Vwap , MAs, CPR , and Fibonacci Pivots .
Dotted line - Vwap
Straight gray line and zone - CPR
Curvy Gray lines - MAs
Colorful lines - Fibonacci pivots