MTF Pivots Zones [tanayroy]Dear Fellow Traders,
I only publish scripts that I use and found good for my trading. Pivots are my favorite indicator. I use daily, weekly, monthly, quarterly, and yearly pivots levels. multiple pivot zones are very strong levels and I like to watch these levels for possible price action.
But when I include all pivots levels at a time, my charts get too clumsy. To see price action properly, you need a clean chart. And when we trade we want to see only important levels within the price horizon.
To resolve this, I created this script, which shows important levels within my display option. I control the display option with 14 periods ATR and a multiplier to adjust the display levels.
The following chart displays levels within 14 ATR * 0.5 multipliers. As the price progress, it will automatically add levels and delete levels that do not come within this option.
What levels are included?
I have used traditional pivot calculation and included Daily, Weekly, Monthly, Quarterly, and Yearly pivots with high and low.
What options are available?
You can replace the yearly timeframe with your desired time frame and can adjust the ATR multiplier to increase or decrease display levels.
Use this in 5m, 15m, or 1H chart or any timeframe below Daily.
Please like, share, and comment.
Tìm kiếm tập lệnh với "weekly"

ETH Gravity OscillatorThis indicator is a deviation of a Center of Gravity Oscillator corrected for the diminishing returns of Ethereum.
I've set up this indicator for it to be used on the weekly timeframe . The indicator oscillates between 0 and 10, where 0 indicates oversold conditions and 10 indicates overbought conditions. What is interesting is that it is not particularly ideal for identifying market cycle tops, but generally picks out the most euphoric region in the initial parabolic rally. Good to potentially keep in mind if there is a second bounce to the peak!
The indicator plots in any ETH charts. It paints in all time frames, but Weekly time frame is the correct one to interpret the 'official' read of it.
Made at the request of a kind commenter. If you would like to request different derivations of this script be sure to let me know!

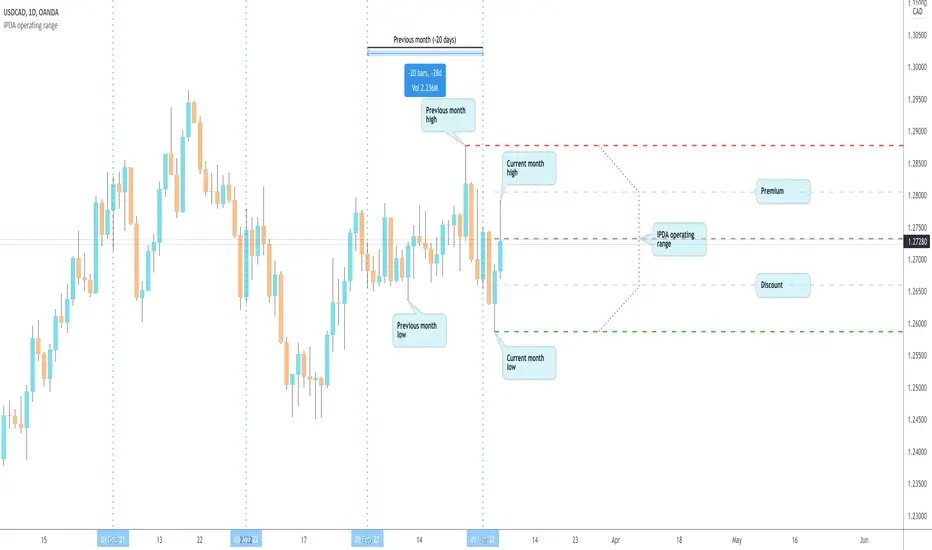
IPDA operating range by makuchakuDetermining operating range is critical for trading.
You *need* to sell in premium & buy in discount.
This script determines an operating range by stepping back on an HTF timeframe to calculate that HTF candle's range. If the current candle in HTF breaks out, the range expands accordingly.
The timeframe mapping I've used is
Intraday & <= 2H : use Daily as HTF range
Intraday & > 2H : use Weekly as HTF range
Daily : use Monthly as HTF range
Weekly : use 6 Months as HTF range
The HTF mapping is my own personal preference. If you prefer, you can easily copy the indicator and create your own mapping.
Once the HTF range is known, the indicator also plots 0%, 25%, 50% and 100% levels.
BTC Gravity OscillatorThis indicator is a deviation of a Center of Gravity Oscillator corrected for the diminishing returns of Bitcoin.
I've set up this indicator for it to be used on the weekly timeframe. The indicator oscillates between 0 and 10, where 0 indicates oversold conditions and 10 indicates overbought conditions.
The indicator plots in any BTCUSD spot, futures , BLX index and BTCEUR .
It paints in all time frames, but Weekly time frame is the correct one to interpret the 'official' read of it.

investor_EMA Three-CrossI produced a strategy using short term ema intersections.
A short-term low capital buy signal creates a yellow background after the red background color. Here, profit should be taken by following the trend.
When the green background is formed, positions can be increased, the price will lead us to a safer market.
Exposures can be turned off in the formation of a red background.
The pink zigzag average always shows the Weekly ma9. Price should be followed above the MA9 weekly average which will allow us to see medium term positive price movements.
As a result, the background colors will present a more understandable graph in price movements up and down movements.
The above strategy will generate signals as long and short.
You can make the coloring you want from the settings section.

MTF Custom Moving AveragesThis user-friendly indicator allows up to 8 moving averages ( EMA or SMA ) from any timeframe, on any time frame. There are plenty of other MTF MA indicators, each with their own pros and cons. I wanted to make one without the cons:
- Independently set each MA to Exponential or Simple
- No preset lengths
- No preset timeframes
- Optional labels to help keep track of the period/length/type of each plot
- Clean, intuitive input layout
- More than enough MAs available to use one indicator for several use cases... just check/uncheck the ones that are relevant to each chart
Watch for death crosses on the 4hr while monitoring the "Bull Market Support band" (Weekly 21 EMA and 20 SMA ) and checking the Monthly 10 EMA for major support or resistance. Toggle between half of the available MAs for long term BTC trends and use the others for your alts. Use this one indicator to support multiple strategies.
Please leave a comment if you find it useful or have suggestions!
Inspired by the first MTF indicator I found: Weekly Moving Average by TommyTompsen.
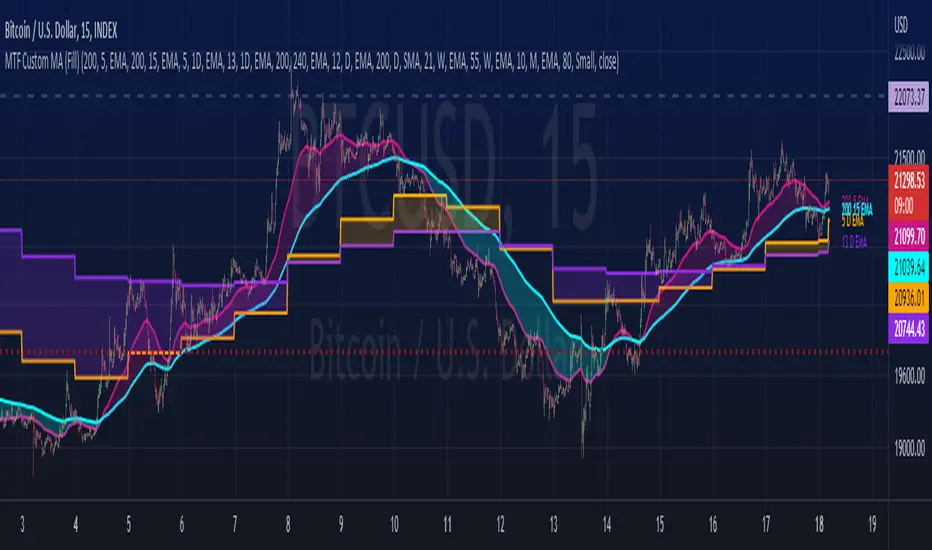
Chart Map[netguard] V1.0Chart map is a indicator that shows best levels of price.
on this indicator we divided ATH and ATL of chart to 16/32 levels that each one of them can control price and candles.
furthermore you can use weekly or daily map in this indicator.in weekly map we divide High to Low of last week candle to 8 levels that these levels can control candles too.
In general, these levels act as strong support and resistance.
you can trade on these levels with candle patterns.

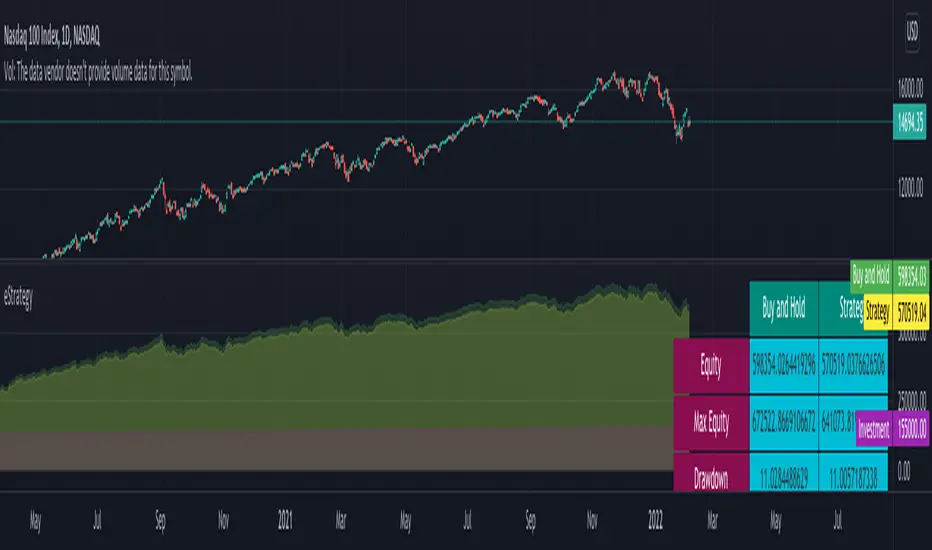
eStrategyLibrary "eStrategy"
Library contains methods which can help build custom strategy for continuous investment plans and also compare it with systematic buy and hold.
sip(startYear, initialDeposit, depositFrequency, recurringDeposit, buyPrice) Depicts systematic buy and hold over period of time
Parameters:
startYear : Year on which SIP is started
initialDeposit : Initial one time investment at the start
depositFrequency : Frequency of recurring deposit - can be monthly or weekly
recurringDeposit : Recurring deposit amount
buyPrice : Indicatinve buy price. Use high to be conservative. low, close, open, hl2, hlc3, ohlc4, hlcc4 are other options.
Returns: totalInvestment - initial + recurring deposits
totalQty - Quantity of units held for given instrument
totalEquity - Present equity
customStrategy(startYear, initialDeposit, depositFrequency, recurringDeposit, buyPrice, sellPrice, initialInvestmentPercent, recurringInvestmentPercent, signal, tradePercent) Allows users to define custom strategy and enhance systematic buy and hold by adding take profit and reloads
Parameters:
startYear : Year on which SIP is started
initialDeposit : Initial one time investment at the start
depositFrequency : Frequency of recurring deposit - can be monthly or weekly
recurringDeposit : Recurring deposit amount
buyPrice : Indicatinve buy price. Use high to be conservative. low, close, open, hl2, hlc3, ohlc4, hlcc4 are other options.
sellPrice : Indicatinve sell price. Use low to be conservative. high, close, open, hl2, hlc3, ohlc4, hlcc4 are other options.
initialInvestmentPercent : percent of amount to invest from the initial depost. Keep rest of them as cash
recurringInvestmentPercent : percent of amount to invest from recurring deposit. Keep rest of them as cash
signal : can be 1, -1 or 0. 1 means buy/reload. -1 means take profit and 0 means neither.
tradePercent : percent of amount to trade when signal is not 0. If taking profit, it will sell the percent from existing position. If reloading, it will buy with percent from cash reserve
Returns: totalInvestment - initial + recurring deposits
totalQty - Quantity of units held for given instrument
totalCash = Amount of cash held
totalEquity - Overall equity = totalQty*close + totalCash
Moving Average CombinationsThis moving average indicator is used to plot either EMA or SMA as per users choice. User also has the options to choose different type of sources for each of the moving average lines like high, low, close etc. Again, flexibility is added to plot moving averages of different timeframe than the current timeframe of the chart. By doing so in daily chart user can plot averages of different timeframe like hourly, weekly or monthly and vice versa. Length is also as per the choice of the user.
So for a example, in a daily timeframe chart you can plot 9SMA High Daily, 200EMA Close 1Hr, 200EMA Close 2Hr, 200EMA Close Daily, 9SMA High Weekly and so on. This will help in play moving average crossovers and contractions.
Label for each moving average line is also added.

PA Trading v1PA Trading v1 will basically help you find the weekly and monthly strong support resistance points by automatically drawing lines for Daily opening, monday high and low, Weekly opening, Monthly opening, Last week's opening and last month's opening points on the chart.

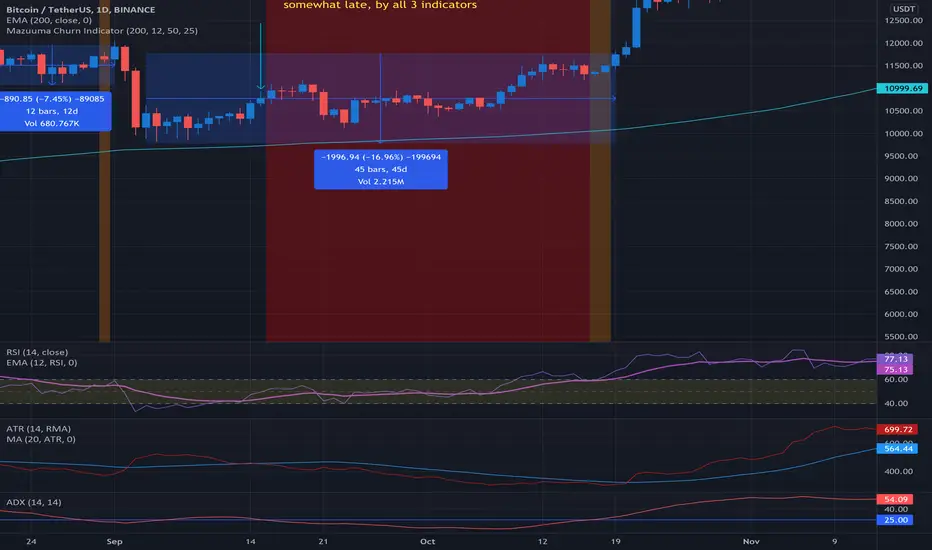
Mazuuma Churn IndicatorThis indicator was specifically made to confirm a periode of sideways movement (churn) on Bitcoin. It can probably be used for other cryptocurrencies as well. I use it on the daily timeframe.
Yellow means "Unconfirmed".
Orange means "Partially Confirmed".
Red means "Confirmed"
The indicator is not perfect, so use your common sense.
Churn starts when at least 2 of the conditions below are met (use also your common sense):
1. ATR < MA 20 on ATR
2. Distance to EMA 200 must be ≤ 16% at “Open churn”
3. EMA 12 on RSI between 40 and 60
4. ADX < 25
The above are weighted. Meaning no 1 has most significance. The numbers can be tweaked.
Reversal coming
* The indicators above break out, especially the ATR
* Color shift of the Heikin Ashi candle on weekly timeframe
* Engulfing candle on weekly timeframe
Because of the offset of the EMA 200, the precision of the Churn predictor can be off after a VERY big spike up or down, e.g. dec 2017. After such a spike use your common sense.
Personally I use this for bot trading, i.e. turn off trend following bots when in sideways market and use grid bots or other means of trading instead.
Support Resistance Zones using confluence & Std. DeviationOverview:
This indicator takes (interactive) input from the user for support and resistance levels and plots important zones considering the other confluence levels in the indicator.
Working of indicator:
This indicator takes six input of Support/resistance level form the user
It has following 32 confluence levels
a.4 Recent positive Divergence levels (DN1, DN2, DN3, DN4)
b.4 recent negative divergence levels (DP1, DP2, DP3, DP4)
d.5 Fibonacci levels (Fib0, Fib236, Fib5, Fib618, Fib786)
e. 7 Pivot levels (P, PR1, PR2, PR3, PS1, PS2, PS3)
f.4 EMAs (E20, E200, E100, E50)
g. ATH, ATL, Weekly High, Weekly Low, two days ago high, two days ago low, previous day high , previous day low
The code checks nearest ‘n’ CONFLUENCE for each level (“Number of confluences to check”) in the indicator, after getting the nearest confluence it calculates the standard deviation of those levels WITH RESPECT TO THE MANUAL INPUT LEVELS.
If the Std. Deviation is less than the input value (“Minimum standard deviation” option) then the zone is displayed on the chart.
How to use:
Add the indicator on the chart select your important support and resistance levels.
Set standard deviation, if the confluence is less than the input standard deviation then you will see those zones on the chart.
You can display all divergence levels; you can display all fib levels. All confluences can be displayed by using the setting of the indicator
How to read the indicator values:
The zone will show all the confluence it has in its zone,
Example:
Table details:
The table shows the maximum and minimum deviation out of all six levels .To see at least one zone you have to make sure that Input value Std. Deviation must be greater than Min Std. Deviation of the table
Sources & refences :
Big thank to www.pinecoders.com and kodify.net
Standard deviation :
www.investopedia.com
function to find 'k' closest elements :
www.techiedelight.com
Interactive support resistance :
Divergence for many indicators:
Auto fib level by DGT:
www.tradingview.com

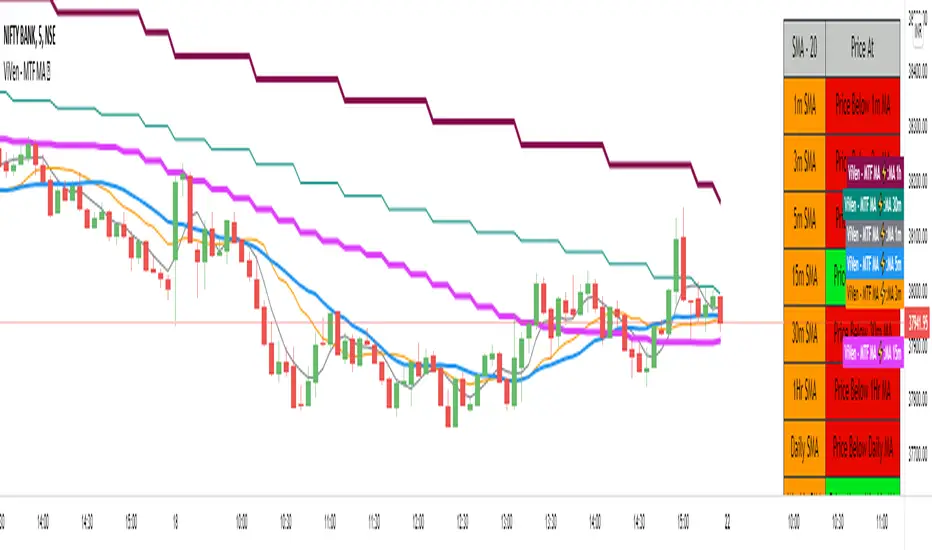
ViVen - Multi Time Frame - Moving Average StrategyHi Traders,
Indicator Description : Multiple Time Frame Moving Average lines in One Chart.
Moving Average Types : SMA, WMA, EMA
Moving Average Period : 20 Default (Variable up to 200)
MA Time Frame : 1m, 3m, 5m, 15m, 30m, 1Hr, Daily, Weekly, Monthly (All lines in one chart)
You can turn ON/OFF the moving average lines based on your requirement.
Moving Average Table : The table will give you an idea where the price is currently trading (LTP), if the price is above any of the moving average then it will show you the Price is above MA and wise versa.
Trading Method:
Monthly, Weekly, Daily and 1Hr Moving averages will tell you whether the script is in Bullish Trend or Bearish Trend.
Basically the moving averages will act as Support and Resistance Levels. With candle confirmation you can take trade.
Ready to Take Position - When 1m MA Crosses 3m MA (Upside / Downside)
BUY Strategy:
"Buy" - when 3m MA breaks 5m moving average on the upside. (Intraday/Scalp)
"Hold" - when 5m MA breaks 15m MA on the upside.
"Strong Hold" - when 15m MA breaks 1Hr MA on the upside for Long term.
"Exit" - when 3m MA breaks 5m MA on the Downside.
SELL Strategy:
"Sell" - when 3m MA breaks 5m moving average on the Downside. (Intraday/Scalp)
"Hold" - when 5m MA breaks 15m MA on the Downside. (Intraday)
"Strong Hold" - when 15m MA breaks 1Hr MA on the Downside. (Positional).
"Exit" - when 3m MA breaks 5m MA on the Downside.
If you agree with this strategy and works well please like this script, share it with your friends and Follow me for more Indicators.
In the next Version, I will come up with Strategy table that I have explained here.
Thanks for your support.
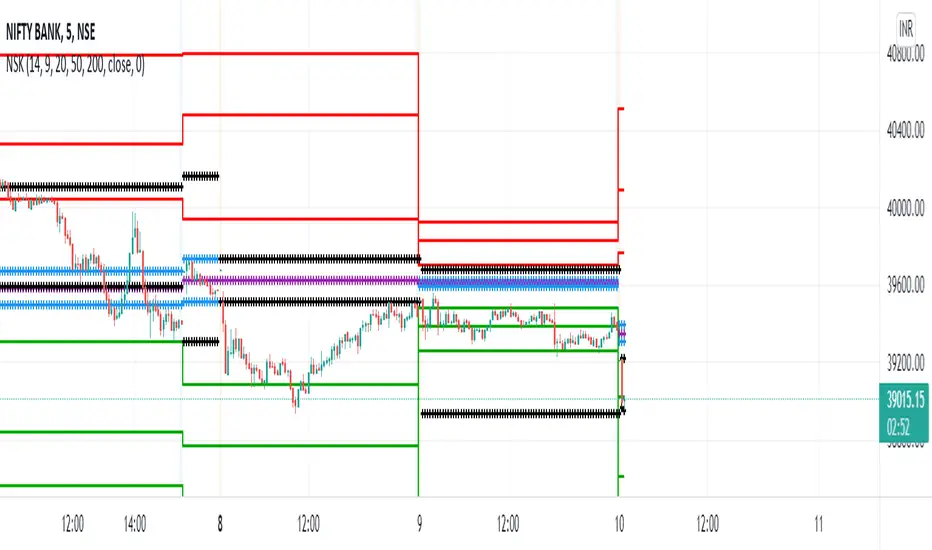
NSK CRPIndicator Daily CPR, daily/weekly/monthly Pivot points, daily/weekly/monthly high and low and EMA for self use prepared by picking up stuff from collaborators here. Thanks for the community.
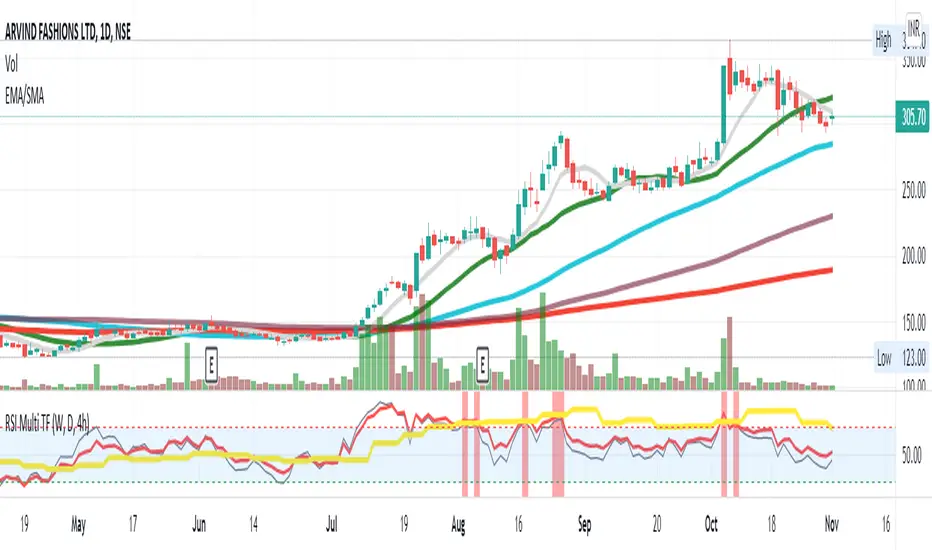
RSI Multi TF strategy
The RSI is a very popular indicator that follows price activity.
It calculates an average of the positive net changes, and an average
of the negative net changes in the most recent bars, and it determines
the ratio between these averages. The result is expressed as a number
between 0 and 100. Commonly it is said that if the RSI has a low value,
for example, 30 or under, the symbol is oversold. And if the RSI has a
high value, 70 for example, the symbol is overbought.
Plots 3 RSI (Weekly, Daily, 4h) at the same time, regardless of the Chart Timeframe.
Highlights in green (or red) if all RSI is oversold (or overbought).
Can trigger custom oversold and overbought alerts when all 3 lines grey(4h), yellow(weekly), and red(daily) go in the oversold or overbought zone. The strongest the curves break the barrier the strongest the alert (vertical red and green bars) shows.
Dual MACD StrategyThis strategy Multi Time Frame Macd Indicator
We take the first long position when we have a buy signal in Weekly Macd (Macd line crosses above Signal line). This open a trading window, showed with green background color
We close the first position when either Weekly or Daily Macd give us a sell signal ((Macd line crosses below Signal line))
Enable Profit and Stop in strategy settings with different percentage to backtest the strategy. Also if it is better to use a Traditional Stop Loss or a Trailing Stop Loss based on a percentage from low prices
Change macd resolution in settings for other time frames to test the strategy
This Strategy was tested on Crypto Market with good results in assets as BTC, ETH, BNB, ADA, LTC, XLM, BCH, among others
