(Early Test) Weekly Seasonality with Dynamic Kelly Criterion# Enhancing Trading Strategies with the Weekly Seasonality Dynamic Kelly Criterion Indicator
Amidst this pursuit to chase price, a common pitfall emerges: an overemphasis on price movements without adequate attention to risk management, probabilistic analysis, and strategic position sizing. To address these challenges, I developed the **Weekly Seasonality with Dynamic Kelly Criterion Indicator**. It is designed to refocus traders on essential aspects of trading, such as risk management and probabilistic returns, thereby catering to both short-term swing traders and long-term investors aiming for tax-efficient positions.
## The Motivation Behind the Indicator
### Overemphasis on Price: A Common Trading Pitfall
Many traders concentrate heavily on price charts and technical indicators, often neglecting the underlying principles of risk management and probabilistic analysis. This overemphasis on price can lead to:
- **Overtrading:** Making frequent trades based solely on price movements without considering the associated risks.
- **Poor Risk Management:** Failing to set appropriate stop-loss levels or position sizes, increasing the potential for significant losses.
- **Emotional Trading:** Letting emotions drive trading decisions rather than objective analysis, which can result in impulsive and irrational trades.
### The Need for Balanced Focus
To achieve sustained trading success, it is crucial to balance price analysis with robust risk management and probabilistic strategies. Key areas of focus include:
1. **Risk Management:** Implementing strategies to protect capital, such as setting stop-loss orders and determining appropriate position sizes based on risk tolerance.
2. **Probabilistic Analysis:** Assessing the likelihood of various market outcomes to make informed trading decisions.
3. **Swing Trading Percent Returns:** Capitalizing on short- to medium-term price movements by buying assets below their average return and selling them above.
## Introducing the Weekly Seasonality with Dynamic Kelly Criterion Indicator
The **Weekly Seasonality with Dynamic Kelly Criterion Indicator** is designed to integrate these essential elements into a comprehensive tool that aids traders in making informed, risk-aware decisions. Below, we explore the key components and functionalities of this indicator.
### Key Components of the Indicator
1. **Average Return (%)**
- **Definition:** The mean percentage return for each week across multiple years.
- **Purpose:** Serves as a benchmark to identify weeks with above or below-average performance, guiding buy and sell decisions.
2. **Positive Percentage (%)**
- **Definition:** The proportion of weeks that yielded positive returns.
- **Purpose:** Indicates the consistency of positive returns, helping traders gauge the reliability of certain weeks for trading.
3. **Volatility (%)**
- **Definition:** The standard deviation of weekly returns.
- **Purpose:** Measures the variability of returns, providing insights into the risk associated with trading during specific weeks.
4. **Kelly Ratio**
- **Definition:** A mathematical formula used to determine the optimal size of a series of bets to maximize the logarithmic growth of capital.
- **Purpose:** Balances potential returns against risks, guiding traders on the appropriate position size to take.
5. **Adjusted Kelly Fraction**
- **Definition:** The Kelly Ratio adjusted based on user-defined risk tolerance and external factors like Federal Reserve (Fed) stance.
- **Purpose:** Personalizes the Kelly Criterion to align with individual risk preferences and market conditions, enhancing risk management.
6. **Position Size ($)**
- **Definition:** The calculated amount to invest based on the Adjusted Kelly Fraction.
- **Purpose:** Ensures that position sizes are aligned with risk management strategies, preventing overexposure to any single trade.
7. **Max Drawdown (%)**
- **Definition:** The maximum observed loss from a peak to a trough of a portfolio, before a new peak is attained.
- **Purpose:** Assesses the worst-case scenario for losses, crucial for understanding potential capital erosion.
### Functionality and Benefits
- **Weekly Data Aggregation:** Aggregates weekly returns across multiple years to provide a robust statistical foundation for decision-making.
- **Quarterly Filtering:** Allows users to filter weeks based on quarters, enabling seasonality analysis and tailored strategies aligned with specific timeframes.
- **Dynamic Risk Adjustment:** Incorporates the Dynamic Kelly Criterion to adjust position sizes in real-time based on changing risk profiles and market conditions.
- **User-Friendly Visualization:** Presents all essential metrics in an organized Summary Table, facilitating quick and informed decision-making.
## The Origin of the Kelly Criterion and Addressing Its Limitations
### Understanding the Kelly Criterion
The Kelly Criterion, developed by John L. Kelly Jr. in 1956, is a formula used to determine the optimal size of a series of bets to maximize the long-term growth of capital. The formula considers both the probability of winning and the payout ratio, balancing potential returns against the risk of loss.
**Kelly Formula:**
\
Where:
- \( b \) = the net odds received on the wager ("b to 1")
- \( p \) = probability of winning
- \( q \) = probability of losing ( \( q = 1 - p \) )
### The Risk of Ruin
While the Kelly Criterion is effective in optimizing growth, it carries inherent risks:
- **Overbetting:** If the input probabilities or payout ratios are misestimated, the Kelly Criterion can suggest overly aggressive position sizes, leading to significant losses.
- **Assumption of Constant Probabilities:** The criterion assumes that probabilities remain constant, which is rarely the case in dynamic markets.
- **Ignoring External Factors:** Traditional Kelly implementations do not account for external factors such as Federal Reserve rates, margin requirements, or market volatility, which can impact risk and returns.
### Addressing Traditional Limitations
Recognizing these limitations, the **Weekly Seasonality with Dynamic Kelly Criterion Indicator** introduces enhancements to the traditional Kelly approach:
- **Incorporation of Fed Stance:** Adjusts the Kelly Fraction based on the current stance of the Federal Reserve (neutral, dovish, or hawkish), reflecting broader economic conditions that influence market behavior.
- **Margin and Leverage Considerations:** Accounts for margin rates and leverage, ensuring that position sizes remain within manageable risk parameters.
- **Dynamic Adjustments:** Continuously updates position sizes based on real-time risk assessments and probabilistic analyses, mitigating the risk of ruin associated with static Kelly implementations.
## How the Indicator Aids Traders
### For Short-Term Swing Traders
Short-term swing traders thrive on capitalizing over weekly price movements. The indicator aids them by:
- **Identifying Favorable Weeks:** Highlights weeks with above-average returns and favorable volatility, guiding entry and exit points.
- **Optimal Position Sizing:** Utilizes the Adjusted Kelly Fraction to determine the optimal amount to invest, balancing potential returns with risk exposure.
- **Probabilistic Insights:** Provides metrics like Positive Percentage (%) and Kelly Ratio to assess the likelihood of favorable outcomes, enhancing decision-making.
### For Long-Term Tax-Free Investors
This is effectively a drop-in replacement for DCA which uses fixed position size that doesn't change based on market conditions, as a result, it's like catching multiple falling knifes by the blade and smiling with blood on your hand... I don't know about you, but I'd rather juggle by the hilt and look like an actual professional...
Long-term investors, especially those seeking tax-free positions (e.g., through retirement accounts), benefit from:
- **Consistent Risk Management:** Ensures that position sizes are aligned with long-term capital preservation strategies.
- **Seasonality Analysis:** Allows for strategic positioning based on historical performance trends across different weeks and quarters.
- **Dynamic Adjustments:** Adapts to changing market conditions, maintaining optimal risk profiles over extended investment horizons.
### Developers
Please double check the logic and functionality because I think there are a few issue and I need to crowd source solutions and be responsible about the code I publish. If you have corrections, please DM me or leave a respectful comment.
I want to publish this by the end of the year and include other things like highlighting triple witching weeks, adding columns for volume % stats, VaR and CVaR, alpha, beta (to see the seasonal alpha and beta based off a benchmark ticker and risk free rate ticker and other little goodies.
Tìm kiếm tập lệnh với "weekly"

CANSLIM IBD Relative Strength NIFTYSMLCAP250 (Daily & Weekly)This Pine Script (written in version 5) is designed to calculate the IBD Relative Strength for both daily and weekly timeframes, comparing the current chart's security to the NIFTY SMLCAP 250 index. Here's a breakdown of the code:
1. Indicator Initialization: This line sets up the indicator with both a short and full title. The overlay=true means the plot will be drawn on top of the price chart.
2. Fetching Data: This fetches the daily ("D") and weekly ("W") close prices for the NIFTY SMLCAP 250 index.
3. Relative Strength Calculation: Relative strength is calculated as the ratio of the security's current close price to the close price of the NIFTY SMLCAP 250, multiplied by 100 for both daily and weekly timeframes.
4. Timeframe-Based Selection: Here, the script checks whether the chart is in daily or weekly mode and selects the corresponding relative strength value.
5. Scaling with Multiplier: This section ensures there are at least 60 bars of data and scales the relative strength by using a multiplier derived from the 60th previous bar's close price.
6. Plotting: Finally, the scaled relative strength is plotted on the chart in black.
Improvements :
Dynamic Timeframe Handling: You might want to extend this for other timeframes, e.g., monthly.
Customization: You can add user input parameters to adjust the timeframe, scale factor, or period dynamically.
Color Enhancements: You can add color variation to indicate strength/weakness more clearly.

Adaptive MFT Extremum Pivots [Elysian_Mind]Adaptive MFT Extremum Pivots
Overview:
The Adaptive MFT Extremum Pivots indicator, developed by Elysian_Mind, is a powerful Pine Script tool that dynamically displays key market levels, including Monthly Highs/Lows, Weekly Extremums, Pivot Points, and dynamic Resistances/Supports. The term "dynamic" emphasizes the adaptive nature of the calculated levels, ensuring they reflect real-time market conditions. I thank Zandalin for the excellent table design.
---
Chart Explanation:
The table, a visual output of the script, is conveniently positioned in the bottom right corner of the screen, showcasing the indicator's dynamic results. The configuration block, elucidated in the documentation, empowers users to customize the display position. The default placement is at the bottom right, exemplified in the accompanying chart.
The deliberate design ensures that the table does not obscure the candlesticks, with traders commonly situating it outside the candle area. However, the flexibility exists to overlay the table onto the candles. Thanks to transparent cells, the underlying chart remains visible even with the table displayed atop.
In the initial column of the table, users will find labels for the monthly high and low, accompanied by their respective numerical values. The default precision for these values is set at #.###, yet this can be adjusted within the configuration block to suit markets with varying degrees of volatility.
Mirroring this layout, the last column of the table presents the weekly high and low data. This arrangement is part of the upper half of the table. Transitioning to the lower half, users encounter the resistance levels in the first column and the support levels in the last column.
At the center of the table, prominently displayed, is the monthly pivot point. For a comprehensive understanding of the calculations governing these values, users can refer to the documentation. Importantly, users retain the freedom to modify these mathematical calculations, with the table seamlessly updating to reflect any adjustments made.
Noteworthy is the table's persistence; it continues to display reliably even if users choose to customize the mathematical calculations, providing a consistent and adaptable tool for informed decision-making in trading.
This detailed breakdown offers traders a clear guide to interpreting the information presented by the table, ensuring optimal use and understanding of the Adaptive MFT Extremum Pivots indicator.
---
Usage:
Table Layout:
The table is a crucial component of this indicator, providing a structured representation of various market levels. Color-coded cells enhance readability, with blue indicating key levels and a semi-transparent background to maintain chart visibility.
1. Utilizing a Table for Enhanced Visibility:
In presenting this wealth of information, the indicator employs a table format beneath the chart. The use of a table is deliberate and offers several advantages:
2. Structured Organization:
The table organizes the diverse data into a structured format, enhancing clarity and making it easier for traders to locate specific information.
3. Concise Presentation:
A table allows for the concise presentation of multiple data points without cluttering the main chart. Traders can quickly reference key levels without distraction.
4. Dynamic Visibility:
As the market dynamically evolves, the table seamlessly updates in real-time, ensuring that the most relevant information is readily visible without obstructing the candlestick chart.
5. Color Coding for Readability:
Color-coded cells in the table not only add visual appeal but also serve a functional purpose by improving readability. Key levels are easily distinguishable, contributing to efficient analysis.
Data Values:
Numerical values for each level are displayed in their respective cells, with precision defined by the iPrecision configuration parameter.
Configuration:
// User configuration: You can modify this part without code understanding
// Table location configuration
// Position: Table
const string iPosition = position.bottom_right
// Width: Table borders
const int iBorderWidth = 1
// Color configuration
// Color: Borders
const color iBorderColor = color.new(color.white, 75)
// Color: Table background
const color iTableColor = color.new(#2B2A29, 25)
// Color: Title cell background
const color iTitleCellColor = color.new(#171F54, 0)
// Color: Characters
const color iCharColor = color.white
// Color: Data cell background
const color iDataCellColor = color.new(#25456E, 0)
// Precision: Numerical data
const int iPrecision = 3
// End of configuration
The code includes a configuration block where users can customize the following parameters:
Precision of Numerical Table Data (iPrecision):
// Precision: Numerical data
const int iPrecision = 3
This parameter (iPrecision) sets the precision of the numerical values displayed in the table. The default value is 3, displaying numbers in #.### format.
Position of the Table (iPosition):
// Position: Table
const string iPosition = position.bottom_right
This parameter (iPosition) sets the position of the table on the chart. The default is position.bottom_right.
Color preferences
Table borders (iBorderColor):
// Color: Borders
const color iBorderColor = color.new(color.white, 75)
This parameters (iBorderColor) sets the color of the borders everywhere within the window.
Table Background (iTableColor):
// Color: Table background
const color iTableColor = color.new(#2B2A29, 25)
This is the background color of the table. If you've got cells without custom background color, this color will be their background.
Title Cell Background (iTitleCellColor):
// Color: Title cell background
const color iTitleCellColor = color.new(#171F54, 0)
This is the background color the title cells. You can set the background of data cells and text color elsewhere.
Text (iCharColor):
// Color: Characters
const color iCharColor = color.white
This is the color of the text - titles and data - within the table window. If you change any of the background colors, you might want to change this parameter to ensure visibility.
Data Cell Background: (iDataCellColor):
// Color: Data cell background
const color iDataCellColor = color.new(#25456E, 0)
The data cells have a background color to differ from title cells. You can configure this is a different parameter (iDataColor). You might even set the same color for data as for the titles if you will.
---
Mathematical Background:
Monthly and Weekly Extremums:
The indicator calculates the High (H) and Low (L) of the previous month and week, ensuring accurate representation of these key levels.
Standard Monthly Pivot Point:
The standard pivot point is determined based on the previous month's data using the formula:
PivotPoint = (PrevMonthHigh + PrevMonthLow + Close ) / 3
Monthly Pivot Points (R1, R2, R3, S1, S2, S3):
Additional pivot points are calculated for Resistances (R) and Supports (S) using the monthly data:
R1 = 2 * PivotPoint - PrevMonthLow
S1 = 2 * PivotPoint - PrevMonthHigh
R2 = PivotPoint + (PrevMonthHigh - PrevMonthLow)
S2 = PivotPoint - (PrevMonthHigh - PrevMonthLow)
R3 = PrevMonthHigh + 2 * (PivotPoint - PrevMonthLow)
S3 = PrevMonthLow - 2 * (PrevMonthHigh - PivotPoint)
---
Code Explanation and Interpretation:
The table displayed beneath the chart provides the following information:
Monthly Extremums:
(H) High of the previous month
(L) Low of the previous month
// Function to get the high and low of the previous month
getPrevMonthHighLow() =>
var float prevMonthHigh = na
var float prevMonthLow = na
monthChanged = month(time) != month(time )
if (monthChanged)
prevMonthHigh := high
prevMonthLow := low
Weekly Extremums:
(H) High of the previous week
(L) Low of the previous week
// Function to get the high and low of the previous week
getPrevWeekHighLow() =>
var float prevWeekHigh = na
var float prevWeekLow = na
weekChanged = weekofyear(time) != weekofyear(time )
if (weekChanged)
prevWeekHigh := high
prevWeekLow := low
Monthly Pivots:
Pivot: Standard pivot point based on the previous month's data
// Function to calculate the standard pivot point based on the previous month's data
getStandardPivotPoint() =>
= getPrevMonthHighLow()
pivotPoint = (prevMonthHigh + prevMonthLow + close ) / 3
Resistances:
R3, R2, R1: Monthly resistance levels
// Function to calculate additional pivot points based on the monthly data
getMonthlyPivotPoints() =>
= getPrevMonthHighLow()
pivotPoint = (prevMonthHigh + prevMonthLow + close ) / 3
r1 = (2 * pivotPoint) - prevMonthLow
s1 = (2 * pivotPoint) - prevMonthHigh
r2 = pivotPoint + (prevMonthHigh - prevMonthLow)
s2 = pivotPoint - (prevMonthHigh - prevMonthLow)
r3 = prevMonthHigh + 2 * (pivotPoint - prevMonthLow)
s3 = prevMonthLow - 2 * (prevMonthHigh - pivotPoint)
Initializing and Populating the Table:
The myTable variable initializes the table with a blue background, and subsequent table.cell functions populate the table with headers and data.
// Initialize the table with adjusted bgcolor
var myTable = table.new(position = iPosition, columns = 5, rows = 10, bgcolor = color.new(color.blue, 90), border_width = 1, border_color = color.new(color.blue, 70))
Dynamic Data Population:
Data is dynamically populated in the table using the calculated values for Monthly Extremums, Weekly Extremums, Monthly Pivot Points, Resistances, and Supports.
// Add rows dynamically with data
= getPrevMonthHighLow()
= getPrevWeekHighLow()
= getMonthlyPivotPoints()
---
Conclusion:
The Adaptive MFT Extremum Pivots indicator offers traders a detailed and clear representation of critical market levels, empowering them to make informed decisions. However, users should carefully analyze the market and consider their individual risk tolerance before making any trading decisions. The indicator's disclaimer emphasizes that it is not investment advice, and the author and script provider are not responsible for any financial losses incurred.
---
Disclaimer:
This indicator is not investment advice. Trading decisions should be made based on a careful analysis of the market and individual risk tolerance. The author and script provider are not responsible for any financial losses incurred.
Kind regards,
Ely

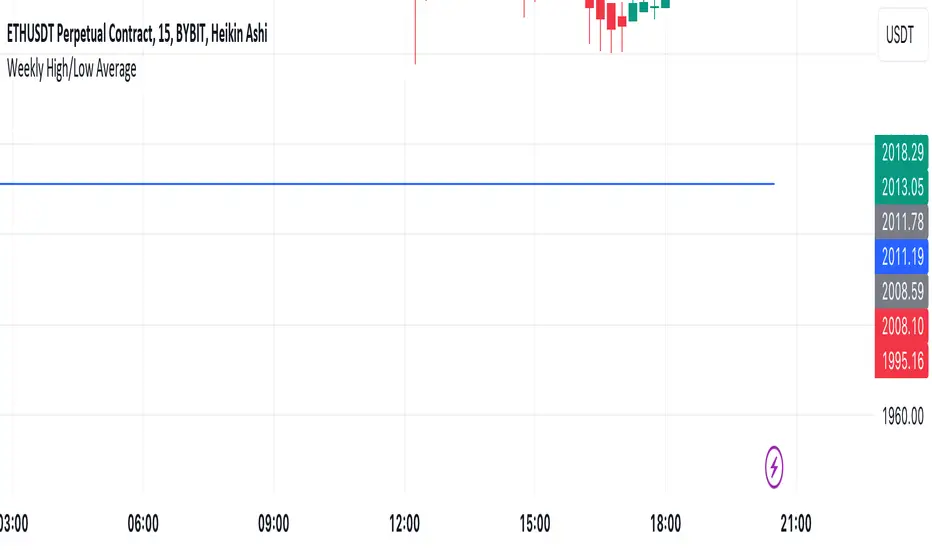
Mtl Weekly This Pine Script indicator for TradingView calculates and plots a line on the weekly chart, representing the average of the weekly high and low prices. The script uses conditional statements to determine and update the weekly high and low values. The calculated average is then plotted as a line on the chart in blue color. This indicator helps visualize the central point between weekly highs and lows, providing insights into potential trend directions.
VWAP Balance ZonesVWAP Balance Zones (VBZ) Is based on 3 concepts.
Many Traders use VWAP to help determine Price Trends.
Trends are typically identified by new Highs or new Lows.
Balanced is found when Supply and Demand are mostly Equal.
VBZ tracks the daily, weekly, and monthly highs and lows; Then plots the average (50%) between the VWAP and the respective extremes.
50% VWAP Zones can be considered significant since they attempt to identify the equilibrium between market participants within the current trend, serving as key reference points to consider for decision making. >While in an uptrend, Buyers may see price falling to the Hi 50% as an attractive value entry for the continuation upwards.
>While ALSO in an uptrend, Sellers may see price falling to the Hi 50% as a change in sentiment with more downwards movement on the way.
Because of these conflicting mindsets, these zones are thought to display areas of balance between buyers and sellers, which can serve as potential decision points throughout the day.
VBZ Draws Zones from the Daily (High/Low/Close) VWAPs and the Day's (High/Low/Close) extremes as seen below.
Technically speaking, an average between vwap and extreme is a single point, to make these into zones I am using multiple sources for vwap and tracking different points of the bar throughout the day (ex. Close VWAP & Daily Highest Close)
Weekly and Monthly are only displaying the Average Price between the VWAP and the (Weekly or Monthly) High/Low.
These hold up as important levels for speculation; however, since most action will be discovered at the daily zones, I am not displaying the zones for the Weekly and Monthly to keep noise to a minimum.
Unique Behaviors:
- Weekly values are hidden on the first day of the week since they are similar to the daily values on the first day of the week.
- Monthly values are hidden in the first week of the month for the same reason.

TASC 2023.09 The Weekly Factor█ OVERVIEW
TASC's September 2023 edition of Traders' Tips features an article written by Andrea Unger titled “The Weekly Factor", discussing the application of price patterns as filters for trade entries. This script implements a sample trading strategy presented in the article for demonstration purposes only. It explores how the strategy's equity curve might benefit from filtering trade entries using a specific price pattern.
█ CONCEPTS
Pattern filters represent valuable tools that assess current market conditions based on price movements and determine when those conditions become more favorable for trade entries.
The filter used and tested in this article is a metric called the "weekly factor", which measures the price range over the last five trading days and compares it to the open of the session five days ago and the close of the session one day ago (i.e., the "body" of the five-day period). When the five-day body is small compared to the five-day range, this could indicate "indecision" or "compression", potentially followed by a price expansion. Thus, the weekly factor metric can help identify areas in the market where a period of compression might signal a potential breakout.
This script demonstrates the use of the weekly factor for a sample intraday trading strategy (intended for educational and exploratory purposes only). In this strategy, the entry signal is triggered when a 15-minute bar breaks out of the previous day's high-low range, and the position is closed at the end of the day.
█ CALCULATIONS
The script uses two timeframes:
• The strategy entries are processed on the 15-minute timeframe.
• The weekly factor is obtained from the daily timeframe using the request.security function and the following formula:
math.abs(open - close ) < RangeFilter * (ta.highest(5) - ta.lowest(5) )
Here, RangeFilter is an input that can be optimized to find the favorable ratio between the five-day body and the five-day range. Smaller RangeFilter values will lead to fewer trade entries. A RangeFilter value of 1 is equivalent to turning off the filtering altogether.

CPR Weekly Variable Weekday SellerGood afternoon traders,
This is a script I built for option selling, in attempt to have a high success rate. This is pretty much the same as my other one titled "CPR Option Selling Strategy." The difference is this one is strictly for Weeklies, with a variable weekday to expiry. I've had many requests to have a weekly that would end on Thursday, so here it is. Just select the date for expiry of the option, then it will calculate a "weekly" option set, using the the same set up as the traditional M-F weekly CPR information, except for offset for the weekday in question.
So for expiry dates for options on Thursday, you would choose "Thursday" in the parameters and it will calculate using Fri through Thu data for the pivot timeframes.
The rest is like this...
The gist of how it works:
It uses the opening or close of the current chart's timeframe opening bar when referenced against a "weekly" timeframe determined by the week ending weekday chosen for the central pivot range ( CPR ).
Using that comparison, this script calculates an option to sell: put, call, or iron condor. It will calculate a call value using an average of the CPR central pivot and the max value of the prior higher timeframe's high or R1 (whichever is higher.)
It does the same for the put side, but uses the higher timeframe's low or S1 (whichever is lower.)
It will use the option on the other side of the source (open or close) of the CPR as the "option in play."
Settings:
There are many settings, most are simply "viewable" settings, and probably self explanatory, others, not so much:
"Source for Trigger" - this is the value used on the "opening bar," such as the close. This value is the one compared to the Central Pivot Range in determining whether to sell a call (if the source is lower,) sell a put (if the source is higher,) or an iron condor if it's in the CPR .
"Show Historical Win/Loss Percentages" - this shows a table in the bottom right of the W/L percentages for the current ticker and settings. Used for a quick glance at historical success rates.
Example use (OLD EXAMPLE):
An example use (which I completed last week) on the chart referenced in this share: I sold a put-spread for $0.90, selling a 590 and buying a 570 strike in the middle of the week. I was looking at an hourly timeframe chart with a weekly pivot timeframe for the strategy.
Obviously, making only $0.90 on a $20 spread, there is a lot more to lose than to make, but I did some other analysis to go with it, so I felt safe, and I had a stop set for $1.50. So it worked, along with 3 other plays I did, very similar, and if that "Historical Win/Loss Percentage" is accurate, which I am fairly certain it is, I felt good about it.
The key all comes down to what you sell it for, right? That piece only you can determine. :)
Happy trading and enjoy,
Deuce

Daily/Weekly ExtremesBACKGROUND
This indicator calculates the daily and weekly +-1 standard deviation of the S&P 500 based on 2 methodologies:
1. VIX - Using the market's expectation of forward volatility, one can calculate the daily expectation by dividing the VIX by the square root of 252 (the number of trading days in a year) - also know as the "rule of 16." Similarly, dividing by the square root of 50 will give you the weekly expected range based on the VIX.
2. ATR - We also provide expected weekly and daily ranges based on 5 day/week ATR.
HOW TO USE
- This indicator only has 1 option in the settings: choosing the ATR (default) or the VIX to plot the +-1 standard deviation range.
- This indicator WILL ONLY display these ranges if you are looking at the SPX or ES futures. The ranges will not be displayed if you are looking at any other symbols
- The boundaries displayed on the chart should not be used on their own as bounce/reject levels. They are simply to provide a frame of reference as to where price is trading with respect to the market's implied expectations. It can be used as an indicator to look for signs of reversals on the tape.
- Daily and Weekly extremes are plotted on all time frames (even on lower time frames).

The Flip Backgrounds - Weekly & HourlyDescription
This indicator creates vertical background bands of larger timeframes when viewing lower timeframes so the trader can keep track of the larger timeframes when they are zoomed in on lower timeframes. This script displays hourly and weekly backgrounds. When the timeframe is thirty minutes or lower, hourly backgrounds are displayed. When the timeframe is greater or equal to an hour, then weekly backgrounds are displayed. The weekly backgrounds are great for spotting price movement over a weeks span. Many times price will go up the first part of the week and then come right back down in the second half (or vice versa). The weekly background makes these trends easy to spot.
The Flip
When a new candle forms, on any timeframe, this is referred to as "the flip". The most prominent flip is the hourly timeframe because intraday price action can be clearly seen with the hour timeframe. This is where this script gets its name. Also, since the stock market opens on the bottom of the hour, the hourly background start on the bottom of the hour as well.
Style
The hourly and weekly backgrounds can be independently toggled on and off for ease of use. The hourly and weekly vertical backgrounds are split into alternating colors. Each of these colors can be individually chosen (along with transparency) to match the trader chart colors.
Note: the weekly backgrounds logic in this script keeps track of the weeks by looking for Monday's. If the market is closed on a Monday, the weekly background will span two weeks.

MTF Key Levels - Support and ResistanceThis indicator shows how to Multi Time Frame (MTF) interpret levels:
Watch how price acts around these levels and how they can act as support/resistance and can be used as great confluence levels for your technical analysis.
This indicator displays:
VWAP Levels
Daily / Weekly / Monthly / Yearly
Within the chart above I have marked out how displaying these VWAP levels can provide support and resistance levels to be aware of.
Daily – Weekly - Monthly – Yearly Levels
O = Open / H = High / L = Low
pO = Previous Open / pH = Previous High / pL = Previous Low / pEQ = Previous Equlibrium
Having previous Low/High levels makes you aware of Swing Failure Patterns (SFP). Also the daily/weekly/monthly opening and previous opening can assist with the trend.
Daily Open: Gives you an idea who is in control for the day. This level very often acts as strong support or resistance.
Weekly Open: Indicates where the price is within the higher timeframe.
Monthly Open & Yearly Levels: Overview of direction for the whole month without looking at a monthly chart and Yearly chart
Line Options
Within the line options you can choose to have a clean chart and display a “short line”. These line length can be adjusted by the user.
Line just to the right.
Line across the screen.
Disclaimer: The Monthly and Yealy VWAP will only show on higher timeframes this is due to restriction of how many candles can be shown on the chart. The candles displayed need to go back to either the start of the month of year to be able to calculate their VWAPs.

Heiken Ashi MTF Strategy- IndicatorHello, this is both a strategy and indicator that revolves around Heikin Ashi candles.
In this case we take 3 different time frames, in this example we use daily , weekly and monthly.
The conditions for entry are :
For long : we check that we have a green daily candle, at the same time we check that the weekly and monthly candles are also green.
For short : We check that all candles, daily, weekly and monthly and red.
For exit of long : as soon as 1 of the 3 candles, daily or weekly or monthly converts to red, we exit.
For exit of short : as soon as 1 of the 3 candles converts to green, we exit.
This strategy- indicator can be adapted to any type of market.

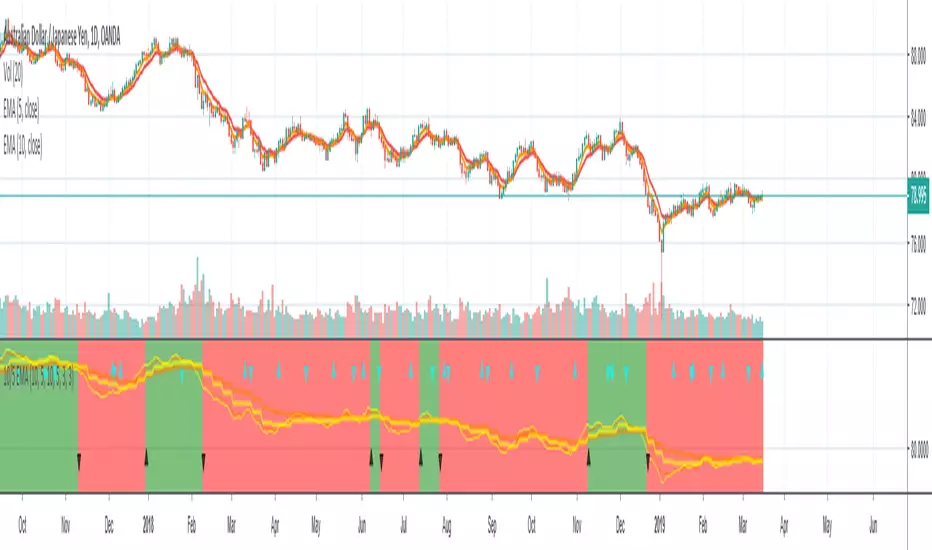
EMA with time-interval dependant visiblity settingThis scrip exposes 4 Exponential Moving Average (EMA) indicators which their visibility can be set to a daily or weekly time-frame (aka intervals). Based on your current chart time-frame, the matching EMA indicators come on and off.
This helps to have meaningful EMAs relevant to your time internal.
In a traditional 10 EMA indicates a plotted indicator would bear a meaning of a 10 day EMA when in daily and 10 week EMA when in weekly chart which may or may not be useful as some who for example only require a 10 week EMA for thier analysis and wouldn't want to cloud a daily chart with an EMA which won't resemble a valuable output for this particular user.
With EMA+, you can choose to see the 10 week EMA only when your chart is in the weekly time interval, so when switched to a daily interval a 10x EMA is not shown anymore.
If you prefer to see a 10 week EMA and a 21 day EMA on the other hand, you will only have 1 EMA shown when in weekly mode which is a 10 week EMA and one EMA when in daily mode with is 21 day EMA.

Rate Of Change - Weekly SignalsRate of Change - Weekly Signals
This indicator gives a potential "buy signal" using Rate of Change of SPX and VIX together,
using the following criteria:
SPX Weekly ROC(10) has been BELOW -9 and now rises ABOVE -5
*PLUS*
VIX Weekly ROC(10) has been ABOVE +80 and now falls BELOW +10
The background will turn RED when ROC(SPX) is below -9 and ROC(VIX) is above +80.
The background will turn GREEN when ROC(SPX) is above -5 and ROC(VIX) is below +10.
So the potential "buy signal" is when you start to get GREEN BARS AFTER RED - usually with
some white/empty bars in between...but wait for the green. This indicates that the volatility
has settled down, and the market is starting to turn up.
This indicator gives excellent entry points, but be careful of the occasional false signals.
See Nov. 2001 and Nov. 2008, in both cases the market dropped another 25-30% before the final
bottom was formed. Always have an exit strategy, especially when buying in after a downtrend.
How I use this indicator, pretty much as shown in the preview. Weekly SPX as the main chart with
some medium/long moving averages to identify the trend, VIX added as a "Compare Symbol" in red,
and then the Weekly ROC signals below.
For the ROC graphs, you can show SPX+VIX together, SPX alone, or VIX alone. I prefer to display
them separately because they don't scale well together (VIX crowds out the SPX when it spikes).
Background color is still based on both SPX/VIX together, regardless of which graph is shown.
Note that there is no VIX data available on Trading View prior to 1990, so for those dates the
formula is using only ROC(SPX) and the assigned thresholds (-9 and -5, or whatever you choose).

$0 Monthly Weekly & Daily OHLC Viewer
Visualizer of current or previous month(s), week(s) & days ranges
Purpose: View last Monthly, Weekly, Daily, and/or a custom time interval OHLC, i.e. previously closed/confirmed or the ongoing higher time interval ranges
Main configurations available:
- 2 main reporting modes: View the current/ongoing M/W/D candles' OHLC (live, repaints) or report OHLC of last closed ones, i.e. previous Montly, Weekly and/or Daily
- View only latest Monthly, Weekly and/or Daily OHLC (lines) or all past ones (~channel)
- Set your own time interval for its price range(s) to be reported, e.g. last quarter '3M', 12H '720', or hide it
- View one specific day of the week OHLC reported all over the week
Graphic/visual configuration:
- Show the High & Low levels or not
- Show the Open & close levels or not
- Display a background color between top & down or lines only
- Change the background color depending if is/was rising or falling price
- Highlight the top & down breaches of higher timeframe resolution candles: Daily breaching last Weekly range, and/or the Weekly the Monthly one
- Colors & styling can be edited from the indicator's styling configuration panel
Depending on its expected usage, those configurations enable to:
- Consider previously closed candles OLHC as reference top & down ranges (support & resistance, breaches)
- Review chart's current candles evolution within their higher time interval / candle (M/W/D)
- Consider specific week days' range as a reference for the week trend
- Have a general overview of the market evolution trends
Default config is to view current candles evolving within their higher time interval / candle, while reporting last previously closed M+W is a preferred usage. Play with the config settings to find your setup.
View ongoing M+W+D OHLC with dynamic background color:
View previously closed M+W+D OHLC:
View closed H&L for M+W+D, latest only:
View Mondays' OHLC:
Feedback & support welcome.

Current vs. Average price performance (daily and weekly)This indicator is to be used only by the values it gives back, don't use the lines .
In "current week days" choose number of days that already BEGAN this week (ex. on Wednesday type 3)
Green1 - Current Daily Range
Orange1 - Average Daily Range
Green2 - Current Weekly Range
Red1 - Average Weekly Range
Orange2 - Today's price movement compared to the average daily price movement (in percentage)
Red2 - This week price movement compared to the average weekly price movement (in percentage)
By these values you can check how price performed today and this week in comparison to the average daily and weekly values - you can check with some probability if the movement is already exhausted or price can do some more action.

10/5 Weekly/Daily EMAs with ConfirmationsPlots Daily and Weekly 10 & 5 EMAs (but fully customizable to your own).
In addition to plotting the EMAs it color coordinates trend bias and has cross confirmation signals.
Philosophy and how to read:
I use this indicator when trading strictly on the daily timeframe. I have not tested it on other timeframes.
In my trade system I start with both the monthly and weekly charts to define overall bias.
Here’s the general rule of thumb.
10 EMA is direction (bias) and 5 EMA is price.
If 5EMA is below 10EMA there is a bear bias. If 5EMA is above 10EMA there is a bull bias.
This indicator will plot both the daily and weekly 10 & 5 EMAs.
It will also color code the background based on how these EMAs relate to each other.
Light red typically is just the daily is confirmed bear (typically because it could be either or)
Dark red, both daily and weekly in confirmed bear.
Light green, typically just daily is confirmed bull (typically because it could be either or)
Dark green, both daily and weekly in confirmed bull.
In addition to background highlight there is confirmation crosses.
The daily confirmation cross is default yellow triangle.
Down triangle is 5 crossing the 10 downward.
Up triangle is the 5 crossing the 10 upward.
The weekly confirmation is the same only is aqua color.
Generally, on a color change you want to see one or both confirmation in the direction of the bias change.
If you only want to plot the daily bias in the options unclick the setting: Include Weekly Background Plotting. Unclicking this will remove the background coloring for the weekly bias. This might be helpful if you only want to see the strength of what the weekly timeframe is telling you.
Also, I’m primarily a trend trader but I also do have a reversal system I trade with lower R:R parameters.
A good reversal confirmation signal I’ve noticed is the instrument that you are trading should go through a cycle of light color to dark color.
You could also create alerts with this indicator based on just signals. When the signal fires the value will be 1.
Future Updates:
I want to find some way to correlate the distance between these EMAs to enhance the signal. Also to include a velocity component. Plus a few more things.
If you like this indicator please like and leave a comment down below.
Rounded Weekly Pivot (by ChartArt)Trade with the trend. This is an overlay indicator which shows the weekly pivot (rounded) either as line or circle drawing, select-able by the user. The width of the pivot line (or circle) overlay is also adjustable.
In addition the bars can be colored by the trend, depending if the close price is above or below both the weekly and monthly pivots. If the close price is neither above or below both the weekly and monthly pivot prices the trend color is neutral blue.
The weekly pivot indicator with the optional setting that the pivot price is drawn as circles instead of a line:
And here with the pivot drawing disabled, showing only the pivot bar trend color

Evil's Weekly Momentum ScoreA momentum scoring system that ranks any ticker on a 0-100 scale based on multi-timeframe relative strength. Built for weekly rotation decisions - example, I like to check this every Tuesday when it's nice and quiet, then rotate into the 3 strongest names.
Works on sector ETFs (XLK, XLF, XLE, etc.), mega caps (AAPL, NVDA, MSFT, GOOGL), or any liquid ticker watchlist you'd like to rank. Sector ETFs are probably more stable, mega caps have higher volatility; build your watchlist according to your comfort threshold.
How It Works
The indicator combines four components into a single score:
13-Week Momentum (40%) - Quarterly relative strength vs SPY. Where are institutions rotating?
4-Week Momentum (25%) - Monthly trend confirmation. Is the medium-term move intact?
2-Week Acceleration (20%) - Is momentum speeding up or fading? Catches turns early.
10-Week MA (15%) - Trend filter. Price above or below the 10-week moving average.
Each component is measured relative to SPY by default, so you're seeing true outperformance - not just whether something is going up, but whether it's beating the market.
Signal Levels
90+ : ON FIRE 🔥
80-89 : STRONG BUY
70-79 : BUY
50-69 : HOLD
Below 50 : AVOID
In my opinion, cash is a valid position so I don't rotate into scores below 80.
Features
Toggle each component on/off — weights auto-redistribute
Compare to SPY or use absolute momentum
Dashboard overlay sits on your price chart
Position dashboard anywhere: top/bottom, left/right
Alerts for signal level crossings
How To Use It
Add to your watchlist and flip through charts. Compare scores across sectors or mega caps. Rotate into the highest-scoring names, trim or avoid the lowest. Green values in the dashboard = outperforming. Red = underperforming. Simple.
Best Used For
Weekly sector rotation
Mega cap relative strength ranking
Momentum-based stock selection
Identifying leadership shifts before they're obvious

[CT] Daily & Weekly Percentage Price Oscillator Daily & Weekly Percentage Price Oscillator, or D&W PPO, is a dual-speed momentum oscillator that blends a slower “weekly-style” percentage oscillator with a faster “daily-style” percentage oscillator, then turns the relationship between them into a clean histogram that is easy to trade. The script builds four EMAs from the chart’s close. The first pair, L1 and L2, is used to create the W component, which behaves like a slow, higher-timeframe trend pressure line. W is calculated as the percentage distance between EMA(L1) and EMA(L2), normalized by EMA(L2). When W is rising and positive, it tells you the broader momentum is expanding upward, and when W is falling and negative, the broader momentum is expanding downward. The second pair, L3 and L4, creates the D component, which behaves like a faster, lower-timeframe momentum pulse, also expressed as a percentage but normalized by the same EMA(L2), so both components share a consistent “scale.” The script then combines them into R = W + D, which represents the total blended momentum, where W supplies the slow structure and D supplies the fast impulse.
The indicator is plotted as a histogram using “R − W,” and that choice is intentional. Because R = W + D, the histogram value “R − W” is mathematically identical to D. In other words, the columns you see are the fast momentum component, but anchored to a clear baseline that reflects whether the fast component is adding to, or subtracting from, the slower component’s trend context. The zero line is the equilibrium point where R equals W, meaning the fast component is neutral relative to the slow trend context. When the histogram is above zero, the fast component is contributing positive momentum and the script colors the columns with the Bull color, indicating that R is above W and the short-term push is aligned to the upside. When the histogram is below zero, the fast component is contributing negative momentum and the script colors the columns with the Bear color, indicating that R is below W and the short-term push is aligned to the downside. If you enable “Color price bars,” the chart candles are painted with the same logic so you can visually stay in sync with the fast momentum regime without staring at the panel.
How to trade it comes down to treating the histogram as your actionable trigger layer and using its behavior around the zero line as the decision boundary. A basic long framework is to prioritize long trades when the histogram is above zero and either expanding or printing consecutive positive columns, because that tells you the fast momentum pulse is supportive and not fighting the current regime. The cleanest long entries usually occur when the histogram flips from negative to positive and holds above zero for at least a bar or two, because that transition often marks the shift from pullback pressure into renewed upside impulse. You can add selectivity by watching for a “dip and re-strengthen” pattern above zero: after a positive run, the histogram contracts toward the baseline without breaking materially below it, then turns back up, which often corresponds to a controlled pullback followed by continuation. A basic short framework is the mirror image: prioritize shorts when the histogram is below zero and expanding downward, and treat flips from positive to negative that hold below zero as the higher-quality transition into downside impulse. In both directions, the histogram is especially useful for avoiding trades during momentum dead zones, because when columns chop tightly around the zero line with frequent flips, it is signaling indecision and a lack of clean directional impulse, which is where most “false starts” tend to happen.
Risk management with this tool is straightforward because the oscillator gives you a natural invalidation concept. For long trades, a common invalidation is the histogram losing the zero line and staying negative, since that indicates the fast component has turned from supportive to opposing. For short trades, invalidation is the histogram regaining the zero line and holding positive. Another practical way to manage trades is to use histogram contraction as an early warning that the impulse is weakening. If you are long and positive columns begin to shrink toward zero for several bars, you can tighten risk, take partials, or wait for a fresh expansion before adding. If you are short and negative columns begin to shrink toward zero, the same concept applies. The optional W line can be shown if you want a visual anchor of the slow component; while the histogram is already built to reflect the fast component relative to the slow context, viewing W can help you quickly recognize whether the larger momentum backdrop is generally rising or falling, which can be used as an additional bias filter for trade selection.
In practice, the D&W PPO is best used as a momentum alignment and timing tool: the slow component defines the “weather,” the fast component defines the “wind,” and the histogram tells you whether the wind is pushing with the weather or pushing against it. When the histogram is cleanly one-sided and expanding, it supports continuation-style trading and trend-following entries. When the histogram is choppy around zero, it warns you that conditions are rotational and patience usually pays.

KD Weekly Oversold Golden Cross (v6)KD Weekly Oversold Golden Cross (v6)
This is a screener for weekly KD indicator bullish crossovers at oversold levels, where the K value does not exceed 25.

Custom Weekly Volume Profile [Multi-Timeframe]Description: This indicator renders a high-precision Weekly Volume Profile that resets at the start of every trading week. Unlike standard fixed-range profiles, this script builds the profile bar-by-bar using lower timeframe data (e.g., 1-minute or 5-minute data) to ensure accuracy even on higher timeframe charts.
It is designed for traders who track the developing value of the current week (Auction Market Theory) and need specific alerts when price tests the edges of value.
Key Features:
Developing Weekly Profile:
The profile resets automatically at the beginning of the week (Sunday/Monday).
It tracks the Point of Control (POC), Value Area High (VAH), and Value Area Low (VAL) in real-time as the week progresses.
Previous Week Levels:
The script automatically stores the final levels (POC, VAH, VAL) of the previous week and projects them forward. This allows you to trade tests of the prior week's value.
Auto-Scaling Histogram:
Smart Width: The profile starts wider at the beginning of the week (when data is sparse) and automatically shrinks as the week progresses (Thursday/Friday) to keep your chart clean and readable.
Advanced Alerting:
Crossover Alerts: Trigger alerts when price crosses the developing VAH/VAL or the previous week's levels.
Time Window Filter: Includes a session input (default 08:30-15:00) to restrict alerts to specific trading hours, preventing notifications during low-volume overnight sessions.
Customization:
Precision: Adjustable "Row Size" and "Calculation Timeframe" to tune performance vs. accuracy.
Visuals: Full color control over the Value Area, Outer Volume, and Level Lines.
Settings:
Calculation Precision: Determines the lower timeframe used to calculate the volume (e.g., set to "5" for 5-minute precision).
Value Area %: Default is 70%, standard for AMT trading.
Timezone: Adjustable to ensure the weekly reset aligns with your local exchange time (e.g., America/Chicago for CME Futures).
Disclaimer: This script is for educational and informational purposes only. It does not constitute financial advice, trading recommendations, or a solicitation to buy or sell any financial instrument. Trading futures and other financial markets involves significant risk and is not suitable for every investor. Past performance of any trading system or methodology is not necessarily indicative of future results. The user assumes all responsibility for any trading decisions made based on the information provided by this tool. Use at your own risk.

NIFTY Weekly Option Seller DirectionalHere’s a straight description you can paste into the TradingView “Description” box and tweak if needed:
---
### NIFTY Weekly Option Seller – Regime + Score + Management (Single TF)
This indicator is built for **weekly option sellers** (primarily NIFTY) who want a **structured regime + scoring framework** to decide:
* Whether to trade **Iron Condor (IC)**, **Put Credit Spread (PCS)** or **Call Credit Spread (CCS)**
* How strong that regime is on the current timeframe (score 0–5)
* When to **DEFEND** existing positions and when to **HARVEST** profits
> **Note:** This is a **single timeframe** tool. The original system uses it on **4H and 1D separately**, then combines scores manually (e.g., using `min(4H, 1D)` for conviction and lot sizing).
---
## Core logic
The script classifies the market into 3 regimes:
* **IC (Iron Condor)** – range/mean-reversion conditions
* **PCS (Put Credit Spread)** – bullish/trend-up conditions
* **CCS (Call Credit Spread)** – bearish/trend-down conditions
For each regime, it builds a **0–5 score** using:
* **EMA stack (8/13/34)** – trend structure
* **ADX (custom DMI-based)** – trend strength vs range
* **Previous-day CPR** – in CPR vs break above/below
* **VWAP (session)** – near/far value
* **Camarilla H3/L3** – for IC context
* **RSI (14)** – used as a **brake**, not a primary signal
* **Daily trend / Daily ADX** – used as **hard gates**, not double-counted as extra points
Then:
* Scores for PCS / CCS / IC are **cross-penalised** (they pull each other down if conflicting)
* Final scores are **smoothed** (current + previous bar) to avoid jumpy signals
The **background colour** shows the current regime and conviction:
* Blue = IC
* Green = PCS
* Red = CCS
* Stronger tint = higher regime score
---
## Scoring details (per timeframe)
**PCS (uptrend, bullish credit spreads)**
* +2 if EMA(8) > EMA(13) > EMA(34)
* +1 if ADX > ADX_TREND
* +1 if close > CPR High
* +1 if close > VWAP
* RSI brake:
* If RSI < 50 → PCS capped at 2
* If RSI > 75 → PCS capped at 3
* Daily gating:
* If daily EMA stack is **not** uptrend → PCS capped at 2
**CCS (downtrend, bearish credit spreads)**
* +2 if EMA(8) < EMA(13) < EMA(34)
* +1 if ADX > ADX_TREND
* +1 if close < CPR Low
* +1 if close < VWAP
* RSI brake:
* If RSI > 50 → CCS capped at 2
* If RSI < 25 → CCS capped at 3
* Daily gating:
* If daily EMA stack is **not** downtrend → CCS capped at 2
**IC (range / mean-reversion)**
* +2 if ADX < ADX_RANGE (low trend)
* +1 if close inside CPR
* +1 if near VWAP
* +0.5 if inside Camarilla H3–L3
* +1 if daily ADX < ADX_RANGE (daily also range-like)
* +0.5 if RSI between 45 and 55 (classic balance zone)
* Daily gating:
* If daily ADX ≥ ADX_TREND → IC capped at 2 (no “strong IC” in strong trends)
**Cross-penalty & smoothing**
* Each regime’s raw score is reduced by **0.5 × max(other two scores)**
* Final IC / PCS / CCS scores are then **smoothed** with previous bar
* Scores are always clipped to ** **
---
## Regime selection
* If one regime has the highest score → that regime is selected.
* If there is a tie or close scores:
* When ADX is high, trend regimes (PCS/CCS) are preferred in the direction of the EMA stack.
* When ADX is low, IC is preferred.
The selected regime’s score is used for:
* Background colour intensity
* Minimum score gate for alerts
* Display in the info panel
---
## DEFEND / HARVEST / REGIME alerts
The script also defines **management signals** using ATR-based buffers and Camarilla breaks:
* **DEFEND**
* Price moving too close to short strikes (PCS/CCS/IC) relative to ATR, or
* Trend breaks through Camarilla with ADX strong
→ Suggests rolling away / widening / converting to reduce risk.
* **HARVEST**
* Price has moved far enough from your short strikes (in ATR multiples) and market is still range-compatible
→ Suggests booking profits / rolling closer / reducing risk.
* **REGIME CHANGED**
* Regime flips (IC ↔ PCS/CCS) with cooldown and minimum score gate
→ Suggests switching playbook (range vs trend) for new entries.
Each of these has a plotshape label plus an `alertcondition()` for TradingView alerts.
---
## UI / Panel
The **top-right panel** (optional) shows:
* Strategy + final regime score (IC / PCS / CCS, x/5)
* ADX / RSI values
* CPR status (Narrow / Normal / Wide + %)
* EMA Stack (Up / Down / Mixed) and EMA tightness
* VWAP proximity (Near / Away)
* Final **IC / PCS / CCS** scores (for this timeframe)
* H3/L3, H4/L4, CPR Low/High and VWAP levels (rounded)
These values are meant to be **read quickly at the decision time** (e.g. near the close of the 4H bar or daily bar).
---
## Intended workflow
1. Run the script on **4H** and **1D** charts separately.
2. For each timeframe, read the panel’s **IC / PCS / CCS scores** and regime.
3. Decide:
* Final regime (IC vs PCS vs CCS)
* Combined score (e.g. `AlignScore = min(Score_4H, Score_1D)`)
4. Map that combined score to **your own lot-size buckets** and trade rules.
5. During the life of the position, use **DEFEND / HARVEST / REGIME** alerts to adjust.
The script does **not** auto-calculate lot size or P&L. It focuses on giving a structured, consistent **market regime + strength + levels + management** layer for weekly option selling.
---
## Disclaimer
This is a discretionary **decision-support tool**, not a guarantee of profit or a replacement for risk management.
No performance is implied or promised. Always size positions and manage risk according to your own capital, rules, and regulations.

GBPUSD Weekly Cross LinesThis indicator tracks 20/50 EMA crossovers on GBPUSD (Weekly timeframe) and displays the crossover points across all symbols and timeframes, allowing traders to visually align current price action with key historical turning points in GBPUSD.
The script works by detecting bullish (20 EMA crossing above 50 EMA) and bearish (20 EMA crossing below 50 EMA) signals since 2010, using request.security() to source data from GBPUSD weekly candles, even if the indicator is applied to AAPL, EURJPY, BTCUSD, or any other asset.
Each crossover is marked with a vertical line that persists across all charts, offering a powerful way to:
Compare current market context with GBPUSD’s historical trend shifts
Observe intermarket correlations
Align trading timing across multiple assets
Spot macro trend transitions that ripple across global markets
