aproxLibrary "aprox"
It's a library of the aproximations of a price or Series float it uses Fourier transform and
Euler's Theoreum for Homogenus White noice operations. Calling functions without source value it automatically take close as the default source value.
Copy this indicator to see how each approximations interact between each other.
import Celje_2300/aprox/1 as aprox
//@version=5
indicator("Close Price with Aproximations", shorttitle="Close and Aproximations", overlay=false)
// Sample input data (replace this with your own data)
inputData = close
// Plot Close Price
plot(inputData, color=color.blue, title="Close Price")
dtf32_result = aprox.DTF32()
plot(dtf32_result, color=color.green, title="DTF32 Aproximation")
fft_result = aprox.FFT()
plot(fft_result, color=color.red, title="DTF32 Aproximation")
wavelet_result = aprox.Wavelet()
plot(wavelet_result, color=color.orange, title="Wavelet Aproximation")
wavelet_std_result = aprox.Wavelet_std()
plot(wavelet_std_result, color=color.yellow, title="Wavelet_std Aproximation")
DFT3(xval, _dir)
Parameters:
xval (float)
_dir (int)
//@version=5
import Celje_2300/aprox/1 as aprox
indicator("Example - DFT3", shorttitle="DFT3 Example", overlay=true)
// Sample input data (replace this with your own data)
inputData = close
// Apply DFT3
result = aprox.DFT3(inputData, 2)
// Plot the result
plot(result, color=color.blue, title="DFT3 Result")
DFT2(xval, _dir)
Parameters:
xval (float)
_dir (int)
//@version=5
import Celje_2300/aprox/1 as aprox
indicator("Example - DFT2", shorttitle="DFT2 Example", overlay=true)
// Sample input data (replace this with your own data)
inputData = close
// Apply DFT2
result = aprox.DFT2(inputData, inputData, 1)
// Plot the result
plot(result, color=color.green, title="DFT2 Result")
//@version=5
import Celje_2300/aprox/1 as aprox
indicator("Example - DFT2", shorttitle="DFT2 Example", overlay=true)
// Sample input data (replace this with your own data)
inputData = close
// Apply DFT2
result = aprox.DFT2(inputData, 1)
// Plot the result
plot(result, color=color.green, title="DFT2 Result")
FFT(xval)
FFT: Fast Fourier Transform
Parameters:
xval (float)
Returns: Aproxiated source value
//@version=5
import Celje_2300/aprox/1 as aprox
indicator("Example - FFT", shorttitle="FFT Example", overlay=true)
// Sample input data (replace this with your own data)
inputData = close
// Apply FFT
result = aprox.FFT(inputData)
// Plot the result
plot(result, color=color.red, title="FFT Result")
DTF32(xval)
DTF32: Combined Discrete Fourier Transforms
Parameters:
xval (float)
Returns: Aproxiated source value
//@version=5
import Celje_2300/aprox/1 as aprox
indicator("Example - DTF32", shorttitle="DTF32 Example", overlay=true)
// Sample input data (replace this with your own data)
inputData = close
// Apply DTF32
result = aprox.DTF32(inputData)
// Plot the result
plot(result, color=color.purple, title="DTF32 Result")
whitenoise(indic_, _devided, minEmaLength, maxEmaLength, src)
whitenoise: Ehler's Universal Oscillator with White Noise, without extra aproximated src
Parameters:
indic_ (float)
_devided (int)
minEmaLength (int)
maxEmaLength (int)
src (float)
Returns: Smoothed indicator value
//@version=5
import Celje_2300/aprox/1 as aprox
indicator("Example - whitenoise", shorttitle="whitenoise Example", overlay=true)
// Sample input data (replace this with your own data)
inputData = close
// Apply whitenoise
result = aprox.whitenoise(aprox.FFT(inputData))
// Plot the result
plot(result, color=color.orange, title="whitenoise Result")
whitenoise(indic_, dft1, _devided, minEmaLength, maxEmaLength, src)
whitenoise: Ehler's Universal Oscillator with White Noise and DFT1
Parameters:
indic_ (float)
dft1 (float)
_devided (int)
minEmaLength (int)
maxEmaLength (int)
src (float)
Returns: Smoothed indicator value
//@version=5
import Celje_2300/aprox/1 as aprox
indicator("Example - whitenoise with DFT1", shorttitle="whitenoise-DFT1 Example", overlay=true)
// Sample input data (replace this with your own data)
inputData = close
// Apply whitenoise with DFT1
result = aprox.whitenoise(inputData, aprox.DFT1(inputData))
// Plot the result
plot(result, color=color.yellow, title="whitenoise-DFT1 Result")
smooth(dft1, indic__, _devided, minEmaLength, maxEmaLength, src)
smooth: Smoothing source value with help of indicator series and aproximated source value
Parameters:
dft1 (float)
indic__ (float)
_devided (int)
minEmaLength (int)
maxEmaLength (int)
src (float)
Returns: Smoothed source series
//@version=5
import Celje_2300/aprox/1 as aprox
indicator("Example - smooth", shorttitle="smooth Example", overlay=true)
// Sample input data (replace this with your own data)
inputData = close
// Apply smooth
result = aprox.smooth(inputData, aprox.FFT(inputData))
// Plot the result
plot(result, color=color.gray, title="smooth Result")
smooth(indic__, _devided, minEmaLength, maxEmaLength, src)
smooth: Smoothing source value with help of indicator series
Parameters:
indic__ (float)
_devided (int)
minEmaLength (int)
maxEmaLength (int)
src (float)
Returns: Smoothed source series
//@version=5
import Celje_2300/aprox/1 as aprox
indicator("Example - smooth without DFT1", shorttitle="smooth-NoDFT1 Example", overlay=true)
// Sample input data (replace this with your own data)
inputData = close
// Apply smooth without DFT1
result = aprox.smooth(aprox.FFT(inputData))
// Plot the result
plot(result, color=color.teal, title="smooth-NoDFT1 Result")
vzo_ema(src, len)
vzo_ema: Volume Zone Oscillator with EMA smoothing
Parameters:
src (float)
len (simple int)
Returns: VZO value
vzo_sma(src, len)
vzo_sma: Volume Zone Oscillator with SMA smoothing
Parameters:
src (float)
len (int)
Returns: VZO value
vzo_wma(src, len)
vzo_wma: Volume Zone Oscillator with WMA smoothing
Parameters:
src (float)
len (int)
Returns: VZO value
alma2(series, windowsize, offset, sigma)
alma2: Arnaud Legoux Moving Average 2 accepts sigma as series float
Parameters:
series (float)
windowsize (int)
offset (float)
sigma (float)
Returns: ALMA value
Wavelet(src, len, offset, sigma)
Wavelet: Wavelet Transform
Parameters:
src (float)
len (int)
offset (simple float)
sigma (simple float)
Returns: Wavelet-transformed series
//@version=5
import Celje_2300/aprox/1 as aprox
indicator("Example - Wavelet", shorttitle="Wavelet Example", overlay=true)
// Sample input data (replace this with your own data)
inputData = close
// Apply Wavelet
result = aprox.Wavelet(inputData)
// Plot the result
plot(result, color=color.blue, title="Wavelet Result")
Wavelet_std(src, len, offset, mag)
Wavelet_std: Wavelet Transform with Standard Deviation
Parameters:
src (float)
len (int)
offset (float)
mag (int)
Returns: Wavelet-transformed series
//@version=5
import Celje_2300/aprox/1 as aprox
indicator("Example - Wavelet_std", shorttitle="Wavelet_std Example", overlay=true)
// Sample input data (replace this with your own data)
inputData = close
// Apply Wavelet_std
result = aprox.Wavelet_std(inputData)
// Plot the result
plot(result, color=color.green, title="Wavelet_std Result")
Tìm kiếm tập lệnh với "wind+芯片行业+市盈率+财经数据"

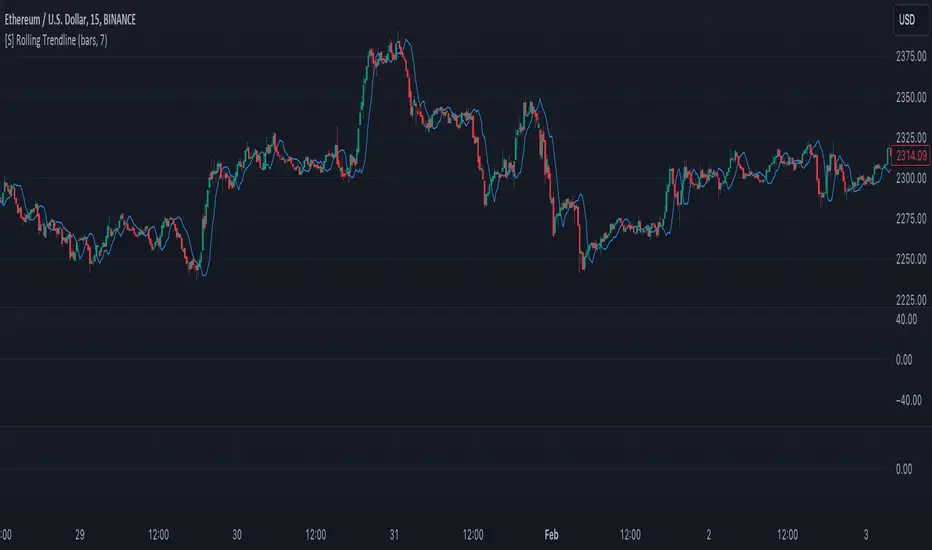
[S] Rolling TrendlineThe Rolling Linear Regression Trendline is a sophisticated technical analysis tool designed to offer traders a dynamic view of market trends over a selectable period. This indicator employs linear regression to calculate and plot a trendline that best fits the closing prices within a specified window, either defined by a number of bars or a set period in days, independent of the chart's timeframe.
Key Features:
Dynamic Window Selection: Users can choose the calculation window based on a fixed number of bars or days, providing flexibility to adapt to different trading strategies and timeframes. For the 'days' option, the indicator calculates the equivalent number of bars based on the chart's timeframe, ensuring relevance across various market conditions and trading sessions.
Linear Regression Analysis: At its core, the indicator uses linear regression to identify the trend direction by calculating the slope and intercept of the trendline. This method offers a statistical approach to trend analysis, highlighting potential uptrends or downtrends based on the positioning and direction of the trendline.
Customizable Period: Traders can input their desired period (N), allowing for tailored analysis. Whether it's short-term movements or longer-term trends, the indicator can adjust to focus on specific time horizons, enhancing its utility across different trading styles and objectives.
Applications:
Trend Identification: By plotting a trendline that mathematically fits the closing prices over the chosen period, traders can quickly identify the prevailing market trend, aiding in bullish or bearish decision-making.
Support and Resistance: The trendline can also serve as a dynamic level of support or resistance, offering potential entry or exit points based on the price's interaction with the trendline.
Strategic Planning: With the ability to adjust the calculation window, traders can align the indicator with their trading strategy, whether focusing on intraday movements or broader swings.
Using this indicator with other parameters can widen you view of the market and help identifying trends
MA+ ProjectionThe "MA+ Projection" indicator is designed to visualize the potential future direction of a moving average, taking into account the impact of historical data loss. It is primarily aimed at providing a practical perspective on how moving averages could evolve as older data points are no longer considered.
Key Features:
Supported Moving Averages: SMA, EMA, WMA, VWMA, and VAWMA (Volume Adjusted WMA).
Flexible Time Span Settings: Customize the moving average length in bars, minutes, or days.
Adjustable Projection Scope: Set a percentage of the measurement to project forward.
Projection 'Cone': Show/hide the deviation and control the multiple.
Use Last Source Value: An option to add the latest known value to the moving window instead of only letting the window shrink. (Enabled by default.)
How It Works:
Given the specified parameters, it takes the selected moving average type (a known formula like SMA, EMA, or WMA), and projects the future data points by continuing to move the data 'window' forward without adding any more data. By default, it extends the average by assuming the price hasn't changed after the last bar. Alternatively, the projection can be the result of shrinking the window as it moves forward without adding any new data points.
Note:
This tool is for visual projection, not prediction. Its purpose is to aid in the analysis of potential future trends based on historical data, not to provide definitive market forecasts.

savitzkyGolay, KAMA, HPOverview
This trading indicator integrates three distinct analytical tools: the Savitzky-Golay Filter, Kaufman Adaptive Moving Average (KAMA), and Hodrick-Prescott (HP) Filter. It is designed to provide a comprehensive analysis of market trends and potential trading signals.
Components
Hodrick-Prescott (HP) Filter
Purpose: Smooths out the price data to identify the underlying trend.
Parameters: Lambda: Controls the smoothness. Range: 50 to 1600.
Impact of Parameters:
Increasing Lambda: This makes the trend line more responsive to short-term market fluctuations, suitable for short-term analysis. A higher Lambda value decreases the degree of smoothing, making the trend line follow recent market movements more closely.
Decreasing Lambda: A lower Lambda value makes the trend line smoother and less responsive to short-term market fluctuations, ideal for longer-term trend analysis. Decreasing Lambda increases the degree of smoothing, thereby filtering out minor market movements and focusing more on the long-term trend.
Kaufman Adaptive Moving Average (KAMA):
Purpose: An adaptive moving average that adjusts to price volatility.
Parameters: Length, Fast Length, Slow Length: Define the sensitivity and adaptiveness of KAMA.
Impact of Parameters:
Adjusting Length affects the base period for efficiency ratio, altering the overall sensitivity.
Fast Length and Slow Length control the speed of KAMA’s adaptation. A smaller Fast Length makes KAMA more sensitive to price changes, while a larger Slow Length makes it less sensitive.
Savitzky-Golay Filter:
Purpose: Smooths the price data using polynomial regression.
Parameters: Window Size: Determines the size of the moving window (7, 9, 11, 15, 21).
Impact of Parameters:
A larger Window Size results in a smoother curve, which is more effective for identifying long-term trends but can delay reaction to recent market changes.
A smaller Window Size makes the curve more responsive to short-term price movements, suitable for short-term trading strategies.
General Impact of Parameters
Adjusting these parameters can significantly alter the signals generated by the indicator. Users should fine-tune these settings based on their trading style, the characteristics of the traded asset, and market conditions to optimize the indicator's performance.
Signal Logic
Buy Signal: The trend from the HP filter is below both the KAMA and the Savitzky-Golay SMA, and none of these indicators are flat.
Sell Signal: The trend from the HP filter is above both the KAMA and the Savitzky-Golay SMA, and none of these indicators are flat.
Usage
Due to the combination of smoothing algorithms and adaptability, this indicator is highly effective at identifying emerging trends for both initiating long and short positions.
IMPORTANT : Although the code and user settings incorporate measures to limit false signals due to lateral (sideways) movement, they do not completely eliminate such occurrences. Users are strongly advised to avoid signals that emerge during simultaneous lateral movements of all three indicators.
Despite the indicator's success in historical data analysis using its signals alone, it is highly recommended to use this code in combination with other indicators, patterns, and zones. This is particularly important for determining exit points from positions, which can significantly enhance trading results.
Limitations and Recommendations
The indicator has shown excellent performance on the weekly time frame (TF) with the following settings:
Savitzky-Golay (SG): 11
Hodrick-Prescott (HP): 100
Kaufman Adaptive Moving Average (KAMA): 20, 2, 30
For the monthly TF, the recommended settings are:
SG: 15
HP: 100
KAMA: 30, 2, 35
Note: The monthly TF is quite variable. With these settings, there may be fewer signals, but they tend to be more relevant for long-term investors. Based on a sample of 40 different stocks from various countries and sectors, most exhibited an average trade return in the thousands of percent.
It's important to note that while these settings have been successful in past performance, market conditions vary and past performance is not indicative of future results. Users are encouraged to experiment with these settings and adjust them according to their individual needs and market analysis.
As this is my first developed trading indicator, I am very open to and appreciative of any suggestions or comments. Your feedback is invaluable in helping me refine and improve this tool. Please feel free to share your experiences, insights, or any recommendations you may have.

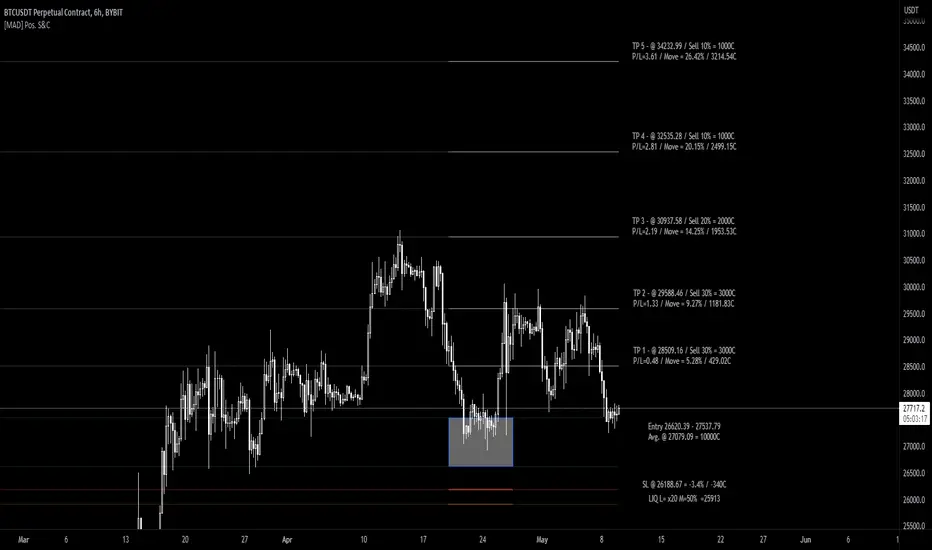
[MAD] Position starter & calculatorThe tool you're using is a financial instrument trading planner and analyzer.
Here is how to use it:
Trade Planning: You can plan your trade entries and exits, calculating potential profits, losses, and their ratio (P/L ratio).
You can define up to five target closing prices with varying volumes, which can be individually activated or deactivated (volume set to 0%).
Risk Management: There's a stop-loss function to calculate and limit potential losses.
Additionally, it includes a liquidation pre-calculation for adjustable leverages and position maintenance(subject to exchange variation).
Customization: You can customize the tool's appearance with five adjustable color schemes, light and dark.
-----------------
Initiation: This tool functions as an indicator.
To start, add it as an indicator.
Once added, you can close the indicator window.
Now wait, till you'll see a blue box at the bottom of the input window.
Parameter Input:
Enter your parameters (SL, box left, box right, TP1, TP2, TP3, TP4, TP5) in the direction of the desired trade.
Click from top to bottom for a short trade or bottom to top for a long trade.
Adjustment: If you want to move the box in the future, adjust the times in the indicator settings directly as click input is not yet platform-supported.
This tool functions as a ruler and doesn't offer alerts (for now).
Here is another examples of how to set up a Position-calculation but here for a short:
Have fun trading
Delta Volume Channels [LucF]█ OVERVIEW
This indicator displays on-chart visuals aimed at making the most of delta volume information. It can color bars and display two channels: one for delta volume, another calculated from the price levels of bars where delta volume divergences occur. Markers and alerts can also be configured using key conditions, and filtered in many different ways. The indicator caters to traders who prefer chart visuals over raw values. It will work on historical bars and in real time, using intrabar analysis to calculate delta volume in both conditions.
█ CONCEPTS
Delta Volume
The volume delta concept divides a bar's volume in "up" and "down" volumes. The delta is calculated by subtracting down volume from up volume. Many calculation techniques exist to isolate up and down volume within a bar. The simplest techniques use the polarity of interbar price changes to assign their volume to up or down slots, e.g., On Balance Volume or the Klinger Oscillator . Others such as Chaikin Money Flow use assumptions based on a bar's OHLC values. The most precise calculation method uses tick data and assigns the volume of each tick to the up or down slot depending on whether the transaction occurs at the bid or ask price. While this technique is ideal, it requires huge amounts of data on historical bars, which usually limits the historical depth of charts and the number of symbols for which tick data is available.
This indicator uses intrabar analysis to achieve a compromise between the simplest and most precise methods of calculating volume delta. In the context where historical tick data is not yet available on TradingView, intrabar analysis is the most precise technique to calculate volume delta on historical bars on our charts. TradingView's Volume Profile built-in indicators use it, as do the CVD - Cumulative Volume Delta Candles and CVD - Cumulative Volume Delta (Chart) indicators published from the TradingView account . My Volume Delta Columns Pro indicator also uses intrabar analysis. Other volume delta indicators such as my Realtime 5D Profile use realtime chart updates to achieve more precise volume delta calculations. Indicators of that type cannot be used on historical bars however; they only work in real time.
This is the logic I use to assign intrabar volume to up or down slots:
• If the intrabar's open and close values are different, their relative position is used.
• If the intrabar's open and close values are the same, the difference between the intrabar's close and the previous intrabar's close is used.
• As a last resort, when there is no movement during an intrabar and it closes at the same price as the previous intrabar, the last known polarity is used.
Once all intrabars making up a chart bar have been analyzed and the up or down property of each intrabar's volume determined, the up volumes are added and the down volumes subtracted. The resulting value is volume delta for that chart bar, which can be used as an estimate of the buying/selling pressure on an instrument.
Delta Volume Percent (DV%)
This value is the proportion that delta volume represents of the total intrabar volume in the chart bar. Note that on some symbols/timeframes, the total intrabar volume may differ from the chart's volume for a bar, but that will not affect our calculations since we use the total intrabar volume.
Delta Volume Channel
The DV channel is the space between two moving averages: the reference line and a DV%-weighted version of that reference. The reference line is a moving average of a type, source and length which you select. The DV%-weighted line uses the same settings, but it averages the DV%-weighted price source.
The weight applied to the source of the reference line is calculated from two values, which are multiplied: DV% and the relative size of the bar's volume in relation to previous bars. The effect of this is that DV% values on bars with higher total volume will carry greater weight than those with lesser volume.
The DV channel can be in one of four states, each having its corresponding color:
• Bull (teal): The DV%-weighted line is above the reference line.
• Strong bull (lime): The bull condition is fulfilled and the bar's close is above the reference line and both the reference and the DV%-weighted lines are rising.
• Bear (maroon): The DV%-weighted line is below the reference line.
• Strong bear (pink): The bear condition is fulfilled and the bar's close is below the reference line and both the reference and the DV%-weighted lines are falling.
Divergences
In the context of this indicator, a divergence is any bar where the slope of the reference line does not match that of the DV%-weighted line. No directional bias is assigned to divergences when they occur.
Divergence Channel
The divergence channel is the space between two levels (by default, the bar's low and high ) saved when divergences occur. When price has breached a channel and a new divergence occurs, a new channel is created. Until that new channel is breached, bars where additional divergences occur will expand the channel's levels if the bar's price points are outside the channel.
Prices breaches of the divergence channel will change its state. Divergence channels can be in one of five different states:
• Bull (teal): Price has breached the channel to the upside.
• Strong bull (lime): The bull condition is fulfilled and the DV channel is in the strong bull state.
• Bear (maroon): Price has breached the channel to the downside.
• Strong bear (pink): The bear condition is fulfilled and the DV channel is in the strong bear state.
• Neutral (gray): The channel has not been breached.
█ HOW TO USE THE INDICATOR
Load the indicator on an active chart (see here if you don't know how).
The default configuration displays:
• The DV channel, without the reference or DV%-weighted lines.
• The Divergence channel, without its level lines.
• Bar colors using the state of the DV channel.
The default settings use an Arnaud-Legoux moving average on the close and a length of 20 bars. The DV%-weighted version of it uses a combination of DV% and relative volume to calculate the ultimate weight applied to the reference. The DV%-weighted line is capped to 5 standard deviations of the reference. The lower timeframe used to access intrabars automatically adjusts to the chart's timeframe and achieves optimal balance between the number of intrabars inspected in each chart bar, and the number of chart bars covered by the script's calculations.
The Divergence channel's levels are determined using the high and low of the bars where divergences occur. Breaches of the channel require a bar's low to move above the top of the channel, and the bar's high to move below the channel's bottom.
No markers appear on the chart; if you want to create alerts from this script, you will need first to define the conditions that will trigger the markers, then create the alert, which will trigger on those same conditions.
To learn more about how to use this indicator, you must understand the concepts it uses and the information it displays, which requires reading this description. There are no videos to explain it.
█ FEATURES
The script's inputs are divided in four sections: "DV channel", "Divergence channel", "Other Visuals" and "Marker/Alert Conditions". The first setting is the selection method used to determine the intrabar precision, i.e., how many lower timeframe bars (intrabars) are examined in each chart bar. The more intrabars you analyze, the more precise the calculation of DV% results will be, but the less chart coverage can be covered by the script's calculations.
DV Channel
Here, you control the visibility and colors of the reference line, its weighted version, and the DV channel between them.
You also specify what type of moving average you want to use as a reference line, its source and length. This acts as the DV channel's baseline. The DV%-weighted line is also a moving average of the same type and length as the reference line, except that it will be calculated from the DV%-weighted source used in the reference line. By default, the DV%-weighted line is capped to five standard deviations of the reference line. You can change that value here. This section is also where you can disable the relative volume component of the weight.
Divergence Channel
This is where you control the appearance of the divergence channel and the key price values used in determining the channel's levels and breaching conditions. These choices have an impact on the behavior of the channel. More generous level prices like the default low and high selection will produce more conservative channels, as will the default choice for breach prices.
In this section, you can also enable a mode where an attempt is made to estimate the channel's bias before price breaches the channel. When it is enabled, successive increases/decreases of the channel's top and bottom levels are counted as new divergences occur. When one count is greater than the other, a bull/bear bias is inferred from it.
Other Visuals
You specify here:
• The method used to color chart bars, if you choose to do so.
• The display of a mark appearing above or below bars when a divergence occurs.
• If you want raw values to appear in tooltips when you hover above chart bars. The default setting does not display them, which makes the script faster.
• If you want to display an information box which by default appears in the lower left of the chart.
It shows which lower timeframe is used for intrabars, and the average number of intrabars per chart bar.
Marker/Alert Conditions
Here, you specify the conditions that will trigger up or down markers. The trigger conditions can include a combination of state transitions of the DV and the divergence channels. The triggering conditions can be filtered using a variety of conditions.
Configuring the marker conditions is necessary before creating an alert from this script, as the alert will use the marker conditions to trigger.
Markers only appear on bar closes, so they will not repaint. Keep in mind, when looking at markers on historical bars, that they are positioned on the bar when it closes — NOT when it opens.
Raw values
The raw values calculated by this script can be inspected using a tooltip and the Data Window. The tooltip is visible when you hover over the top of chart bars. It will display on the last 500 bars of the chart, and shows the values of DV, DV%, the combined weight, and the intermediary values used to calculate them.
█ INTERPRETATION
The aim of the DV channel is to provide a visual representation of the buying/selling pressure calculated using delta volume. The simplest characteristic of the channel is its bull/bear state. One can then distinguish between its bull and strong bull states, as transitions from strong bull to bull states will generally happen when buyers are losing steam. While one should not infer a reversal from such transitions, they can be a good place to tighten stops. Only time will tell if a reversal will occur. One or more divergences will often occur before reversals.
The nature of the divergence channel's design makes it particularly adept at identifying consolidation areas if its settings are kept on the conservative side. A gray divergence channel should usually be considered a no-trade zone. More adventurous traders can use the DV channel to orient their trade entries if they accept the risk of trading in a neutral divergence channel, which by definition will not have been breached by price.
If your charts are already busy with other stuff you want to hold on to, you could consider using only the chart bar coloring component of this indicator:
At its simplest, one way to use this indicator would be to look for overlaps of the strong bull/bear colors in both the DV channel and a divergence channel, as these identify points where price is breaching the divergence channel when buy/sell pressure is consistent with the direction of the breach. I have highlighted all those points in the chart below. Not all of them would have produced profitable trades, but nothing is perfect in the markets. Also, keep in mind that the circles identify the visual you would be looking for — not the trade's entry level.
█ LIMITATIONS
• The script will not work on symbols where no volume is available. An error will appear when that is the case.
• Because a maximum of 100K intrabars can be analyzed by a script, a compromise is necessary between the number of intrabars analyzed per chart bar
and chart coverage. The more intrabars you analyze per chart bar, the less coverage you will obtain.
The setting of the "Intrabar precision" field in the "DV channel" section of the script's inputs
is where you control how the lower timeframe is calculated from the chart's timeframe.
█ NOTES
Volume Quality
If you use volume, it's important to understand its nature and quality, as it varies with sectors and instruments. My Volume X-ray indicator is one way you can appraise the quality of an instrument's intraday volume.
For Pine Script™ Coders
• This script uses the new overload of the fill() function which now makes it possible to do vertical gradients in Pine. I use it for both channels displayed by this script.
• I use the new arguments for plot() 's `display` parameter to control where the script plots some of its values,
namely those I only want to appear in the script's status line and in the Data Window.
• I wrote my script using the revised recommendations in the Style Guide from the Pine v5 User Manual.
█ THANKS
To PineCoders . I have used their lower_tf library in this script, to manage the calculation of the LTF and intrabar stats, and their Time library to convert a timeframe in seconds to a printable form for its display in the Information box.
To TradingView's Pine Script™ team. Their innovations and improvements, big and small, constantly expand the boundaries of the language. What this script does would not have been possible just a few months back.
And finally, thanks to all the users of my scripts who take the time to comment on my publications and suggest improvements. I do not reply to all but I do read your comments and do my best to implement your suggestions with the limited time that I have.

Adaptive Oscillator constructor [lastguru]Adaptive Oscillators use the same principle as Adaptive Moving Averages. This is an experiment to separate length generation from oscillators, offering multiple alternatives to be combined. Some of the combinations are widely known, some are not. Note that all Oscillators here are normalized to -1..1 range. This indicator is based on my previously published public libraries and also serve as a usage demonstration for them. I will try to expand the collection (suggestions are welcome), however it is not meant as an encyclopaedic resource , so you are encouraged to experiment yourself: by looking on the source code of this indicator, I am sure you will see how trivial it is to use the provided libraries and expand them with your own ideas and combinations. I give no recommendation on what settings to use, but if you find some useful setting, combination or application ideas (or bugs in my code), I would be happy to read about them in the comments section.
The indicator works in three stages: Prefiltering, Length Adaptation and Oscillators.
Prefiltering is a fast smoothing to get rid of high-frequency (2, 3 or 4 bar) noise.
Adaptation algorithms are roughly subdivided in two categories: classic Length Adaptations and Cycle Estimators (they are also implemented in separate libraries), all are selected in Adaptation dropdown. Length Adaptation used in the Adaptive Moving Averages and the Adaptive Oscillators try to follow price movements and accelerate/decelerate accordingly (usually quite rapidly with a huge range). Cycle Estimators, on the other hand, try to measure the cycle period of the current market, which does not reflect price movement or the rate of change (the rate of change may also differ depending on the cycle phase, but the cycle period itself usually changes slowly).
Chande (Price) - based on Chande's Dynamic Momentum Index (CDMI or DYMOI), which is dynamic RSI with this length
Chande (Volume) - a variant of Chande's algorithm, where volume is used instead of price
VIDYA - based on VIDYA algorithm. The period oscillates from the Lower Bound up (slow)
VIDYA-RS - based on Vitali Apirine's modification of VIDYA algorithm (he calls it Relative Strength Moving Average). The period oscillates from the Upper Bound down (fast)
Kaufman Efficiency Scaling - based on Efficiency Ratio calculation originally used in KAMA
Deviation Scaling - based on DSSS by John F. Ehlers
Median Average - based on Median Average Adaptive Filter by John F. Ehlers
Fractal Adaptation - based on FRAMA by John F. Ehlers
MESA MAMA Alpha - based on MESA Adaptive Moving Average by John F. Ehlers
MESA MAMA Cycle - based on MESA Adaptive Moving Average by John F. Ehlers , but unlike Alpha calculation, this adaptation estimates cycle period
Pearson Autocorrelation* - based on Pearson Autocorrelation Periodogram by John F. Ehlers
DFT Cycle* - based on Discrete Fourier Transform Spectrum estimator by John F. Ehlers
Phase Accumulation* - based on Dominant Cycle from Phase Accumulation by John F. Ehlers
Length Adaptation usually take two parameters: Bound From (lower bound) and To (upper bound). These are the limits for Adaptation values. Note that the Cycle Estimators marked with asterisks(*) are very computationally intensive, so the bounds should not be set much higher than 50, otherwise you may receive a timeout error (also, it does not seem to be a useful thing to do, but you may correct me if I'm wrong).
The Cycle Estimators marked with asterisks(*) also have 3 checkboxes: HP (Highpass Filter), SS (Super Smoother) and HW (Hann Window). These enable or disable their internal prefilters, which are recommended by their author - John F. Ehlers . I do not know, which combination works best, so you can experiment.
Chande's Adaptations also have 3 additional parameters: SD Length (lookback length of Standard deviation), Smooth (smoothing length of Standard deviation) and Power ( exponent of the length adaptation - lower is smaller variation). These are internal tweaks for the calculation.
Oscillators section offer you a choice of Oscillator algorithms:
Stochastic - Stochastic
Super Smooth Stochastic - Super Smooth Stochastic (part of MESA Stochastic) by John F. Ehlers
CMO - Chande Momentum Oscillator
RSI - Relative Strength Index
Volume-scaled RSI - my own version of RSI. It scales price movements by the proportion of RMS of volume
Momentum RSI - RSI of price momentum
Rocket RSI - inspired by RocketRSI by John F. Ehlers (not an exact implementation)
MFI - Money Flow Index
LRSI - Laguerre RSI by John F. Ehlers
LRSI with Fractal Energy - a combo oscillator that uses Fractal Energy to tune LRSI gamma
Fractal Energy - Fractal Energy or Choppiness Index by E. W. Dreiss
Efficiency ratio - based on Kaufman Adaptive Moving Average calculation
DMI - Directional Movement Index (only ADX is drawn)
Fast DMI - same as DMI, but without secondary smoothing
If no Adaptation is selected (None option), you can set Length directly. If an Adaptation is selected, then Cycle multiplier can be set.
Before an Oscillator, a High Pass filter may be executed to remove cyclic components longer than the provided Highpass Length (no High Pass filter, if Highpass Length = 0). Both before and after the Oscillator a Moving Average can be applied. The following Moving Averages are included: SMA, RMA, EMA, HMA , VWMA, 2-pole Super Smoother, 3-pole Super Smoother, Filt11, Triangle Window, Hamming Window, Hann Window, Lowpass, DSSS. For more details on these Moving Averages, you can check my other Adaptive Constructor indicator:
The Oscillator output may be renormalized and postprocessed with the following Normalization algorithms:
Stochastic - Stochastic
Super Smooth Stochastic - Super Smooth Stochastic (part of MESA Stochastic) by John F. Ehlers
Inverse Fisher Transform - Inverse Fisher Transform
Noise Elimination Technology - a simplified Kendall correlation algorithm "Noise Elimination Technology" by John F. Ehlers
Except for Inverse Fisher Transform, all Normalization algorithms can have Length parameter. If it is not specified (set to 0), then the calculated Oscillator length is used.
More information on the algorithms is given in the code for the libraries used. I am also very grateful to other TradingView community members (they are also mentioned in the library code) without whom this script would not have been possible.

Runners & Laggers (scanner)Firstly, seems to me this may only work with crypto but I know nothing about the other sectors so i could be wrong. I was trying to think up a good way to find moving coins(other than by volume bc theres holes in the results when using it this way). Thought this was an interesting concept so decided to publish it as I've seen no others like it (though i did not extensively search for it. We need to start with a little Tradingview(TV) common knowledge. When there is no update of trades/volume in a candle TV does not print the candle. So when looking at (let's say) a 1 second chart, if the coin being observed by the user has no update from a trade in the time of that 1 sec candle it is skipped over. This means that a coin with a ton of volume might fill an entire 60 seconds with 60 candles and conversely with a low volume coin there could be as little as 0 1-second candles. BUT even for normally low volume coins, when a pump is beginning with the coin it could literally go from 0 1-second candles within a minute to 60 1-second candles within the next minute. ***NOTE: This DOES NOT show ANY information if the coin is going up or down but rather that a LOT more trading volume is occurring than normal.*** What this script does is scans (via request.security feature) up to 40 coins at a time and counts how many candles are printed within a user set timespan calculated in minute. 1 candle print per incremented timeframe that the chart is on. ie. if the chart is a 1 min chart it counts how many 1 min candles are printed. So, (as is in the captured image for the script) if you wanted to count how many 5 second candles are printed for each coin in 1 min then you would have to put the charts timeframe on 5sec and the setting titled 'Window of TIME(in minutes) to count bars' as 1.0 (which bc it's in minutes 1.0m = 60sec and bc 60s / 5s = 12 there would be 12 possible values that each coin can be at depending on how many bars are counted within that 1min/60sec. *** I will update to show an image of what I'm talking about here. Now, the exchange I'm scanning here is Kucoin's Margin Coins. There are 170 something coins total but I removed a few i didn't care for to make it a round 40 coins per set (there being 4 sets of 40 coins total=160 coins being scanned). To scan all 4 sets the indicator must be added 4 times to the chart and a different 'set' selected for each iteration of the script on the chart. Free users can only scan 3 at the most. All others can scan all 4 sets. In the script you can change the exchange and coins as necessary. If there done so and there are not 40 coins total just put '' '' in the extra coins spots that are not filled and the script will skip over these blankly filled spots. The suffix (traded pair) for the tickerID on all Kucoin's Margin Coin's is USDT so that's what i have inputted in the main function on line 46 (will need to be changed if that differs from the coins you want to scan. Next in the line of settings is 'Window of TIME(in minutes) to count bars' which has already been discussed. Following that is the setting "Table Shows" which the results are all in a table and the table will present the coins that have either "Passed" or "Failed" depending on which you choose. The next setting determines what passes or fails. If there are 12 possible rows for the coins to be in (as described above) then this setting is the "Pass/Fail Cutoff" level. So if you want to show all the coins that are in rows 11 and 12 (as in the image at top) then 11 should be selected here. At this point you will see all the coins that have a lot of volume in them. Finding coin names in the table that are usually not with a ton of volume will present your present movers. NOTE: coins like BTC and ETH will almost always be in these levels so it does not indicate anything different from the norm of these coins. Last setting is the ability to show the table on the main window or not. Hope you enjoy and find use in it. BTW this screener format is the same as the others I have published. If you like, check those out too. If you find difficulty using then refer to those as well as they have additional info in them on how to use the scanner and its format. Lastly, in the script is the ability to print the plots and labels but I commented them out bc its really just a jumbled mess. In the commented out sections there is a Random Color Function (provided by @hewhomustnotbenamed which was developed on the basis of Function-HSL-color by @RicardoSantos. All right, peace brothers....and sisters.
**** Also, I see how the "levels" could be confusing so I will put them into a % format soon (probably not today) so that the "Pass/Fail Cutoff" can be in % format so that if "passed" is chosen and 50% is chosen (in the new setting that will be changed) then it'll show you all the coins that have more than 50% of the bars printed within the time window chosen. Goodluck in all your trading adventures. ChasinAlts out.

JohnEhlersFourierTransformLibrary "JohnEhlersFourierTransform"
Fourier Transform for Traders By John Ehlers, slightly modified to allow to inspect other than the 8-50 frequency spectrum.
reference:
www.mesasoftware.com
high_pass_filter(source) Detrended version of the data by High Pass Filtering with a 40 Period cutoff
Parameters:
source : float, data source.
Returns: float.
transformed_dft(source, start_frequency, end_frequency) DFT by John Elhers.
Parameters:
source : float, data source.
start_frequency : int, lower bound of the frequency window, must be a positive number >= 0, window must be less than or 30.
end_frequency : int, upper bound of the frequency window, must be a positive number >= 0, window must be less than or 30.
Returns: tuple with float, float array.
db_to_rgb(db, transparency) converts the frequency decibels to rgb.
Parameters:
db : float, decibels value.
transparency : float, transparency value.
Returns: color.

BjCandlePatternsLibrary "BjCandlePatterns"
Patterns is a Japanese candlestick pattern recognition Library for developers. Functions here within detect viable setups in a variety of popular patterns. Please note some patterns are without filters such as comparisons to average candle sizing, or trend detection to allow the author more freedom.
doji(dojiSize, dojiWickSize) Detects "Doji" candle patterns
Parameters:
dojiSize : (float) The relationship of body to candle size (ie. body is 5% of total candle size). Default is 5.0 (5%)
dojiWickSize : (float) Maximum wick size comparative to the opposite wick. (eg. 2 = bottom wick must be less than or equal to 2x the top wick). Default is 2
Returns: (series bool) True when pattern detected
dLab(showLabel, labelColor, textColor) Produces "Doji" identifier label
Parameters:
showLabel : (bool) Shows label when input is true. Default is false
labelColor : (series color) Color of the label border and arrow
textColor : (series color) Text color
Returns: (series label) A label visible at the chart level intended for the title pattern
bullEngulf(maxRejectWick, mustEngulfWick) Detects "Bullish Engulfing" candle patterns
Parameters:
maxRejectWick : (float) Maximum rejection wick size.
The maximum wick size as a percentge of body size allowable for a top wick on the resolution candle of the pattern. 0.0 disables the filter.
eg. 50 allows a top wick half the size of the body. Default is 0% (Disables wick detection).
mustEngulfWick : (bool) input to only detect setups that close above the high prior effectively engulfing the candle in its entirety. Default is false
Returns: (series bool) True when pattern detected
bewLab(showLabel, labelColor, textColor) Produces "Bullish Engulfing" identifier label
Parameters:
showLabel : (bool) Shows label when input is true. Default is false
labelColor : (series color) Color of the label border and arrow
textColor : (series color) Text color
Returns: (series label) A label visible at the chart level intended for the title pattern
bearEngulf(maxRejectWick, mustEngulfWick) Detects "Bearish Engulfing" candle patterns
Parameters:
maxRejectWick : (float) Maximum rejection wick size.
The maximum wick size as a percentge of body size allowable for a bottom wick on the resolution candle of the pattern. 0.0 disables the filter.
eg. 50 allows a botom wick half the size of the body. Default is 0% (Disables wick detection).
mustEngulfWick : (bool) Input to only detect setups that close below the low prior effectively engulfing the candle in its entirety. Default is false
Returns: (series bool) True when pattern detected
bebLab(showLabel, labelColor, textColor) Produces "Bearish Engulfing" identifier label
Parameters:
showLabel : (bool) Shows label when input is true. Default is false
labelColor : (series color) Color of the label border and arrow
textColor : (series color) Text color
Returns: (series label) A label visible at the chart level intended for the title pattern
hammer(ratio, shadowPercent) Detects "Hammer" candle patterns
Parameters:
ratio : (float) The relationship of body to candle size (ie. body is 33% of total candle size). Default is 33%.
shadowPercent : (float) The maximum allowable top wick size as a percentage of body size. Default is 5%.
Returns: (series bool) True when pattern detected
hLab(showLabel, labelColor, textColor) Produces "Hammer" identifier label
Parameters:
showLabel : (bool) Shows label when input is true. Default is false
labelColor : (series color) Color of the label border and arrow
textColor : (series color) Text color
Returns: (series label) A label visible at the chart level intended for the title pattern
star(ratio, shadowPercent) Detects "Star" candle patterns
Parameters:
ratio : (float) The relationship of body to candle size (ie. body is 33% of total candle size). Default is 33%.
shadowPercent : (float) The maximum allowable bottom wick size as a percentage of body size. Default is 5%.
Returns: (series bool) True when pattern detected
ssLab(showLabel, labelColor, textColor) Produces "Star" identifier label
Parameters:
showLabel : (bool) Shows label when input is true. Default is false
labelColor : (series color) Color of the label border and arrow
textColor : (series color) Text color
Returns: (series label) A label visible at the chart level intended for the title pattern
dragonflyDoji() Detects "Dragonfly Doji" candle patterns
Returns: (series bool) True when pattern detected
ddLab(showLabel, labelColor) Produces "Dragonfly Doji" identifier label
Parameters:
showLabel : (bool) Shows label when input is true. Default is false
labelColor : (series color) Color of the label border and arrow
Returns: (series label) A label visible at the chart level intended for the title pattern
gravestoneDoji() Detects "Gravestone Doji" candle patterns
Returns: (series bool) True when pattern detected
gdLab(showLabel, labelColor, textColor) Produces "Gravestone Doji" identifier label
Parameters:
showLabel : (bool) Shows label when input is true. Default is false
labelColor : (series color) Color of the label border and arrow
textColor : (series color) Text color
Returns: (series label) A label visible at the chart level intended for the title pattern
tweezerBottom(closeUpperHalf) Detects "Tweezer Bottom" candle patterns
Parameters:
closeUpperHalf : (bool) input to only detect setups that close above the mid-point of the candle prior increasing its bullish tendancy. Default is false
Returns: (series bool) True when pattern detected
tbLab(showLabel, labelColor, textColor) Produces "Tweezer Bottom" identifier label
Parameters:
showLabel : (bool) Shows label when input is true. Default is false
labelColor : (series color) Color of the label border and arrow
textColor : (series color) Text color
Returns: (series label) A label visible at the chart level intended for the title pattern
tweezerTop(closeLowerHalf) Detects "TweezerTop" candle patterns
Parameters:
closeLowerHalf : (bool) input to only detect setups that close below the mid-point of the candle prior increasing its bearish tendancy. Default is false
Returns: (series bool) True when pattern detected
ttLab(showLabel, labelColor, textColor) Produces "TweezerTop" identifier label
Parameters:
showLabel : (bool) Shows label when input is true. Default is false
labelColor : (series color) Color of the label border and arrow
textColor : (series color) Text color
Returns: (series label) A label visible at the chart level intended for the title pattern
spinningTopBull(wickSize) Detects "Bullish Spinning Top" candle patterns
Parameters:
wickSize : (float) input to adjust detection of the size of the top wick/ bottom wick as a percent of total candle size. Default is 34%, which ensures the wicks are both larger than the body.
Returns: (series bool) True when pattern detected
stwLab(showLabel, labelColor, textColor) Produces "Bullish Spinning Top" identifier label
Parameters:
showLabel : (bool) Shows label when input is true. Default is false
labelColor : (series color) Color of the label border and arrow
textColor : (series color) Text color
Returns: (series label) A label visible at the chart level intended for the title pattern
spinningTopBear(wickSize) Detects "Bearish Spinning Top" candle patterns
Parameters:
wickSize : (float) input to adjust detection of the size of the top wick/ bottom wick as a percent of total candle size. Default is 34%, which ensures the wicks are both larger than the body.
Returns: (series bool) True when pattern detected
stbLab(showLabel, labelColor, textColor) Produces "Bearish Spinning Top" identifier label
Parameters:
showLabel : (bool) Shows label when input is true. Default is false
labelColor : (series color) Color of the label border and arrow
textColor : (series color) Text color
Returns: (series label) A label visible at the chart level intended for the title pattern
spinningTop(wickSize) Detects "Spinning Top" candle patterns
Parameters:
wickSize : (float) input to adjust detection of the size of the top wick/ bottom wick as a percent of total candle size. Default is 34%, which ensures the wicks are both larger than the body.
Returns: (series bool) True when pattern detected
stLab(showLabel, labelColor, textColor) Produces "Spinning Top" identifier label
Parameters:
showLabel : (bool) Shows label when input is true. Default is false
labelColor : (series color) Color of the label border and arrow
textColor : (series color) Text color
Returns: (series label) A label visible at the chart level intended for the title pattern
morningStar() Detects "Bullish Morning Star" candle patterns
Returns: (series bool) True when pattern detected
msLab(showLabel, labelColor, textColor) Produces "Bullish Morning Star" identifier label
Parameters:
showLabel : (bool) Shows label when input is true. Default is false
labelColor : (series color) Color of the label border and arrow
textColor : (series color) Text color
Returns: (series label) A label visible at the chart level intended for the title pattern
eveningStar() Detects "Bearish Evening Star" candle patterns
Returns: (series bool) True when pattern detected
esLab(showLabel, labelColor, textColor) Produces "Bearish Evening Star" identifier label
Parameters:
showLabel : (bool) Shows label when input is true. Default is false
labelColor : (series color) Color of the label border and arrow
textColor : (series color) Text color
Returns: (series label) A label visible at the chart level intended for the title pattern
haramiBull() Detects "Bullish Harami" candle patterns
Returns: (series bool) True when pattern detected
hwLab(showLabel, labelColor, textColor) Produces "Bullish Harami" identifier label
Parameters:
showLabel : (bool) Shows label when input is true. Default is false
labelColor : (series color) Color of the label border and arrow
textColor : (series color) Text color
Returns: (series label) A label visible at the chart level intended for the title pattern
haramiBear() Detects "Bearish Harami" candle patterns
Returns: (series bool) True when pattern detected
hbLab(showLabel, labelColor, textColor) Produces "Bearish Harami" identifier label
Parameters:
showLabel : (bool) Shows label when input is true. Default is false
labelColor : (series color) Color of the label border and arrow
textColor : (series color) Text color
Returns: (series label) A label visible at the chart level intended for the title pattern
haramiBullCross() Detects "Bullish Harami Cross" candle patterns
Returns: (series bool) True when pattern detected
hcwLab(showLabel, labelColor, textColor) Produces "Bullish Harami Cross" identifier label
Parameters:
showLabel : (bool) Shows label when input is true. Default is false
labelColor : (series color) Color of the label border and arrow
textColor : (series color) Text color
Returns: (series label) A label visible at the chart level intended for the title pattern
haramiBearCross() Detects "Bearish Harami Cross" candle patterns
Returns: (series bool) True when pattern detected
hcbLab(showLabel, labelColor) Produces "Bearish Harami Cross" identifier label
Parameters:
showLabel : (bool) Shows label when input is true. Default is false
labelColor : (series color) Color of the label border and arrow
Returns: (series label) A label visible at the chart level intended for the title pattern
marubullzu() Detects "Bullish Marubozu" candle patterns
Returns: (series bool) True when pattern detected
mwLab(showLabel, labelColor, textColor) Produces "Bullish Marubozu" identifier label
Parameters:
showLabel : (bool) Shows label when input is true. Default is false
labelColor : (series color) Color of the label border and arrow
textColor : (series color) Text color
Returns: (series label) A label visible at the chart level intended for the title pattern
marubearzu() Detects "Bearish Marubozu" candle patterns
Returns: (series bool) True when pattern detected
mbLab(showLabel, labelColor, textColor) Produces "Bearish Marubozu" identifier label
Parameters:
showLabel : (bool) Shows label when input is true. Default is false
labelColor : (series color) Color of the label border and arrow
textColor : (series color) Text color
Returns: (series label) A label visible at the chart level intended for the title pattern
abandonedBull() Detects "Bullish Abandoned Baby" candle patterns
Returns: (series bool) True when pattern detected
abwLab(showLabel, labelColor, textColor) Produces "Bullish Abandoned Baby" identifier label
Parameters:
showLabel : (bool) Shows label when input is true. Default is false
labelColor : (series color) Color of the label border and arrow
textColor : (series color) Text color
Returns: (series label) A label visible at the chart level intended for the title pattern
abandonedBear() Detects "Bearish Abandoned Baby" candle patterns
Returns: (series bool) True when pattern detected
abbLab(showLabel, labelColor, textColor) Produces "Bearish Abandoned Baby" identifier label
Parameters:
showLabel : (bool) Shows label when input is true. Default is false
labelColor : (series color) Color of the label border and arrow
textColor : (series color) Text color
Returns: (series label) A label visible at the chart level intended for the title pattern
piercing() Detects "Piercing" candle patterns
Returns: (series bool) True when pattern detected
pLab(showLabel, labelColor, textColor) Produces "Piercing" identifier label
Parameters:
showLabel : (bool) Shows label when input is true. Default is false
labelColor : (series color) Color of the label border and arrow
textColor : (series color) Text color
Returns: (series label) A label visible at the chart level intended for the title pattern
darkCloudCover() Detects "Dark Cloud Cover" candle patterns
Returns: (series bool) True when pattern detected
dccLab(showLabel, labelColor, textColor) Produces "Dark Cloud Cover" identifier label
Parameters:
showLabel : (bool) Shows label when input is true. Default is false
labelColor : (series color) Color of the label border and arrow
textColor : (series color) Text color
Returns: (series label) A label visible at the chart level intended for the title pattern
tasukiBull() Detects "Upside Tasuki Gap" candle patterns
Returns: (series bool) True when pattern detected
utgLab(showLabel, labelColor, textColor) Produces "Upside Tasuki Gap" identifier label
Parameters:
showLabel : (bool) Shows label when input is true. Default is false
labelColor : (series color) Color of the label border and arrow
textColor : (series color) Text color
Returns: (series label) A label visible at the chart level intended for the title pattern
tasukiBear() Detects "Downside Tasuki Gap" candle patterns
Returns: (series bool) True when pattern detected
dtgLab(showLabel, labelColor, textColor) Produces "Downside Tasuki Gap" identifier label
Parameters:
showLabel : (bool) Shows label when input is true. Default is false
labelColor : (series color) Color of the label border and arrow
textColor : (series color) Text color
Returns: (series label) A label visible at the chart level intended for the title pattern
risingThree() Detects "Rising Three Methods" candle patterns
Returns: (series bool) True when pattern detected
rtmLab(showLabel, labelColor, textColor) Produces "Rising Three Methods" identifier label
Parameters:
showLabel : (bool) Shows label when input is true. Default is false
labelColor : (series color) Color of the label border and arrow
textColor : (series color) Text color
Returns: (series label) A label visible at the chart level intended for the title pattern
fallingThree() Detects "Falling Three Methods" candle patterns
Returns: (series bool) True when pattern detected
ftmLab(showLabel, labelColor, textColor) Produces "Falling Three Methods" identifier label
Parameters:
showLabel : (bool) Shows label when input is true. Default is false
labelColor : (series color) Color of the label border and arrow
textColor : (series color) Text color
Returns: (series label) A label visible at the chart level intended for the title pattern
risingWindow() Detects "Rising Window" candle patterns
Returns: (series bool) True when pattern detected
rwLab(showLabel, labelColor, textColor) Produces "Rising Window" identifier label
Parameters:
showLabel : (bool) Shows label when input is true. Default is false
labelColor : (series color) Color of the label border and arrow
textColor : (series color) Text color
Returns: (series label) A label visible at the chart level intended for the title pattern
fallingWindow() Detects "Falling Window" candle patterns
Returns: (series bool) True when pattern detected
fwLab(showLabel, labelColor, textColor) Produces "Falling Window" identifier label
Parameters:
showLabel : (bool) Shows label when input is true. Default is false
labelColor : (series color) Color of the label border and arrow
textColor : (series color) Text color
Returns: (series label) A label visible at the chart level intended for the title pattern
kickingBull() Detects "Bullish Kicking" candle patterns
Returns: (series bool) True when pattern detected
kwLab(showLabel, labelColor, textColor) Produces "Bullish Kicking" identifier label
Parameters:
showLabel : (bool) Shows label when input is true. Default is false
labelColor : (series color) Color of the label border and arrow
textColor : (series color) Text color
Returns: (series label) A label visible at the chart level intended for the title pattern
kickingBear() Detects "Bearish Kicking" candle patterns
Returns: (series bool) True when pattern detected
kbLab(showLabel, labelColor, textColor) Produces "Bearish Kicking" identifier label
Parameters:
showLabel : (bool) Shows label when input is true. Default is false
labelColor : (series color) Color of the label border and arrow
textColor : (series color) Text color
Returns: (series label) A label visible at the chart level intended for the title pattern
lls(ratio) Detects "Long Lower Shadow" candle patterns
Parameters:
ratio : (float) A relationship of the lower wick to the overall candle size expressed as a percent. Default is 75%
Returns: (series bool) True when pattern detected
llsLab(showLabel, labelColor, textColor) Produces "Long Lower Shadow" identifier label
Parameters:
showLabel : (bool) Shows label when input is true. Default is false
labelColor : (series color) Color of the label border and arrow
textColor : (series color) Text color
Returns: (series label) A label visible at the chart level intended for the title pattern
lus(ratio) Detects "Long Upper Shadow" candle patterns
Parameters:
ratio : (float) A relationship of the upper wick to the overall candle size expressed as a percent. Default is 75%
Returns: (series bool) True when pattern detected
lusLab(showLabel, labelColor, textColor) Produces "Long Upper Shadow" identifier label
Parameters:
showLabel : (bool) Shows label when input is true. Default is false
labelColor : (series color) Color of the label border and arrow
textColor : (series color) Text color
Returns: (series label) A label visible at the chart level intended for the title pattern
bullNeck() Detects "Bullish On Neck" candle patterns
Returns: (series bool) True when pattern detected
nwLab(showLabel, labelColor, textColor) Produces "Bullish On Neck" identifier label
Parameters:
showLabel : (bool) Shows label when input is true. Default is false
labelColor : (series color) Color of the label border and arrow
textColor : (series color) Text color
Returns: (series label) A label visible at the chart level intended for the title pattern
bearNeck() Detects "Bearish On Neck" candle patterns
Returns: (series bool) True when pattern detected
nbLab(showLabel, labelColor, textColor) Produces "Bearish On Neck" identifier label
Parameters:
showLabel : (bool) Shows label when input is true. Default is false
labelColor : (series color) Color of the label border and arrow
textColor : (series color) Text color
Returns: (series label) A label visible at the chart level intended for the title pattern
soldiers(wickSize) Detects "Three White Soldiers" candle patterns
Parameters:
wickSize : (float) Maximum allowable top wick size throughout pattern expressed as a percent of total candle height. Default is 5%
Returns: (series bool) True when pattern detected
wsLab(showLabel, labelColor, textColor) Produces "Three White Soldiers" identifier label
Parameters:
showLabel : (bool) Shows label when input is true. Default is false
labelColor : (series color) Color of the label border and arrow
textColor : (series color) Text color
Returns: (series label) A label visible at the chart level intended for the title pattern
crows(wickSize) Detects "Three Black Crows" candle patterns
Parameters:
wickSize : (float) Maximum allowable bottom wick size throughout pattern expressed as a percent of total candle height. Default is 5%
Returns: (series bool) True when pattern detected
bcLab(showLabel, labelColor, textColor) Produces "Three Black Crows" identifier label
Parameters:
showLabel : (bool) Shows label when input is true. Default is false
labelColor : (series color) Color of the label border and arrow
textColor : (series color) Text color
Returns: (series label) A label visible at the chart level intended for the title pattern
triStarBull() Detects "Bullish Tri-Star" candle patterns
Returns: (series bool) True when pattern detected
tswLab(showLabel, labelColor, textColor) Produces "Bullish Tri-Star" identifier label
Parameters:
showLabel : (bool) Shows label when input is true. Default is false
labelColor : (series color) Color of the label border and arrow
textColor : (series color) Text color
Returns: (series label) A label visible at the chart level intended for the title pattern
triStarBear() Detects "Bearish Tri-Star" candle patterns
Returns: (series bool) True when pattern detected
tsbLab(showLabel, labelColor, textColor) Produces "Bearish Tri-Star" identifier label
Parameters:
showLabel : (bool) Shows label when input is true. Default is false
labelColor : (series color) Color of the label border and arrow
textColor : (series color) Text color
Returns: (series label) A label visible at the chart level intended for the title pattern
wrap(cond, barsBack, borderColor, bgcolor) Produces a box wrapping the highs and lows over the look back.
Parameters:
cond : (series bool) Condition under which to draw the box.
barsBack : (series int) the number of bars back to begin drawing the box.
borderColor : (series color) Color of the four borders. Optional. The default is color.gray.
bgcolor : (series color) Background color of the box. Optional. The default is color.gray.
Returns: (series box) A box who's top and bottom are above and below the highest and lowest points over the lookback
topWick() returns the top wick size of the current candle
Returns: (series float) A value equivelent to the distance from the top of the candle body to its high
bottomWick() returns the bottom wick size of the current candle
Returns: (series float) A value equivelent to the distance from the bottom of the candle body to its low
body() returns the body size of the current candle
Returns: (series float) A value equivelent to the distance between the top and the bottom of the candle body
highestBody() returns the highest body of the current candle
Returns: (series float) A value equivelent to the highest body, whether it is the open or the close
lowestBody() returns the lowest body of the current candle
Returns: (series float) A value equivelent to the highest body, whether it is the open or the close
barRange() returns the height of the current candle
Returns: (series float) A value equivelent to the distance between the high and the low of the candle
bodyPct() returns the body size as a percent
Returns: (series float) A value equivelent to the percentage of body size to the overall candle size
midBody() returns the price of the mid-point of the candle body
Returns: (series float) A value equivelent to the center point of the distance bewteen the body low and the body high
bodyupGap() returns true if there is a gap up between the real body of the current candle in relation to the candle prior
Returns: (series bool) true if there is a gap up and no overlap in the real bodies of the current candle and the preceding candle
bodydwnGap() returns true if there is a gap down between the real body of the current candle in relation to the candle prior
Returns: (series bool) true if there is a gap down and no overlap in the real bodies of the current candle and the preceding candle
gapUp() returns true if there is a gap down between the real body of the current candle in relation to the candle prior
Returns: (series bool) true if there is a gap down and no overlap in the real bodies of the current candle and the preceding candle
gapDwn() returns true if there is a gap down between the real body of the current candle in relation to the candle prior
Returns: (series bool) true if there is a gap down and no overlap in the real bodies of the current candle and the preceding candle
dojiBody() returns true if the candle body is a doji
Returns: (series bool) true if the candle body is a doji. Defined by a body that is 5% of total candle size

Summary ChecklistThis works on daily charts
Summarizes some data as shown.
Projects volume for eod.
Sometimes it opens on new window. You have to move it to the price window.

vol_rangesThis script shows three measures of volatility:
historical (hv): realized volatility of the recent past
median (mv): a long run average of realized volatility
implied (iv): a user-defined volatility
Historical and median volatility are based on the EWMA, rather than standard deviation, method of calculating volatility. Since Tradingview's built in ema function uses a window, the "window" parameter determines how much historical data is used to calculate these volatility measures. E.g. 30 on a daily chart means the previous 30 days.
The plots above and below historical candles show past projections based on these measures. The "periods to expiration" dictates how far the projection extends. At 30 periods to expiration (default), the plot will indicate the one standard deviation range from 30 periods ago. This is calculated by multiplying the volatility measure by the square root of time. For example, if the historical volatility (hv) was 20% and the window is 30, then the plot is drawn over: close * 1.2 * sqrt(30/252).
At the most recent candle, this same calculation is simply drawn as a line projecting into the future.
This script is intended to be used with a particular options contract in mind. For example, if the option expires in 15 days and has an implied volatility of 25%, choose 15 for the window and 25 for the implied volatility options. The ranges drawn will reflect the two standard deviation range both in the future (lines) and at any point in the past (plots) for HV (blue), MV (red), and IV (grey).

FOTSI - Open sourceI WOULD LIKE TO SPECIFY TWO THINGS:
- The indicator was absolutely not designed by me, I do not take any credit and much less I want them, I am just making this fantastic indicator open source and accessible to all
- The script code was not recycled from other indicators, but was created from 0 following the theory behind it to the letter, thus avoiding copyright infringement
- Advices and improvements are accepted, as having very little programming experience in Pine Script I consider this work still rough and slow
WHAT IS THE FOTSI?
The FOTSI is an oscillator that measures the relative strength of the individual currencies that make up the 28 major Forex exchanges.
By identifying the currencies that are in the overbought (+50) and oversold (-50) areas, it is possible to anticipate the correction of a currency pair following a strong trend.
THE THEORY BEHIND
1) At the base of everything is the 1-period momentum (close-open) of the single currency pairs that contain a certain currency. For example, the momentum of the USD currency is composed of all the exchange rates that contain the US dollar inside it: mom_usd = - mom_eurusd - mom_gbpusd + mom_usdchf + mom_usdjpy - mom_audusd + mom_usdcad - mom_nzdusd. Where the base currency is in second position, the momentum is subtracted instead of adding it.
2) The IST formula is applied to the momentum of the individual currencies obtained. In this way we get an oscillator that oscillates between 0 and its overbought and oversold areas. The area between +25 and -25 is an area in which we can consider the movements of individual currencies to be neutral.
3) The TSI is nothing more than a double smoothing on the momentum of individual currencies. This particularity makes the indicator very reactive, minimizing the delays of the trend reversal.
HOW TO USE
1) A currency is identified that is in the overbought (+50) or oversold (-50) area. Example GBP = 50
2) The second currency is identified as the one most opposite to the first. Example USD = -25
3) The currency pair consisting of the two currencies opens. So GBP / USD
4) Considering that GBP is oversold, we anticipate its future devaluation. So in this case we are short on GBP / SUD. Otherwise if GBP had been oversold (-50) we expect its future valuation and therefore we enter long.
5) It is used on the H1, H4 and D1 timeframes
6) Closing conditions: the position on the 50-period exponential moving average is split / the position at target on the 100-period exponential moving average is closed
7) Stoploss: it is recommended not to use it, if you want to use it it is equivalent to 5 times the ATR on the reference timeframe
8) Position sizing: go very slow! Being a counter-trend strategy, it is very risky to position yourself heavily. Use common sense in everything!
9) To insert the alerts that warn you of an overbought and oversold condition, it is necessary to enter the signals called "Overbought Signal" and "Oversold Signal" for each chart used, in the specific Trading View window. like me using multiple charts in the same window.
I hope you enjoy my work. For any questions write in the comments.
Thanks <3
//--------------------------------------------------------------------------------------------------------------------------------------------------------------------------------------------------------------
TENGO A PRECISARE DUE COSE:
- L'indicatore non è stato assolutamente ideato da me, non mi assumo nessun merito e tanto meno li voglio, io sto solo rendendo questo fantastico indicatore open source ed accessibile a tutti
- Il codice dello script non è stato riciclato da altri indicatori, ma è stato creato da 0 seguendo alla lettere la teoria che sta alla sua base, evitando così di violare il copyright
- Si accettano consigli e migliorie, visto che avendo pochissima esperienza di programmazione in Pine Script considero questo lavoro ancora grezzo e lento
COS'È IL FOTSI?
Il FOTSI è un oscillatore che misura la forza relativa delle singole valute che compongono i 28 cambi major del Forex.
Individuando le valute che si trovano nelle aree di ipercomprato (+50) ed ipervenduto (-50) , è possibile anticipare la correzione di una coppia valutaria al seguito di un forte trend.
LA TEORIA ALLA BASE
1) Alla base di tutto c'è il momentum ad 1 periodo (close-open) delle singole coppie valutarie che contengono una determinata valuta. Ad esempio il momentum della valuta USD è composto da tutti i cambi che contengono il dollaro americano al suo interno: mom_usd = - mom_eurusd - mom_gbpusd + mom_usdchf + mom_usdjpy - mom_audusd + mom_usdcad - mom_nzdusd . Ove la valuta base si trova in seconda posizione si sottrae il momentum al posto che sommarlo.
2) Si applica la formula del TSI ai momentum delle singole valute ottenute. In questo modo otteniamo un oscillatore che oscilla tra lo 0 e le sue aree di ipercomprato ed ipervenduto. L'area compresa tra +25 e -25 è un area in cui possiamo considerare neutri i movimenti delle singole valute.
3) Il TSI non è altro che un doppio smoothing sul momentum delle singole valute. Questa particolarità rende l'indicatore molto reattivo, minimizzando i ritardi dell'inversione del trend.
COME SI USA
1) Si individua una valuta che si trova nell'area di ipercomprato (+50) o ipervenduto (-50) . Esempio GBP = 50
2) Si individua come seconda valuta quella più opposta alla prima. Esempio USD = -25
3) Si apre la coppia di valuta composta dalle due valute. Quindi GBP/USD
4) Considerando che GBP è in fase di ipervenduto prevediamo una sua futura svalutazione. Quindi in questo caso entriamo short su GBP/SUD. Diversamente se GBP fosse stato in fase di ipervenduto (-50) ci aspettiamo una sua futura valutazione e quindi entriamo long.
5) Si usa sui timeframe H1, H4 e D1
6) Condizioni di chiusura: si smezza la posizione sulla media mobile esponenziale a 50 periodi / si chiude la posizione a target sulla media mobile esponenziale a 100 periodi
7) Stoploss: è consigliato non usarlo, nel caso lo si voglia utilizzare esso equivale a 5 volte l'ATR sul timeframe di riferimento
8) Position sizing: andateci molto piano! Essendo una strategia contro trend è molto rischioso posizionarsi in modo pesante. Usate il buonsenso in tutto!
9) Per inserire gli allert che ti avvertono di una condizione di ipercomprato ed ipervenduto, è necessario inserire dall'apposita finestra di Trading View i segnali denominati "Segnale di ipercomprato" ed "Segnale di ipervenduto" per ogni grafico che si usa, nel caso come me che si utilizzano più grafici nella stessa finestra.
Spero che possiate apprezzare il mio lavoro. Per qualsiasi domanda scrivete nei commenti.
Grazie<3

KAMA Strategy - Kaufman's Adaptive Moving AverageThis strategy combines Kaufman's Adaptive Moving Average for entry with optional KAMA, PSAR, and Trailing ATR stops for exits.
Kaufman's Adaptive Moving Average is, in my opinion, a gem among the plethora of indicators. It is underrated considering it offers a solution that intuitively makes a lot of sense. When I first read about it, it was a real 'aha!' moment. Look at the top, pink line. Notice how during trending times it follows the trend quickly and closely, but during choppy, non-trending periods, the KAMA stays absolutely flat? Interesting! To trade with it, we simply follow the direction the KAMA is pointing. Is it up? Go long. Is it down? Go short. Is it flat? Hold on.
How does it manage to quickly follow real trends like a fast EMA but ignore choppy conditions that would whipsaw a fast EMA back and forth? It analyses whether recent price moves are significant relative to recent noise and then adapts the length of the EMA window accordingly. If price movement is big compared to the recent noise, the EMA window gets smaller. If price movement is relatively small or average compared to the recent noise, the EMA window gets bigger. In practice it means:
The KAMA would be flat if a 20 point upwards move occurred during a period that has had, on average, regular 20 point moves BUT
the KAMA would point up if a 20 point move occurred during a period that has, on average, had moves of only around 5 points.
In other words, it's a slow EMA during choppy flat / quiet flat periods, and a fast EMA as soon as significant volatility occurs. Perfect!
-----
The Strategy
The strategy is more than just a KAMA indicator. It contains:
KAMA exit (optional)
ATR trailing stop loss exit (optional)
PSAR stop loss exit (optional)
KAMA filter for entry and exits
All features are adjustable in the strategy settings
The Technical Details:
Check out the strategy's 'Inputs' panel. The buy and sell signals are based on the 'KAMA 1' there.
KAMA 1: Length -- 14 is the default. This is the length of the window the KAMA looks back over. In this instance, it c
KAMA 1: Fast KAMA Length -- 2 is the default. This is the tightest the EMA length is allowed to get. It will tend towards this length when volatility is high.
KAMA 1: Slow KAMA Length -- 20 is the default. This is the biggest the EMA length is allowed to get. It will tend towards this length when volatility is low.
KAMA Filter
The strategy buys when the KAMA begins to point up and sells when the KAMA points down. Generally, the KAMA is very good at filtering out the noise itself - it will go flat during noisy/choppy periods. But to add another layer of safety, its author, Perry Kaufman, proposed a KAMA filter. It works by taking the standard deviation of returns over the length of the the 'KAMA 1: Length' I mentioned above and multiplying it by an 'Entry Filter' (1 by default) and 'Exit Filter' (0.5 by default). The entry condition to go long is that the KAMA is pointing up and and it moved up more than 1 x St. Dev. of Returns. The exit condition is when the KAMA is pointing down and it moved down by more than 0.5 x St. Dev. of Returns.
Thanks
Thanks to ChuckBanger, cheatcountry, millerrh, and racer8 for parts of the code. I was able to build upon their good work.
-----
I hope this strategy is helpful to you.
Do you have any thoughts, ideas, or questions? Let me know in the comments or send me a message! I'd be glad to help you out.
If you need an indicator or strategy to be built or customised for you, let me know! I'll be glad to help and it'll probably be cheaper than you think!

Indicators all in oneHello Everyone . Sometimes we need some indicators and each one needs seperated window. with this tool we can see indicators by choosing it from pull down menu, in the same window.
Currently you can choose RSI, MACD, Commodity Channel Index (CCI), Momentum, Stochastic, Stochastic RSI, Directional Movement Index (DMI), Chaikin Money Flow (CMF), On-Balance Volume (OBV), Average True Range (ATR), Volume Weigthed MACD (VWMACD).
some screen shots:
DMI:
MACD:
Stochastic RSI
Let me know if you need any other indicator in this tool.
Enjoy!
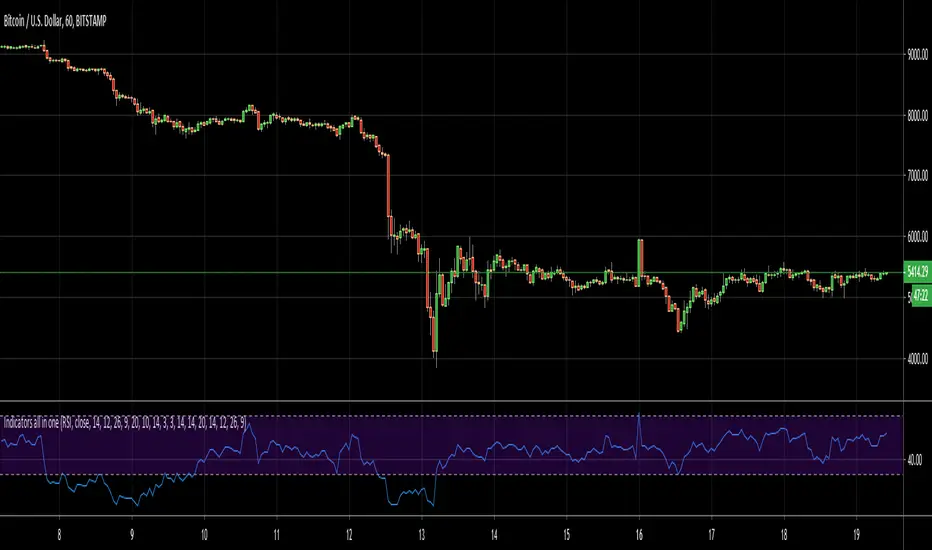
RSI + Composite Index [SHK]One of the most powerful indicator based and divergence strategies i have ever seen was made by Constance Brown.
The Composite Index:
The best way to think of the Composite Index as it applies to the RSI is to think of the RSI as Windows 3.0 and the Composite Index as Windows 10. Constance Brown discovered that the RSI, while it does create and detect divergences, does is not as accurate as it could be. It’s a bit of an oxymoron to say this but the RSI is a momentum indicator without any momentum calculation attached to it. The RSI actually misses a significant amount of important moves and even generates some bad moves. What Constance Brown did with the RSI is to input a momentum calculation within the RSI itself.
Usage:
1. Check hidden and regular divergences on RSI+COMPOSITE_INDEX and PRICE+COMPOSITE_INDEX.
2. After finding divergence wait for COMPOSITE_INDEX to cross under/over it's moving averages to trigger.
Useful Note:
"RSI overbought/oversold as filter", "RSI and COMPOSITE_INDEX trendline as trigger", "RSI 50 Over/Under as trend direction detection", ... can be add to this strategy.
Enjoy!

Center of Gravity Oscillator - Ehlers by KIVANC fr3762Center of Gravity OSCILLATOR by JOHN EHLERS
Converted the original code from his book "Cybernetic Analysis for Stocks and Futures"
This article describes a new oscillator that is unique because it is both smoothed
and has essentially zero lag. The smoothing enables clear identification of turning
points and the zero lag aspect enables action to be taken early in the move. This
oscillator is the serendipitous result of my research into adaptive filters. While the filters
have not yet produced the result I seek, this oscillator has substantial advantages over
conventional oscillators used in technical analysis . The “CG” in the name of the
oscillator stands for the Center of Gravity of the prices over the window of observation.
The Center of Gravity ( CG ) of a physical object is its balance point. For example,
if you balance a 12 inch ruler on your finger, the CG will be at its 6 inch point. If you
change the weight distribution of the ruler by putting a paper clip on one end, then the
balance point (e.g. the CG ) shifts toward the paper clip. Moving from the physical world
to the trading world, we can substitute the prices over our window of observation for the
units of weight along the ruler. With this analogy, we see that the CG of the window
moves to the right when prices increase sharply. Correspondingly, the CG of the
window moves to the left when prices decrease.
For further information:
www.mesasoftware.com
Here's the link to a complete list of all my indicators:
t.co
Şimdiye kadar paylaştığım indikatörlerin tam listesi için: t.co
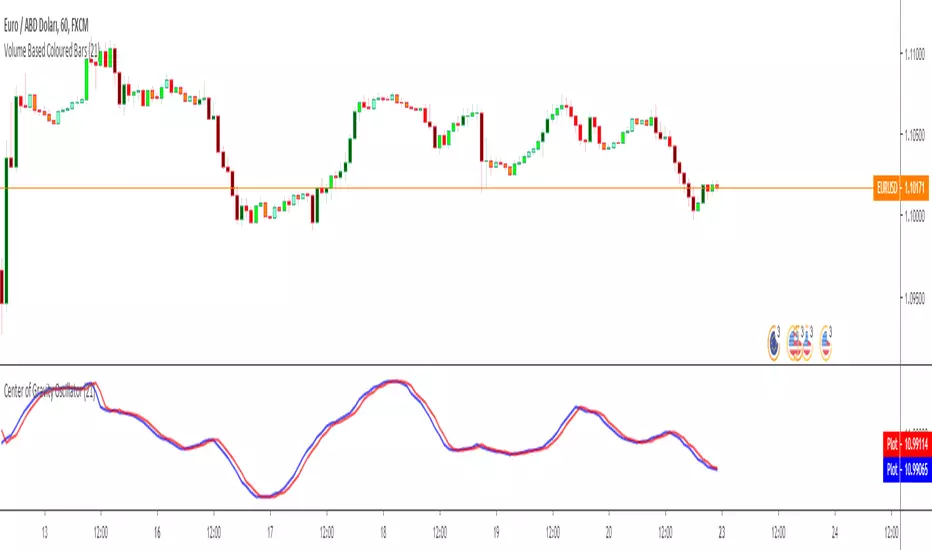
Support and Resistance lines - version 2I created a new version of the Support and Resistance lines script. Compared to the original script this version
1. works with a lot more currency pairs
2. SR line width can be set in the indicator settings window
3. the vertical lines, arrows and the SR lines can be turned off in the indicator settings window
4. the indicator settings window can be opened by clicking on a star symbol that is placed in the upper right corner of the graph window

PT Feeder - HighLowPricePercentageYet another script to help people set the Addon PT Feeder for a trading bot Profit Trailer. Same rule applies if you do not own this the following explanation will not help you.
- Add the script to your favourites
- Edit Minutes for short term and long term for both indicators
- Set candle size you are using default is 5 Minutes
HighLowPricePercentage (Source PT Feeder Wiki)
"This is a property to try and check the variance of the price from the norm and is over the MinutesToMeasureTrend time window. The math is:
firstVariance = (high.ActualPrice - low.ActualPrice) / 2
medianVariance = high.ActualPrice - firstVariance
highLowPercentage = (latestActualPrice - medianVariance) / latestActualPrice * 100".
LongerTermHighLowPricePercentage (Source PT Feeder Wiki)
"This is a property to try and check the variance of the price from the norm and is over the LongerTermMinutesToMeasureTrend time window. The math is the same as the HighLowPricePercentage".
Sources:
PT Feeder Wiki - github.com
LTC: LYHj4WDN7BPu5294cSpqK3SgWSWdDX56Qt
BTC: 1NPVzeDSsenaCS9QdPro877hkMk93nRLcD
Adaptive Rolling Quantile Bands [CHE] Adaptive Rolling Quantile Bands
Part 1 — Mathematics and Algorithmic Design
Purpose. The indicator estimates distribution‐aware price levels from a rolling window and turns them into dynamic “buy” and “sell” bands. It can work on raw price or on *residuals* around a baseline to better isolate deviations from trend. Optionally, the percentile parameter $q$ adapts to volatility via ATR so the bands widen in turbulent regimes and tighten in calm ones. A compact, latched state machine converts these statistical levels into high-quality discretionary signals.
Data pipeline.
1. Choose a source (default `close`; MTF optional via `request.security`).
2. Optionally compute a baseline (`SMA` or `EMA`) of length $L$.
3. Build the *working series*: raw price if residual mode is off; otherwise price minus baseline (if a baseline exists).
4. Maintain a FIFO buffer of the last $N$ values (window length). All quantiles are computed on this buffer.
5. Map the resulting levels back to price space if residual mode is on (i.e., add back the baseline).
6. Smooth levels with a short EMA for readability.
Rolling quantiles.
Given the buffer $X_{t-N+1..t}$ and a percentile $q\in $, the indicator sorts a copy of the buffer ascending and linearly interpolates between adjacent ranks to estimate:
* Buy band $\approx Q(q)$
* Sell band $\approx Q(1-q)$
* Median $Q(0.5)$, plus optional deciles $Q(0.10)$ and $Q(0.90)$
Quantiles are robust to outliers relative to means. The estimator uses only data up to the current bar’s value in the buffer; there is no look-ahead.
Residual transform (optional).
In residual mode, quantiles are computed on $X^{res}_t = \text{price}_t - \text{baseline}_t$. This centers the distribution and often yields more stationary tails. After computing $Q(\cdot)$ on residuals, levels are transformed back to price space by adding the baseline. If `Baseline = None`, residual mode simply falls back to raw price.
Volatility-adaptive percentile.
Let $\text{ATR}_{14}(t)$ be current ATR and $\overline{\text{ATR}}_{100}(t)$ its long SMA. Define a volatility ratio $r = \text{ATR}_{14}/\overline{\text{ATR}}_{100}$. The effective quantile is:
Smoothing.
Each level is optionally smoothed by an EMA of length $k$ for cleaner visuals. This smoothing does not change the underlying quantile logic; it only stabilizes plots and signals.
Latched state machines.
Two three-step processes convert levels into “latched” signals that only fire after confirmation and then reset:
* BUY latch:
(1) HLC3 crosses above the median →
(2) the median is rising →
(3) HLC3 prints above the upper (orange) band → BUY latched.
* SELL latch:
(1) HLC3 crosses below the median →
(2) the median is falling →
(3) HLC3 prints below the lower (teal) band → SELL latched.
Labels are drawn on the latch bar, with a FIFO cap to limit clutter. Alerts are available for both the simple band interactions and the latched events. Use “Once per bar close” to avoid intrabar churn.
MTF behavior and repainting.
MTF sourcing uses `lookahead_off`. Quantiles and baselines are computed from completed data only; however, any *intrabar* cross conditions naturally stabilize at close. As with all real-time indicators, values can update during a live bar; prefer bar-close alerts for reliability.
Complexity and parameters.
Each bar sorts a copy of the $N$-length window (practical $N$ values keep this inexpensive). Typical choices: $N=50$–$100$, $q_0=0.15$–$0.25$, $k=2$–$5$, baseline length $L=20$ (if used), adaptation strength $s=0.2$–$0.7$.
Part 2 — Practical Use for Discretionary/Active Traders
What the bands mean in practice.
The teal “buy” band marks the lower tail of the recent distribution; the orange “sell” band marks the upper tail. The median is your dynamic equilibrium. In residual mode, these tails are deviations around trend; in raw mode they are absolute price percentiles. When ATR adaptation is on, tails breathe with regime shifts.
Two core playbooks.
1. Mean-reversion around a stable median.
* Context: The median is flat or gently sloped; band width is relatively tight; instrument is ranging.
* Entry (long): Look for price to probe or close below the buy band and then reclaim it, especially after HLC3 recrosses the median and the median turns up.
* Stops: Place beyond the most recent swing low or $1.0–1.5\times$ ATR(14) below entry.
* Targets: First scale at the median; optional second scale near the opposite band. Trail with the median or an ATR stop.
* Symmetry: Mirror the rules for shorts near the sell band when the median is flat to down.
2. Continuation with latched confirmations.
* Context: A developing trend where you want fewer but cleaner signals.
* Entry (long): Take the latched BUY (3-step confirmation) on close, or on the next bar if you require bar-close validation.
* Invalidation: A close back below the median (or below the lower band in strong trends) negates momentum.
* Exits: Trail under the median for conservative exits or under the teal band for trend-following exits. Consider scaling at structure (prior swing highs) or at a fixed $R$ multiple.
Parameter guidance by timeframe.
* Scalping / LTF (1–5m): $N=30$–$60$, $q_0=0.20$, $k=2$–3, residual mode on, baseline EMA $L=20$, adaptation $s=0.5$–0.7 to handle micro-vol spikes. Expect more signals; rely on latched logic to filter noise.
* Intraday swing (15–60m): $N=60$–$100$, $q_0=0.15$–0.20, $k=3$–4. Residual mode helps but is optional if the instrument trends cleanly. $s=0.3$–0.6.
* Swing / HTF (4H–D): $N=80$–$150$, $q_0=0.10$–0.18, $k=3$–5. Consider `SMA` baseline for smoother residuals and moderate adaptation $s=0.2$–0.4.
Baseline choice.
Use EMA for responsiveness (fast trend shifts) and SMA for stability (smoother residuals). Turning residual mode on is advantageous when price exhibits persistent drift; turning it off is useful when you explicitly want absolute bands.
How to time entries.
Prefer bar-close validation for both band recaptures and latched signals. If you must act intrabar, accept that crosses can “un-cross” before close; compensate with tighter stops or reduced size.
Risk management.
Position size to a fixed fractional risk per trade (e.g., 0.5–1.0% of equity). Define invalidation using structure (swing points) plus ATR. Avoid chasing when distance to the opposite band is small; reward-to-risk degrades rapidly once you are deep inside the distribution.
Combos and filters.
* Pair with a higher-timeframe median slope as a regime filter (trade only in the direction of the HTF median).
* Use band width relative to ATR as a range/trend gauge: unusually narrow bands suggest compression (mean-reversion bias); expanding bands suggest breakout potential (favor latched continuation).
* Volume or session filters (e.g., avoid illiquid hours) can materially improve execution.
Alerts for discretion.
Enable “Cross above Buy Level” / “Cross below Sell Level” for early notices and “Latched BUY/SELL” for conviction entries. Set alerts to “Once per bar close” to avoid noise.
Common pitfalls.
Do not interpret band touches as automatic signals; context matters. A strong trend will often ride the far band (“band walking”) and punish counter-trend fades—use the median slope and latched logic to separate trend from range. Do not oversmooth levels; you will lag breaks. Do not set $q$ too small or too large; extremes reduce statistical meaning and practical distance for stops.
A concise checklist.
1. Is the median flat (range) or sloped (trend)?
2. Is band width expanding or contracting vs ATR?
3. Are we near the tail level aligned with the intended trade?
4. For continuation: did the 3 steps for a latched signal complete?
5. Do stops and targets produce acceptable $R$ (≥1.5–2.0)?
6. Are you trading during liquid hours for the instrument?
Summary. ARQB provides statistically grounded, regime-aware bands and a disciplined, latched confirmation engine. Use the bands as objective context, the median as your equilibrium line, ATR adaptation to stay calibrated across regimes, and the latched logic to time higher-quality discretionary entries.
Disclaimer
No indicator guarantees profits. Adaptive Rolling Quantile Bands is a decision aid; always combine with solid risk management and your own judgment. Backtest, forward test, and size responsibly.
The content provided, including all code and materials, is strictly for educational and informational purposes only. It is not intended as, and should not be interpreted as, financial advice, a recommendation to buy or sell any financial instrument, or an offer of any financial product or service. All strategies, tools, and examples discussed are provided for illustrative purposes to demonstrate coding techniques and the functionality of Pine Script within a trading context.
Any results from strategies or tools provided are hypothetical, and past performance is not indicative of future results. Trading and investing involve high risk, including the potential loss of principal, and may not be suitable for all individuals. Before making any trading decisions, please consult with a qualified financial professional to understand the risks involved.
By using this script, you acknowledge and agree that any trading decisions are made solely at your discretion and risk.
Enhance your trading precision and confidence 🚀
Best regards
Chervolino

Breakout Volume Momentum [5m]Breakout Volume Momentum Indicator (Pine Script v5)
This TradingView Pine Script v5 indicator plots a green dot below a 5-minute price bar whenever all the breakout and volume conditions are met. It is optimized for live intraday trading (not backtesting) and includes customizable inputs for thresholds and trading session times. Key features and conditions of this indicator:
Gap Up Threshold: Current price is up at least X% (default 20%) from the previous day’s close (uses higher-timeframe daily data) before any signal can trigger.
Relative Volume (RVOL): Current bar’s volume is at least Y× (default 2×) the average volume of the last 20 bars. This ensures unusually high volume is present, indicating strong interest.
Trend Alignment: Price is trading above the VWAP (Volume-Weighted Average Price) and above a fast EMA. In addition, the fast EMA (default 9) is above the slower EMA (default 20) to confirm bullish momentum
tradingview.com
tradingview.com
. These filters ensure the stock is in an intraday uptrend (above the average price and rising EMAs).
Intraday Breakout (optional): Optionally require the price to break above the recent intraday high (default last 30 bars). If enabled, a signal only occurs when the stock exceeds its prior range high, confirming a breakout. This can be toggled on/off in the settings.
Avoid Parabolic Spikes: The script skips any bar with an excessively large range (default >12% from low to high), to avoid triggering on spiky or unsustainable parabolic candles.
Time Window Filter: Signals are restricted to a specific session window (by default 09:30 – 11:00 exchange time, typically the morning session) and will not trigger outside these hours. The session window is adjustable via inputs
stackoverflow.com
.
Alerts: An alert condition is provided so you can set a Trading View alert to send a push notification when a green dot signal fires. The alert message includes the ticker and price at the time of signal.

Time-Decaying Percentile Oscillator [BackQuant]Time-Decaying Percentile Oscillator
1. Big-picture idea
Traditional percentile or stochastic oscillators treat every bar in the look-back window as equally important. That is fine when markets are slow, but if volatility regime changes quickly yesterday’s print should matter more than last month’s. The Time-Decaying Percentile Oscillator attempts to fix that blind spot by assigning an adjustable weight to every past price before it is ranked. The result is a percentile score that “breathes” with market tempo much faster to flag new extremes yet still smooth enough to ignore random noise.
2. What the script actually does
Build a weight curve
• You pick a look-back length (default 28 bars).
• You decide whether weights fall Linearly , Exponentially , by Power-law or Logarithmically .
• A decay factor (lower = faster fade) shapes how quickly the oldest price loses influence.
• The array is normalised so all weights still sum to 1.
Rank prices by weighted mass
• Every close in the window is paired with its weight.
• The pairs are sorted from low to high.
• The cumulative weight is walked until it equals your chosen percentile level (default 50 = median).
• That price becomes the Time-Decayed Percentile .
Find dispersion with robust statistics
• Instead of a fragile standard deviation the script measures weighted Median-Absolute-Deviation about the new percentile.
• You multiply that deviation by the Deviation Multiplier slider (default 1.0) to get a non-parametric volatility band.
Build an adaptive channel
• Upper band = percentile + (multiplier × deviation)
• Lower band = percentile – (multiplier × deviation)
Normalise into a 0-100 oscillator
• The current close is mapped inside that band:
0 = lower band, 50 = centre, 100 = upper band.
• If the channel squeezes, tiny moves still travel the full scale; if volatility explodes, it automatically widens.
Optional smoothing
• A second-stage moving average (EMA, SMA, DEMA, TEMA, etc.) tames the jitter.
• Length 22 EMA by default—change it to tune reaction speed.
Threshold logic
• Upper Threshold 70 and Lower Threshold 30 separate standard overbought/oversold states.
• Extreme bands 85 and 15 paint background heat when aggressive fade or breakout trades might trigger.
Divergence engine
• Looks back twenty bars.
• Flags Bullish divergence when price makes a lower low but oscillator refuses to confirm (value < 40).
• Flags Bearish divergence when price prints a higher high but oscillator stalls (value > 60).
3. Component walk-through
• Source – Any price series. Close by default, switch to typical price or custom OHLC4 for futures spreads.
• Look-back Period – How many bars to rank. Short = faster, long = slower.
• Base Percentile Level – 50 shows relative position around the median; set to 25 / 75 for quartile tracking or 90 / 10 for extreme tails.
• Deviation Multiplier – Higher values widen the dynamic channel, lowering whipsaw but delaying signals.
• Decay Settings
– Type decides the curve shape. Exponential (default 1.16) mimics EMA logic.
– Factor < 1 shrinks influence faster; > 1 spreads influence flatter.
– Toggle Enable Time Decay off to compare with classic equal-weight stochastic.
• Smoothing Block – Choose one of seven MA flavours plus length.
• Thresholds – Overbought / Oversold / Extreme levels. Push them out when working on very mean-reverting assets like FX; pull them in for trend monsters like crypto.
• Display toggles – Show or hide threshold lines, extreme filler zones, bar colouring, divergence labels.
• Colours – Bullish green, bearish red, neutral grey. Every gradient step is automatically blended to generate a heat map across the 0-100 range.
4. How to read the chart
• Oscillator creeping above 70 = market auctioning near the top of its adaptive range.
• Fast poke above 85 with no follow-through = exhaustion fade candidate.
• Slow grind that lives above 70 for many bars = valid bullish trend, not a fade.
• Cross back through 50 shows balance has shifted; treat it like a micro trend change.
• Divergence arrows add extra confidence when you already see two-bar reversal candles at range extremes.
• Background shading (semi-transparent red / green) warns of extreme states and throttles your position size.
5. Practical trading playbook
Mean-reversion scalps
1. Wait for oscillator to reach your desired OB/ OS levels
2. Check the slope of the smoothing MA—if it is flattening the squeeze is mature.
3. Look for a one- or two-bar reversal pattern.
4. Enter against the move; first target = midline 50, second target = opposite threshold.
5. Stop loss just beyond the extreme band.
Trend continuation pullbacks
1. Identify a clean directional trend on the price chart.
2. During the trend, TDP will oscillate between midline and extreme of that side.
3. Buy dips when oscillator hits OS levels, and the same for OB levels & shorting
4. Exit when oscillator re-tags the same-side extreme or prints divergence.
Volatility regime filter
• Use the Enable Time Decay switch as a regime test.
• If equal-weight oscillator and decayed oscillator diverge widely, market is entering a new volatility regime—tighten stops and trade smaller.
Divergence confirmation for other indicators
• Pair TDP divergence arrows with MACD histogram or RSI to filter false positives.
• The weighted nature means TDP often spots divergence a bar or two earlier than standard RSI.
Swing breakout strategy
1. During consolidation, band width compresses and oscillator oscillates around 50.
2. Watch for sudden expansion where oscillator blasts through extreme bands and stays pinned.
3. Enter with momentum in breakout direction; trail stop behind upper or lower band as it re-expands.
6. Customising decay mathematics
Linear – Each older bar loses the same fixed amount of influence. Intuitive and stable; good for slow swing charts.
Exponential – Influence halves every “decay factor” steps. Mirrors EMA thinking and is fastest to react.
Power-law – Mid-history bars keep more authority than exponential but oldest data still fades. Handy for commodities where seasonality matters.
Logarithmic – The gentlest curve; weight drops sharply at first then levels off. Mimics how traders remember dramatic moves for weeks but forget ordinary noise quickly.
Turn decay off to verify the tool’s added value; most users never switch back.
7. Alert catalogue
• TD Overbought / TD Oversold – Cross of regular thresholds.
• TD Extreme OB / OS – Breach of danger zones.
• TD Bullish / Bearish Divergence – High-probability reversal watch.
• TD Midline Cross – Momentum shift that often precedes a window where trend-following systems perform.
8. Visual hygiene tips
• If you already plot price on a dark background pick Bullish Color and Bearish Color default; change to pastel tones for light themes.
• Hide threshold lines after you memorise the zones to declutter scalping layouts.
• Overlay mode set to false so the oscillator lives in its own panel; keep height about 30 % of screen for best resolution.
9. Final notes
Time-Decaying Percentile Oscillator marries robust statistical ranking, adaptive dispersion and decay-aware weighting into a simple oscillator. It respects both recent order-flow shocks and historical context, offers granular control over responsiveness and ships with divergence and alert plumbing out of the box. Bolt it onto your price action framework, trend-following system or volatility mean-reversion playbook and see how much sooner it recognises genuine extremes compared to legacy oscillators.
Backtest thoroughly, experiment with decay curves on each asset class and remember: in trading, timing beats timidity but patience beats impulse. May this tool help you find that edge.

TrendShift [MOT]📈 TrendShift – Multi-Factor Momentum & Trend Signal Suite
TrendShift is a precision-built momentum and confluence tool designed to highlight directional shifts in price action. It combines EMA slope structure, oscillator confirmation, volume behavior, and dynamic SL/TP logic into one cohesive system. Whether you're trading with the trend or catching reversals, TrendShift provides data-backed clarity and visual confidence — and it’s available free to the public.
🔍 Core Signal Logic
Buy (🟢 Long) and Sell (🔴 Short) signals are triggered when multiple conditions align within a set bar window (default: 5 bars):
Stochastic RSI K/D cross
RSI crosses above 20 (long) or below 80 (short)
Stochastic RSI breaks 20 (long) or 80 (short)
Volume exceeds 20-bar average
🧭 Visual Trend Dashboard – Signal Table
A real-time on-chart dashboard displays:
EMA Trend: Bullish / Bearish / Mixed (based on 4 EMA slopes)
Stoch RSI: Oversold / Overbought / Neutral
RSI: Exact value with zone label
Volume: Above or Below average
Dashboard theme and position are fully customizable.
📐 Trend Structure with EMA Slope Logic
Plots four EMAs (21, 50, 100, 200) color-coded by slope:
Green = Rising
Red = Falling
These feed into the dashboard's EMA Trend display.
🎯 Optional Take Profit / Stop Loss Zones
When enabled, SL/TP lines plot automatically on valid signals:
Fixed-distance targets (e.g., 10pt TP, 5pt SL)
Auto-remove on TP or SL hit
Separate lines for long vs. short trades
Fully customizable styling
🔁 Trailing Stop Filter (Internal Logic)
A custom ATR-based trailing stop helps validate directional strength:
ATR period
HHV window
ATR multiplier
Used internally — not plotted — to confirm trend progression before entry.
⚙️ Customizable Parameters
Every core component is user-configurable:
EMA periods: 21 / 50 / 100 / 200
ATR trailing logic: period, HHV, multiplier
Oscillator settings: Stoch RSI & RSI
Volume length
SL/TP toggles and point values
Bar clustering window
Dashboard theme and location
🔔 Alerts Included
BUY Signal Triggered
SELL Signal Triggered
Compatible with webhook automation or mobile push notifications.
⚠️ Disclaimer
This tool is for educational purposes only and is not financial advice. Trading involves risk — always do your own research and consult a licensed professional before making trading decisions.
