Prime NumbersPrime Numbers highlights prime numbers (no surprise there 😅), tokens and the recent "active" feature in "input".
🔸 CONCEPTS
🔹 What are Prime Numbers?
A prime number (or a prime) is a natural number greater than 1 that is not a product of two smaller natural numbers.
Wikipedia: Prime number
🔹 Prime Factorization
The fundamental theorem of arithmetic states that every integer larger than 1 can be written as a product of one or more primes. More strongly, this product is unique in the sense that any two prime factorizations of the same number will have the same number of copies of the same primes, although their ordering may differ. So, although there are many different ways of finding a factorization using an integer factorization algorithm, they all must produce the same result. Primes can thus be considered the "basic building blocks" of the natural numbers.
Wikipedia: Fundamental theorem of arithmetic
Math Is Fun: Prime Factorization
We divide a given number by Prime Numbers until only Primes remain.
Example:
24 / 2 = 12 | 24 / 3 = 8
12 / 3 = 4 | 8 / 2 = 4
4 / 2 = 2 | 4 / 2 = 2
|
24 = 2 x 3 x 2 | 24 = 3 x 2 x 2
or | or
24 = 2² x 3 | 24 = 2² x 3
In other words, every natural/integer number above 1 has a unique representation as a product of prime numbers, no matter how the number is divided. Only the order can change, but the factors (the basic elements) are always the same.
🔸 USAGE
The Prime Numbers publication contains two use cases:
Prime Factorization: performed on "close" prices, or a manual chosen number.
List Prime Numbers: shows a list of Prime Numbers.
The other two options are discussed in the DETAILS chapter:
Prime Factorization Without Arrays
Find Prime Numbers
🔹 Prime Factorization
Users can choose to perform Prime Factorization on close prices or a manually given number.
❗️ Note that this option only applies to close prices above 1, which are also rounded since Prime Factorization can only be performed on natural (integer) numbers above 1.
In the image below, the left example shows Prime Factorization performed on each close price for the latest 50 bars (which is set with "Run script only on 'Last x Bars'" -> 50).
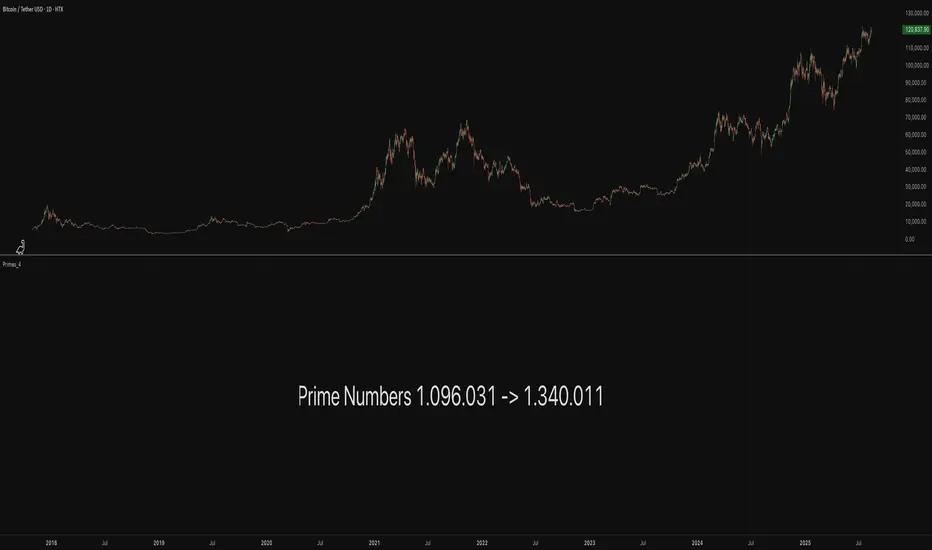
The right example shows Prime Factorization performed on a manually given number, in this case "1,340,011". This is done only on the last bar.
When the "Source" option "close price" is chosen, one can toggle "Also current price", where both the historical and the latest current price are factored. If disabled, only historical prices are factored.
Note that, depending on the chosen options, only applicable settings are available, due to a recent feature, namely the parameter "active" in settings.
Setting the "Source" option to "Manual - Limited" will factorize any given number between 1 and 1,340,011, the latter being the highest value in the available arrays with primes.
Setting to "Manual - Not Limited" enables the user to enter a higher number. If all factors of the manual entered number are in the 1 - 1,340,011 range, these factors will be shown; however, if a factor is higher than 1,340,011, the calculation will stop, after which a warning is shown:
The calculated factors are displayed as a label where identical factors are simplified with an exponent notation in superscript.
For example 2 x 2 x 2 x 5 x 7 x 7 will be noted as 2³ x 5 x 7²
🔹 List Prime Numbers
The "List Prime Numbers" option enables users to enter a number, where the first found Prime Number is shown, together with the next x Prime Numbers ("Amount", max. 200)
The highest shown Prime Number is 1,340,011.
One can set the number of shown columns to customize the displayed numbers ("Max. columns", max. 20).
🔸 DETAILS
The Prime Numbers publication consists out of 4 parts:
Prime Factorization Without Arrays
Prime Factorization
List Prime Numbers
Find Prime Numbers
The usage of "Prime Factorization" and "List Prime Numbers" is explained above.
🔹 Prime Factorization Without Arrays
This option is only there to highlight a hurdle while performing Prime Factorization.
The basic method of Prime Factorization is to divide the base number by 2, 3, ... until the result is an integer number. Continue until the remaining number and its factors are all primes.
The division should be done by primes, but then you need to know which one is a prime.
In practice, one performs a loop from 2 to the base number.
Example:
Base_number = input.int(24)
arr = array.new()
n = Base_number
go = true
while go
for i = 2 to n
if n % i == 0
if n / i == 1
go := false
arr.push(i)
label.new(bar_index, high, str.tostring(arr))
else
arr.push(i)
n /= i
break
Small numbers won't cause issues, but when performing the calculations on, for example, 124,001 and a timeframe of, for example, 1 hour, the script will struggle and finally give a runtime error.
How to solve this?
If we use an array with only primes, we need fewer calculations since if we divide by a non-prime number, we have to divide further until all factors are primes.
I've filled arrays with prime numbers and made libraries of them. (see chapter "Find Prime Numbers" to know how these primes were found).
🔹 Tokens
A hurdle was to fill the libraries with as many prime numbers as possible.
Initially, the maximum token limit of a library was 80K.
Very recently, that limit was lifted to 100K. Kudos to the TradingView developers!
What are tokens?
Tokens are the smallest elements of a program that are meaningful to the compiler. They are also known as the fundamental building blocks of the program.
I have included a code block below the publication code (// - - - Educational (2) - - - ) which, if copied and made to a library, will contain exactly 100K tokens.
Adding more exported functions will throw a "too many tokens" error when saving the library. Subtracting 100K from the shown amount of tokens gives you the amount of used tokens for that particular function.
In that way, one can experiment with the impact of each code addition in terms of tokens.
For example adding the following code in the library:
export a() => a = array.from(1) will result in a 100,041 tokens error, in other words (100,041 - 100,000) that functions contains 41 tokens.
Some more examples, some are straightforward, others are not )
// adding these lines in one of the arrays results in x tokens
, 1 // 2 tokens
, 111, 111, 111 // 12 tokens
, 1111 // 5 tokens
, 111111111 // 10 tokens
, 1111111111111111111 // 20 tokens
, 1234567890123456789 // 20 tokens
, 1111111111111111111 + 1 // 20 tokens
, 1111111111111111111 + 8 // 20 tokens
, 1111111111111111111 + 9 // 20 tokens
, 1111111111111111111 * 1 // 20 tokens
, 1111111111111111111 * 9 // 21 tokens
, 9999999999999999999 // 21 tokens
, 1111111111111111111 * 10 // 21 tokens
, 11111111111111111110 // 21 tokens
//adding these functions to the library results in x tokens
export f() => 1 // 4 tokens
export f() => v = 1 // 4 tokens
export f() => var v = 1 // 4 tokens
export f() => var v = 1, v // 4 tokens
//adding these functions to the library results in x tokens
export a() => const arraya = array.from(1) // 42 tokens
export a() => arraya = array.from(1) // 42 tokens
export a() => a = array.from(1) // 41 tokens
export a() => array.from(1) // 32 tokens
export a() => a = array.new() // 44 tokens
export a() => a = array.new(), a.push(1) // 56 tokens
What if we could lower the amount of tokens, so we can export more Prime Numbers?
Look at this example:
829111, 829121, 829123, 829151, 829159, 829177, 829187, 829193
Eight numbers contain the same number 8291.
If we make a function that removes recurrent values, we get fewer tokens!
829111, 829121, 829123, 829151, 829159, 829177, 829187, 829193
//is transformed to:
829111, 21, 23, 51, 59, 77, 87, 93
The code block below the publication code (// - - - Educational (1) - - - ) shows how these values were reduced. With each step of 100, only the first Prime Number is shown fully.
This function could be enhanced even more to reduce recurrent thousands, tens of thousands, etc.
Using this technique enables us to export more Prime Numbers. The number of necessary libraries was reduced to half or less.
The reduced Prime Numbers are restored using the restoreValues() function, found in the library fikira/Primes_4.
🔹 Find Prime Numbers
This function is merely added to show how I filled arrays with Prime Numbers, which were, in turn, added to libraries (after reduction of recurrent values).
To know whether a number is a Prime Number, we divide the given number by values of the Primes array (Primes 2 -> max. 1,340,011). Once the division results in an integer, where the divisor is smaller than the dividend, the calculation stops since the given number is not a Prime.
When we perform these calculations in a loop, we can check whether a series of numbers is a Prime or not. Each time a number is proven not to be a Prime, the loop starts again with a higher number. Once all Primes of the array are used without the result being an integer, we have found a new Prime Number, which is added to the array.
Doing such calculations on one bar will result in a runtime error.
To solve this, the findPrimeNumbers() function remembers the index of the array. Once a limit has been reached on 1 bar (for example, the number of iterations), calculations will stop on that bar and restart on the next bar.
This spreads the workload over several bars, making it possible to continue these calculations without a runtime error.
The result is placed in log.info() , which can be copied and pasted into a hardcoded array of Prime Number values.
These settings adjust the amount of workload per bar:
Max Size: maximum size of Primes array.
Max Bars Runtime: maximum amount of bars where the function is called.
Max Numbers To Process Per Bar: maximum numbers to check on each bar, whether they are Prime Numbers.
Max Iterations Per Bar: maximum loop calculations per bar.
🔹 The End
❗️ The code and description is written without the help of an LLM, I've only used Grammarly to improve my description (without AI :) )
Tìm kiếm tập lệnh với "美国夏威夷+prime公司"

Prime, E & PI Superiority CyclesIf you have been studying the markets long enough you will probably have noticed a certain pattern. Whichever trade entry/exit logic you try to use, it will go through phases of working really well and phases where it doesn't work at all. This is the markets way of ensuring anyone who sticks to an oversimplified, one-dimensional strategy will not profit. Superiority cycles are a method I devised by which code interrogates the nature of where price has been pivoting in relation to three key structures, the Prime Frame, E Frame and Pi Frame which are plotted as horizontal lines at these values:
* Use script on 1 minute chart ONLY
prime numbers up to 100: 2.0,3.0,5.0,7.0,11.0,13.0,17.0,19.0,23.0,27.0,29.0,31.0,37.0,41.0,43.0,47.0,53.0,59.0,61.0,67.0,71.0,73.0,79.0,83.0,89.0,97.0
multiples of e up to 100: 2.71828, 5.43656, 8.15484, 10.87312, 13.5914, 16.30968, 19.02796, 21.74624, 24.46452, 27.1828, 29.90108, 32.61936, 35.33764,
38.05592, 40.7742, 43.49248, 46.21076, 48.92904, 51.64732, 54.3656, 57.08388, 59.80216, 62.52044, 65.23872, 67.957, 70.67528, 73.39356000000001, 76.11184,
78.83012, 81.5484, 84.26668000000001, 86.98496, 89.70324, 92.42152, 95.13980000000001, 97.85808
multiples of pi up to 100: 3.14159, 6.28318, 9.424769999999999, 12.56636, 15.70795, 18.849539999999998, 21.99113, 25.13272, 28.27431, 31.4159, 34.55749,
37.699079999999995, 40.840669999999996, 43.98226, 47.12385, 50.26544, 53.40703, 56.54862, 59.69021, 62.8318, 65.97339, 69.11498, 72.25657, 75.39815999999999,
78.53975, 81.68133999999999, 84.82293, 87.96452, 91.10611, 94.2477, 97.38929
These values are iterated up the chart as seen below:
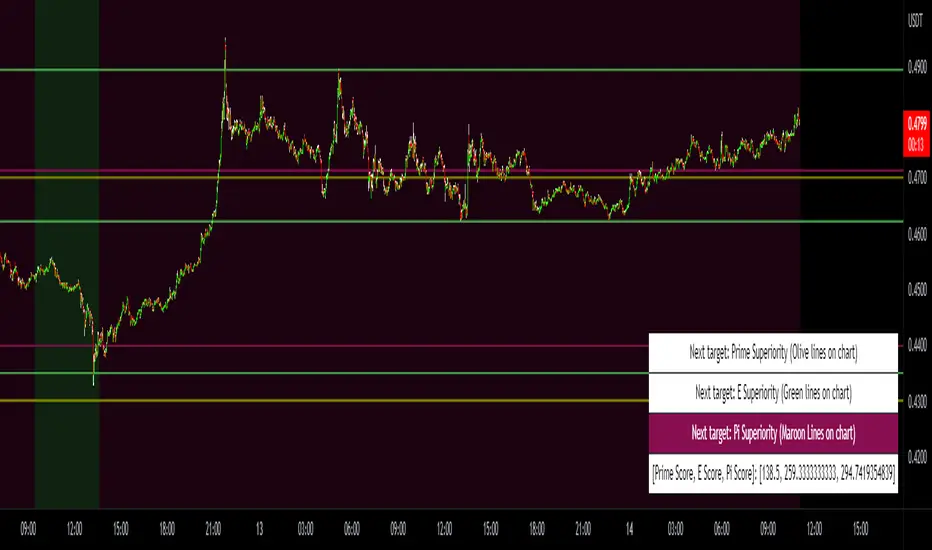
The script sums the distance of pivots to each of the respective frames (olive lines for Prime Frame, green lines for E Frame and maroon lines for Pi Frame) and determines which frame price has been reacting to in the least significant way. The worst performing frame is the next frame we target reversals at. The table in the bottom right will light up a color that corresponds to the frame color we should target.
Here is an example of Prime Superiority, where we prioritize trading from prime levels:
The table and the background color are both olive which means target prime levels. In an ideal world strong moves should start and finish where the white flags are placed i.e. in this case $17k and $19k. The reason these levels are 17,000 and 19,000 and not just 17 and 19 like in the original prime number sequence is due to the scaling code in the get_scale_func() which allows the code to operate on all assets.
This is E Superiority where we would hope to see major reversals at green lines:
This is Pi Superiority where we would hope to see major reversals at maroon lines:
And finally I would like to show you a market moving from one superiority to another. This can be observed by the bgcolor which tells us what the superiority was at every historical minute
Pi Frame Superiority into E Frame Superiority example:
Prime Frame Superiority into E Frame Superiority example:
Prime Frame Superiority into Pi Frame Superiority example:
By rotating the analysis we use to enter trades in this way we hope to hide our strategy better from market makers and artificial intelligence, and overall make greater profits.
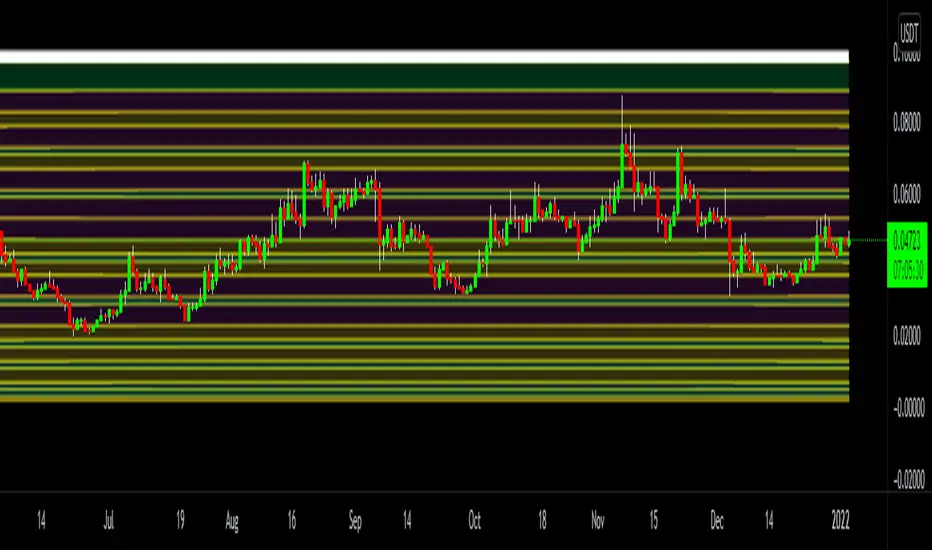
Prime Distance Frame Quant Model for Risk Reward & Pivot PointsIn this script we take all of the prime numbers up to 100 and plot them as olive lines and then consider the distance between two adjacent plots and color code these distances with the fill function. This allows us to find higher and lower prime gaps allowing us to make much more informed decisions on our risk reward for a given trade and the levels where we should consider taking profit.
The Script includes scaling for all assets and is intended to be used for crypto trading.
Prime Number CheckerThis is not a foolproof method for finding every prime number but will work well on assets $10 to $100. I will be working on something more robust with scaling for all assets. If you want a main pane indicator with just the background coloring keep the indicator as it is. If you want a lower pane indicator get rid of the current study function and replace with the commented out study function by deleting the //. Also comment in line 28 also by deleting the //. Prime numbers are an excellent natural mathematical site of reversal and you will begin to see this as you work with them.
Any questions don't be scared to ask.
Eliza.

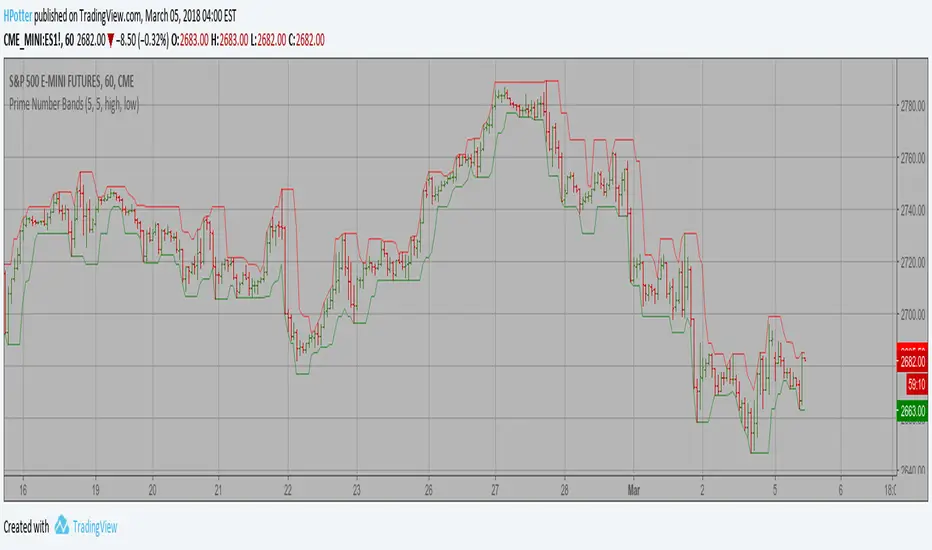
Prime Number Bands Determining market trends has become a science even though a high number
or people still believe it’s a gambling game. Mathematicians, technicians,
brokers and investors have worked together in developing quite several
indicators to help them better understand and forecast market movements.
The Prime Number Bands indicator was developed by Modulus Financial Engineering
Inc. This indicator is charted by indentifying the highest and lowest prime number
in the neighborhood and plotting the two series as a band.
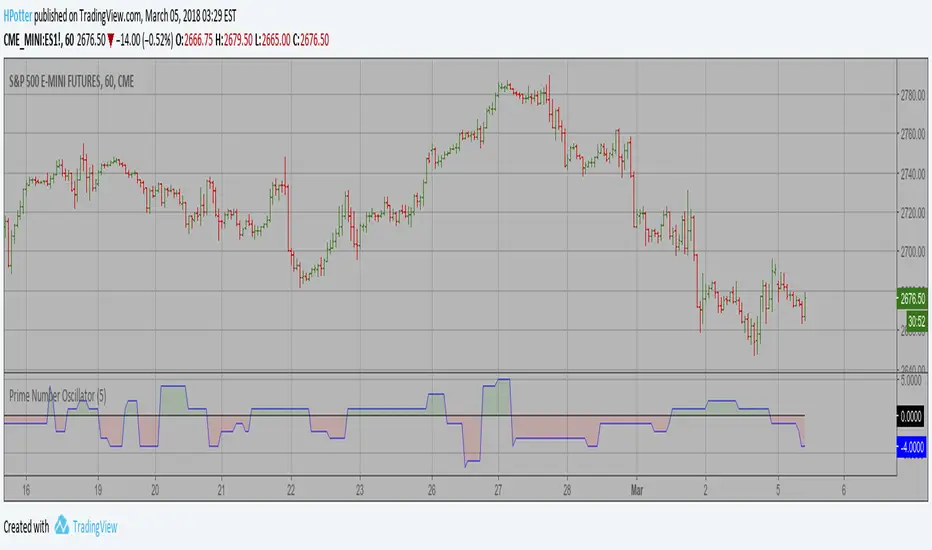
Prime Number Oscillator Determining market trends has become a science even though a high number or people
still believe it’s a gambling game. Mathematicians, technicians, brokers and investors
have worked together in developing quite several indicators to help them better understand
and forecast market movements.
Developed by Modulus Financial Engineering Inc., the prime number oscillator indicates the
nearest prime number, be it at the top or the bottom of the series, and outlines the
difference between that prime number and the respective series.
Prime Fib AvgsHey all,
Just thought some might find it useful to have a script of the first 7 numbers that are both fibonacci and that are prime numbers as simple moving averages and as exponential averages.
If anyone wants any other average type added to this script I can put out another version
Happy trading,
Snoop

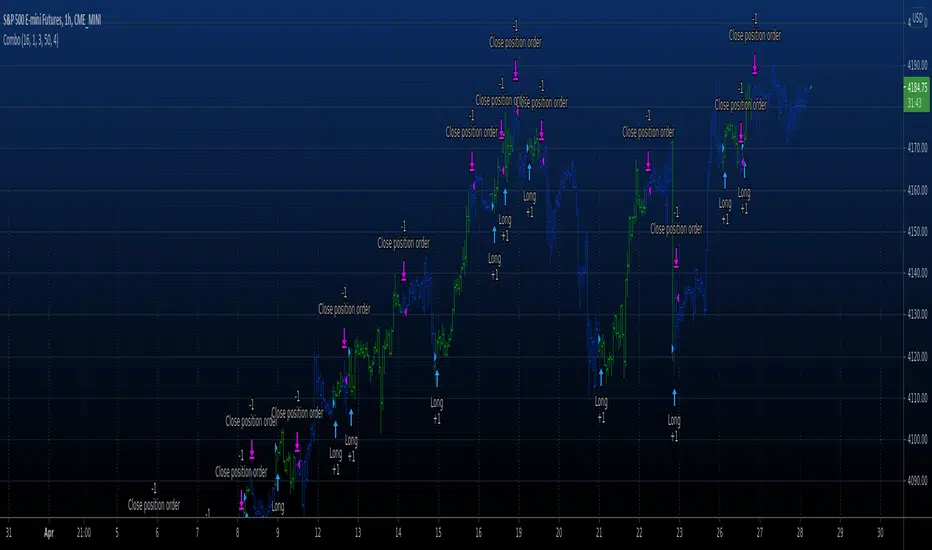
Combo Backtest 123 Reversal & Prime Number Oscillator This is combo strategies for get a cumulative signal.
First strategy
This System was created from the Book "How I Tripled My Money In The
Futures Market" by Ulf Jensen, Page 183. This is reverse type of strategies.
The strategy buys at market, if close price is higher than the previous close
during 2 days and the meaning of 9-days Stochastic Slow Oscillator is lower than 50.
The strategy sells at market, if close price is lower than the previous close price
during 2 days and the meaning of 9-days Stochastic Fast Oscillator is higher than 50.
Second strategy
Determining market trends has become a science even though a high number or people
still believe it’s a gambling game. Mathematicians, technicians, brokers and investors
have worked together in developing quite several indicators to help them better understand
and forecast market movements.
Developed by Modulus Financial Engineering Inc., the prime number oscillator indicates the
nearest prime number, be it at the top or the bottom of the series, and outlines the
difference between that prime number and the respective series.
WARNING:
- For purpose educate only
- This script to change bars colors.
Combo Backtest 123 Reversal & Prime Number Bands This is combo strategies for get a cumulative signal.
First strategy
This System was created from the Book "How I Tripled My Money In The
Futures Market" by Ulf Jensen, Page 183. This is reverse type of strategies.
The strategy buys at market, if close price is higher than the previous close
during 2 days and the meaning of 9-days Stochastic Slow Oscillator is lower than 50.
The strategy sells at market, if close price is lower than the previous close price
during 2 days and the meaning of 9-days Stochastic Fast Oscillator is higher than 50.
Second strategy
Determining market trends has become a science even though a high number
or people still believe it’s a gambling game. Mathematicians, technicians,
brokers and investors have worked together in developing quite several
indicators to help them better understand and forecast market movements.
The Prime Number Bands indicator was developed by Modulus Financial Engineering
Inc. This indicator is charted by indentifying the highest and lowest prime number
in the neighborhood and plotting the two series as a band.
WARNING:
- For purpose educate only
- This script to change bars colors.

PRIME 2.0PRIME 2.0 — Precision Entry Tool
PRIME 2.0 is a smart price action-based indicator designed for intraday traders who want to catch high-probability moves during the London session. It uses a combination of market structure shifts (CHOCH – Change of Character) and session-based timing to identify potential entries.
🔍 Key Features:
Session-Based Logic: Activates after the London market opens, filtering noise from other sessions.
CHOCH Detection: Spots shifts in market structure by identifying crossover and crossunder of candle highs/lows.
Visual Entry Points: Plots real-time entry points based on structure change.
🧠 Who Is It For?
Scalpers and day traders
Traders who follow Smart Money Concepts (SMC)
Anyone looking to improve entry precision without clutter
⚠️ Disclaimer:
This indicator does not generate buy/sell signals or exit points. It is meant to be used as a tool within a broader trading strategy. Combine it with your own risk management and market knowledge for best results

Primes_4These libraries (Primes_1 -> Primes_4) contain arrays of reduced Prime Numbers to minimize the amount of tokens, allowing more information to be exported.
Values, for example:
7001, 7013, 7019, 7027, 7039, 7043, 7057, 7069, 7079, 7103, 7109, 7021
are reduced to:
7001, 13, 19, 27, 39, 43, 57, 69, 79, 7103, 9, 21
With the restoreValues() function found in this library, the reduced values can be restored back to its original state.
7001, 13, 19, 27, 39, 43, 57, 69, 79, 7103, 9, 21
is restored back to:
7001, 7013, 7019, 7027, 7039, 7043, 7057, 7069, 7079, 7103, 7109, 7021
The libraries contain all Prime Numbers from 2 to 1.340.011
------------------------------------------------------------
Library "Primes_4"
Prime Numbers 1.096.031 - 1.340.011
primes_a()
Prime numbers 1.096.031 - 1.205.999
primes_b()
Prime numbers 1.206.013 - 1.317.989
primes_c()
Prime numbers 1.318.003 - 1.340.011
method restoreValues(iArray, iShow, iFrom, iTo)
restoreValues : Restores reduced prime number values in an array to their original state, for example `7001, 13, 19, 27, 39, 43, 57, 69, 79, 7103, 9, 21` is restored to `7001, 7013, 7019, 7027, 7039, 7043, 7057, 7069, 7079, 7103, 7109, 7021`
Namespace types: array
Parameters:
iArray (array)
iShow (bool)
iFrom (int)
iTo (int)
Returns: Initial array with restored prime number values
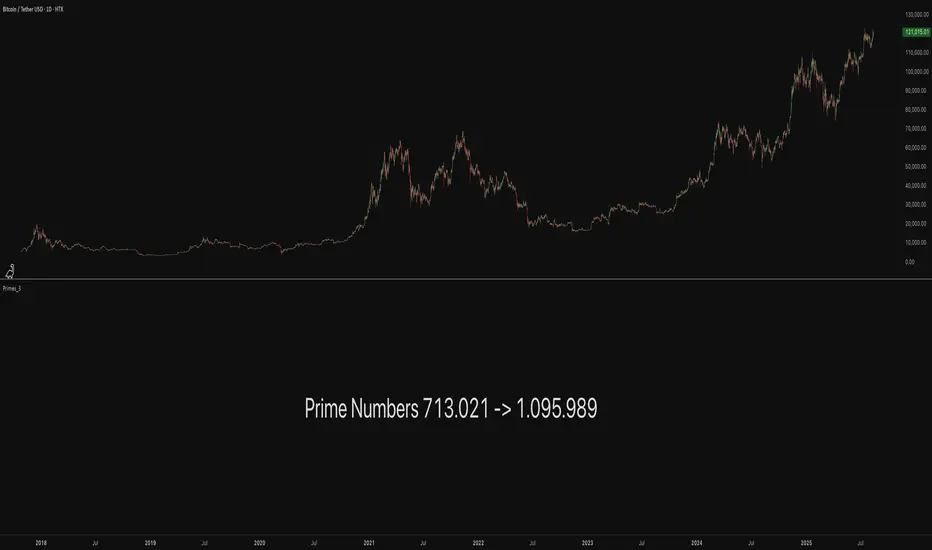
Primes_3These libraries (Primes_1 -> Primes_4) contain arrays of reduced Prime Numbers to minimize the amount of tokens, allowing more information to be exported.
Values, for example:
7001, 7013, 7019, 7027, 7039, 7043, 7057, 7069, 7079, 7103, 7109, 7021
are reduced to:
7001, 13, 19, 27, 39, 43, 57, 69, 79, 7103, 9, 21
With the restoreValues() function found in the Primes_4 library, the reduced values can be restored back to its original state.
7001, 13, 19, 27, 39, 43, 57, 69, 79, 7103, 9, 21
is restored back to:
7001, 7013, 7019, 7027, 7039, 7043, 7057, 7069, 7079, 7103, 7109, 7021
The libraries contain all Prime Numbers from 2 to 1.340.011
------------------------------------------------------------
Library "Primes_3"
Prime Numbers 713.021 - 1.095.989
primes_a()
Prime numbers 713.021 - 820.997
primes_b()
Prime numbers 821.003 - 928.979
primes_c()
Prime numbers 929.003 - 1.038.953
primes_d()
Prime numbers 1.039.001 - 1.095.989
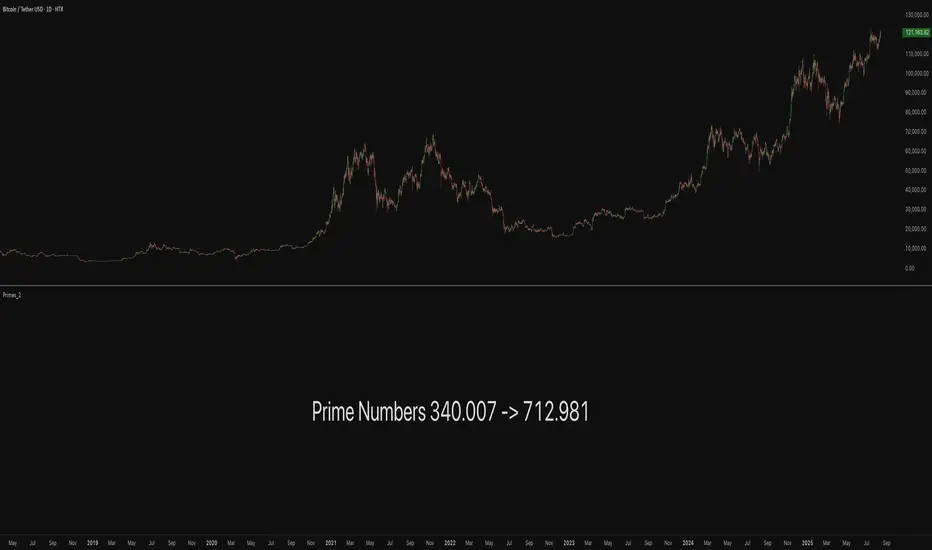
Primes_2These libraries (Primes_1 -> Primes_4) contain arrays of reduced Prime Numbers to minimize the amount of tokens, allowing more information to be exported.
Values, for example:
7001, 7013, 7019, 7027, 7039, 7043, 7057, 7069, 7079, 7103, 7109, 7021
are reduced to:
7001, 13, 19, 27, 39, 43, 57, 69, 79, 7103, 9, 21
With the restoreValues() function found in the Primes_4 library, the reduced values can be restored back to its original state.
7001, 13, 19, 27, 39, 43, 57, 69, 79, 7103, 9, 21
is restored back to:
7001, 7013, 7019, 7027, 7039, 7043, 7057, 7069, 7079, 7103, 7109, 7021
The libraries contain all Prime Numbers from 2 to 1.340.011
------------------------------------------------------------
Library "Primes_2"
Prime Numbers 340.007 - 712.981
primes_a()
Prime numbers 340.007 - 441.971
primes_b()
Prime numbers 442.003 - 545.959
primes_c()
Prime numbers 546.001 - 650.987
primes_d()
Prime numbers 651.017 - 712.981
Primes_1These libraries (Primes_1 -> Primes_4) contain arrays of reduced Prime Numbers to minimize the amount of tokens, allowing more information to be exported.
Values, for example:
7001, 7013, 7019, 7027, 7039, 7043, 7057, 7069, 7079, 7103, 7109, 7021
are reduced to:
7001, 13, 19, 27, 39, 43, 57, 69, 79, 7103, 9, 21
With the restoreValues() function found in the Primes_4 library, the reduced values can be restored back to its original state.
7001, 13, 19, 27, 39, 43, 57, 69, 79, 7103, 9, 21
is restored back to:
7001, 7013, 7019, 7027, 7039, 7043, 7057, 7069, 7079, 7103, 7109, 7021
The libraries contain all Prime Numbers from 2 to 1.340.011
------------------------------------------------------------
Library "Primes_1"
Prime Numbers 2 - 339.991
primes_a()
Prime numbers 2 - 81.689
primes_b()
Prime numbers 81.701 - 175.897
primes_c()
Prime numbers 175.909 - 273.997
primes_d()
Prime numbers 274.007 - 339.991

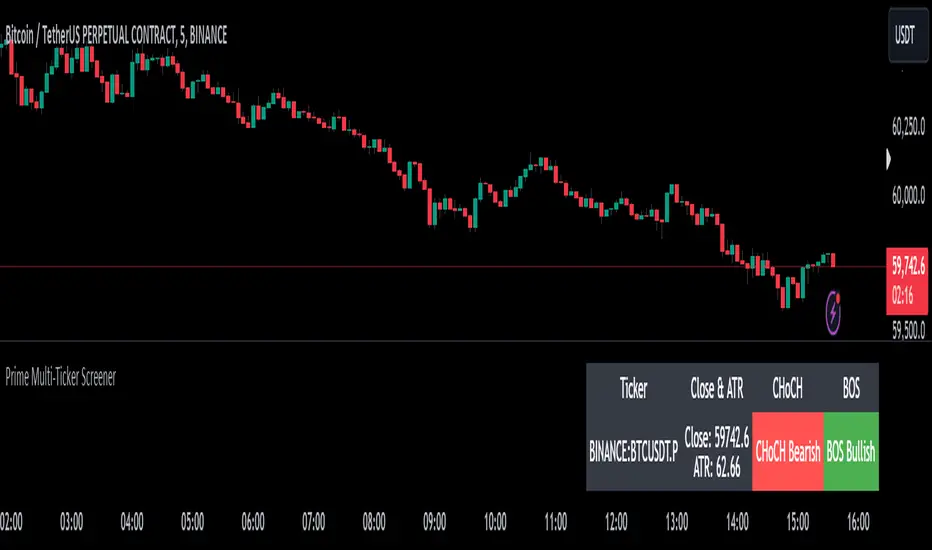
Prime Multi-Ticker Screener: Real-Time Market StructurePrime Multi-Ticker Screener: Real-Time Market Structure and Trend Detection Tool
Prime Multi-Ticker Screener is designed to track multiple tickers simultaneously, providing real-time insights into market trends and structure changes such as CHoCH (Change of Character) and BOS (Break of Structure). This tool is perfect for traders looking to monitor multiple assets across different timeframes while receiving clear signals that highlight critical market shifts. The indicator delivers instant visual feedback with color-coded backgrounds to make interpreting signals easy and efficient.
Core Features of Prime Multi-Ticker Screener
Multi-Ticker Monitoring: Track up to 5 tickers across multiple timeframes in a single dashboard. This makes it easy to watch several assets at once without cluttering your chart.
CHoCH and BOS Detection: The screener automatically detects and highlights significant market structure shifts. CHoCH signals are shown when a trend reverses or consolidates, while BOS signals indicate a break in previous highs or lows, helping traders catch potential trend reversals early.
Color-Coded Visuals: The background of each signal cell dynamically changes color to represent bullish or bearish signals. Green indicates bullish activity, while red highlights bearish market shifts, making it easy for traders to identify key movements at a glance.
Close Price and ATR Data: For each ticker, the screener displays both the current close price and the 14-period Average True Range (ATR), providing important volatility information to support decision-making.
Detailed Explanation of How Prime Multi-Ticker Screener Works
Prime Multi-Ticker Screener combines trend detection with real-time market structure analysis to deliver comprehensive market insights. It analyzes the following components:
CHoCH Detection: Change of Character occurs when the market switches from trending to ranging or vice versa. This indicator catches these moments by identifying when prices cross pivot levels, providing traders with a valuable signal of potential market phase changes.
BOS Detection: The Break of Structure function highlights moments when the price breaks a significant high or low, often indicating the start of a new trend or the continuation of an existing one.
Close Price & ATR Monitoring: Alongside market structure signals, the screener provides real-time data on the close price and the Average True Range (ATR), ensuring traders have a complete picture of the price and volatility landscape for each asset they are tracking.
Why It's Useful for Traders
Prime Multi-Ticker Screener is a versatile tool that offers substantial benefits to traders who want to stay informed about multiple assets and trends simultaneously:
Comprehensive Monitoring: Track multiple assets in real time, all from a single indicator. Whether you trade crypto, forex, or stocks, this tool helps you stay on top of market movements across different assets and timeframes.
Market Structure Analysis: The automatic detection of CHoCH and BOS signals gives traders an edge by identifying potential reversals and trend continuations as they happen, allowing for more timely and informed trading decisions.
Efficient and Intuitive Design: The screener is designed with simplicity in mind. The color-coded backgrounds quickly alert traders to market structure shifts without overwhelming them with data, making it ideal for those who need to act fast.
How It Works: Practical Usage
Prime Multi-Ticker Screener is ideal for:
Day traders: The real-time tracking of multiple assets allows day traders to quickly spot trading opportunities across different markets.
Swing traders: CHoCH and BOS detection help swing traders catch key market structure shifts, helping them align trades with emerging trends.
Trend followers: The screener provides instant feedback on when a trend is continuing or breaking, helping trend-following traders maintain their positions or exit early when needed.
By combining multiple key metrics—price, volatility, and market structure—Prime Multi-Ticker Screener ensures traders are well-equipped to manage their positions across a variety of assets.
Risk Disclaimer
While Prime Multi-Ticker Screener provides valuable market insights, it's important to remember:
Past performance is not indicative of future results: This screener provides analysis based on historical data, and no indicator can predict future market movements with certainty.
Market Conditions: The effectiveness of Prime Multi-Ticker Screener may vary in different market conditions, so traders should always use proper risk management when trading.
Trading Risks: Like any trading tool, Prime Multi-Ticker Screener should be used as part of a comprehensive trading strategy, including risk management techniques such as stop-loss orders and position sizing.
Prime-Time × Vortex (3/6/9) — Ace (clean v3)1️⃣ Prime-Time Index (PT)
A bar becomes Prime-Time when the count satisfies the formula:
4·n − 3 is a perfect square
This generates the sequence:
1, 3, 7, 13, 21, 31, 43, 57, 73, 91, …
These are time windows where price is more likely to form:
Shifts in market structure
Impulses
Reversals
Liquidity expansions
These PT bars are drawn as small circles above the candle.
If labels are enabled, the counter value (n) is also shown.
2️⃣ Vortex 3/6/9 Digital-Root Timing
Every bar also has a digital root, calculated from the counter:
If n → digitalRoot(n) = 3, 6, or 9,
the bar is considered a Vortex bar.
These moments often align with:
Swing highs / swing lows
Micro shifts
Mini-reversals
Minor liquidity grabs
When a Prime-Time bar is also a 3/6/9 bar → high-probability timing.
These bars are highlighted in green by default.
3️⃣ Filters & Display
You can customize:
Anchor time → when counting begins
Reset daily → restart counter each new trading day
Show only 3/6/9 → hides normal PT hits
Label offset → distance above the candle
Color themes
This makes the indicator usable on:
1Min
5Min
15Min
1H
Any timeframe you want
4️⃣ How To Apply It in Trading
Use it as a time confluence tool, not a signal generator.
✔ Best ways to use:
Look for MSS, sweeps, OB retests, FVG reactions when
they occur on or near a Prime-Time or 3/6/9 bar
Expect volatility increases after PT bars
Use 3/6/9 hits to anticipate internal turning points
Combine with:
Session High/Low
Killzones (London, NYO, PM)
Purge Protocol
MMXM Execution
✔ Example:
If price sweeps a level and prints a 3/6/9 vortex bar inside a PT window →
you have a very strong timing alignment for reversal.
5️⃣ Simple Summary
Feature Meaning
Prime-Time Hit (PT) Major time window where price often shifts
3/6/9 Vortex Bar Micro-timing for internal swings
PT + 3/6/9 together High-probability timing for entries
Reset Daily Perfect for intraday models like NYO & London
Anchor Time Defines the entire cycle structure

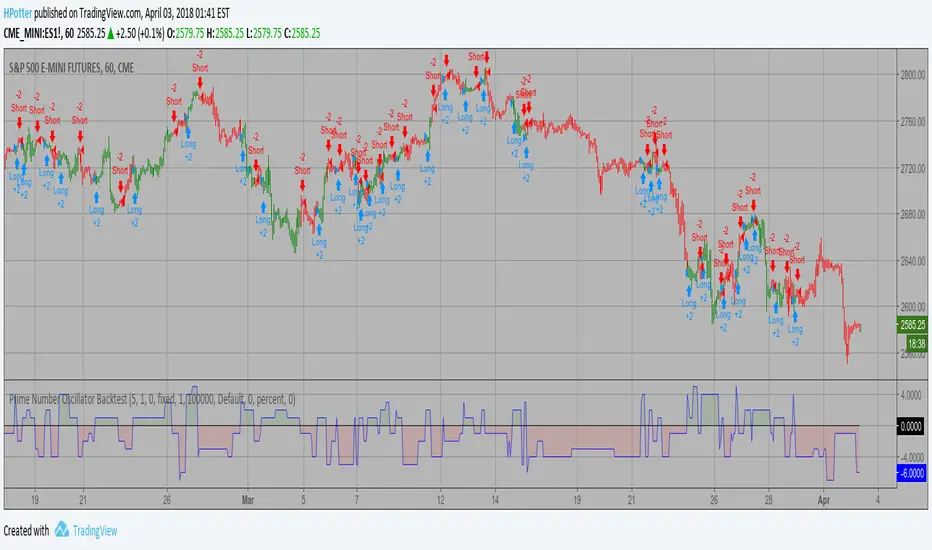
Prime Number Oscillator Backtest Determining market trends has become a science even though a high number or people
still believe it’s a gambling game. Mathematicians, technicians, brokers and investors
have worked together in developing quite several indicators to help them better understand
and forecast market movements.
Developed by Modulus Financial Engineering Inc., the prime number oscillator indicates the
nearest prime number, be it at the top or the bottom of the series, and outlines the
difference between that prime number and the respective series.
You can change long to short in the Input Settings
WARNING:
- For purpose educate only
- This script to change bars colors.
Prime Number Oscillator Strategy Determining market trends has become a science even though a high number or people
still believe it’s a gambling game. Mathematicians, technicians, brokers and investors
have worked together in developing quite several indicators to help them better understand
and forecast market movements.
Developed by Modulus Financial Engineering Inc., the prime number oscillator indicates the
nearest prime number, be it at the top or the bottom of the series, and outlines the
difference between that prime number and the respective series.
WARNING:
- This script to change bars colors.

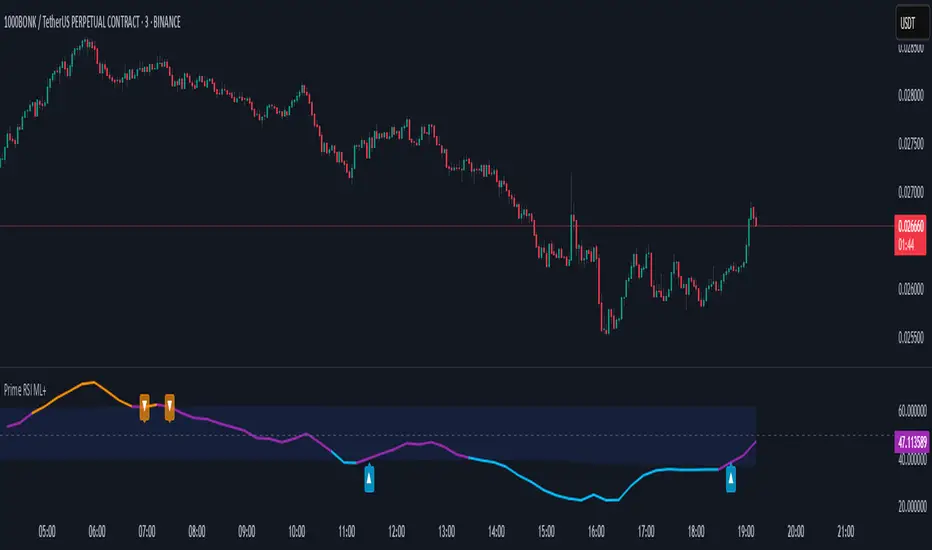
prime rsiThe "PRIME RSI" is a custom variation of the traditional RSI (Relative Strength Index) that offers enhanced flexibility and precision. This indicator provides an adaptable approach for tracking market conditions across different timeframes, making it an ideal tool for both short-term and long-term traders.
Key Features:
Custom Timeframe Selection: Users can select any timeframe to calculate the RSI, providing the ability to analyze data beyond the current chart's timeframe.
Smoothing Methods: Choose between Exponential Moving Average (EMA), Simple Moving Average (SMA), or the Relative Moving Average (RMA) for smoother, more accurate RSI values.
Signal Line: The signal line is smoothed using the selected method and visualized with dynamic coloring to indicate bullish (green) or bearish (red) market conditions.
Overbought/Oversold Levels: Clear levels at 70 (overbought) and 30 (oversold), with fill zones to highlight extreme market conditions, helping traders spot potential reversal points.
Midline at 50: The centerline at 50 serves as a neutral zone, allowing traders to identify shifts in market momentum quickly.
Practical Use:
Trend Confirmation: Use the PRIME RSI to confirm the prevailing market trend, with signals above 50 suggesting bullish momentum and signals below 50 indicating bearish trends.
Overbought/Oversold Conditions: The indicator’s overbought and oversold regions help pinpoint potential market reversals, giving traders valuable entry and exit signals.
Ideal For: All types of traders who want a more flexible and customizable RSI for better trend analysis, especially those working with smaller timeframes or seeking a more responsive momentum indicator.
Prime Bands [ChartPrime]The Prime Standard Deviation Bands indicator uses custom-calculated bands based on highest and lowest price values over specific period to analyze price volatility and trend direction. Traders can set the bands to 1, 2, or 3 standard deviations from a central base, providing a dynamic view of price behavior in relation to volatility. The indicator also includes color-coded trend signals, standard deviation labels, and mean reversion signals, offering insights into trend strength and potential reversal points.
⯁ KEY FEATURES AND HOW TO USE
⯌ Standard Deviation Bands :
The indicator plots upper and lower bands based on standard deviation settings (1, 2, or 3 SDs) from a central base, allowing traders to visualize volatility and price extremes. These bands can be used to identify overbought and oversold conditions, as well as potential trend reversals.
Example of 3-standard-deviation bands around price:
⯌ Dynamic Trend Indicator :
The midline of the bands changes color based on trend direction. If the midline is rising, it turns green, indicating an uptrend. When the midline is falling, it turns orange, suggesting a downtrend. This color coding provides a quick visual reference to the current trend.
Trend color examples for rising and falling midlines:
⯌ Standard Deviation Labels :
At the end of the bands, the indicator displays labels with price levels for each standard deviation level (+3, 0, -3, etc.), helping traders quickly reference where price is relative to its statistical boundaries.
Price labels at each standard deviation level on the chart:
⯌ Mean Reversion Signals :
When price moves beyond the upper or lower bands and then reverts back inside, the indicator plots mean reversion signals with diamond icons. These signals indicate potential reversal points where the price may return to the mean after extreme moves.
Example of mean reversion signals near bands:
⯌ Standard Deviation Scale on Chart :
A visual scale on the right side of the chart shows the current price position in relation to the bands, expressed in standard deviations. This scale provides an at-a-glance view of how far price has deviated from the mean, helping traders assess risk and volatility.
⯁ USER INPUTS
Length : Sets the number of bars used in the calculation of the bands.
Standard Deviation Level : Allows selection of 1, 2, or 3 standard deviations for upper and lower bands.
Colors : Customize colors for the uptrend and downtrend midline indicators.
⯁ CONCLUSION
The Prime Standard Deviation Bands indicator provides a comprehensive view of price volatility and trend direction. Its customizable bands, trend coloring, and mean reversion signals allow traders to effectively gauge price behavior, identify extreme conditions, and make informed trading decisions based on statistical boundaries.

Prime Number Bands Backtest Determining market trends has become a science even though a high number
or people still believe it’s a gambling game. Mathematicians, technicians,
brokers and investors have worked together in developing quite several
indicators to help them better understand and forecast market movements.
The Prime Number Bands indicator was developed by Modulus Financial Engineering
Inc. This indicator is charted by indentifying the highest and lowest prime number
in the neighborhood and plotting the two series as a band.
You can change long to short in the Input Settings
WARNING:
- For purpose educate only
- This script to change bars colors.

Prime Number Bands Strategy Determining market trends has become a science even though a high number
or people still believe it’s a gambling game. Mathematicians, technicians,
brokers and investors have worked together in developing quite several
indicators to help them better understand and forecast market movements.
The Prime Number Bands indicator was developed by Modulus Financial Engineering
Inc. This indicator is charted by indentifying the highest and lowest prime number
in the neighborhood and plotting the two series as a band.
WARNING:
- This script to change bars colors.

