IV Rank & Percentile Suite V1.0What This Indicator Does
The IV Rank & Percentile Suite provides the volatility context options traders need to time entries. It calculates two complementary metrics—IV Rank and IV Percentile—using historical volatility as a proxy, then displays clear visual zones to identify favorable conditions for premium selling strategies.
Stop guessing if volatility is "high" or "low." This indicator tells you exactly where current volatility sits relative to recent history.
The Two Metrics Explained
IV Rank (0-100) Measures where current volatility sits within its 52-week high-low range.
IV Rank = (Current HV - 52w Low) / (52w High - 52w Low) × 100
70 means current volatility is 70% of the way between the yearly low and high
Sensitive to extreme spikes (a single high reading affects the range)
IV Percentile (0-100) Measures what percentage of days in the lookback period had lower volatility than today.
IV Percentile = (Days with lower HV / Total days) × 100
70 means volatility was lower than today on 70% of days in the past year
More stable, less affected by outlier spikes
Why Both?
IV Rank reacts faster to volatility changes. IV Percentile is more stable and statistically robust. When both agree (e.g., both above 50), you have stronger confirmation. Divergence between them can signal transitional periods.
Zone System
The indicator divides readings into three zones:
Zone ------- Default Range ---- Meaning ------------------ Premium Selling
🟢 High ≥ 50 Elevated volatility Favorable
🟡 Neutral 25-50 Normal volatility Selective
🔴 Low ≤ 25 Compressed volatility Avoid
An additional Extreme threshold (default 75) highlights prime conditions when volatility is significantly elevated.
Zone thresholds are fully customizable in settings.
How to Use It
For Premium Sellers (Iron Condors, Credit Spreads, Strangles)
Wait for IV Rank to enter the green zone (≥50)
Confirm IV Percentile agrees (also elevated)
Enter premium selling positions when both metrics align
Avoid initiating new positions when in the red zone
For Premium Buyers (Long Options, Debit Spreads)
Low IV Rank/Percentile means cheaper options
Red zone can favor directional debit strategies
Avoid buying premium when both metrics are in the green zone
General Principle:
Sell premium when volatility is high (it tends to revert to mean). Buy premium when volatility is low (if you have a directional thesis).
Inputs
Volatility Calculation
HV Period — Lookback for historical volatility calculation (default: 20)
Trading Days/Year — 252 for stocks, 365 for crypto
Lookback Periods
IV Rank Lookback — Period for high/low range (default: 252 = 1 year)
IV Percentile Lookback — Period for percentile calculation (default: 252)
Zone Thresholds
High IV Zone — Readings above this are highlighted green (default: 50)
Low IV Zone — Readings below this are highlighted red (default: 25)
Extreme High — Threshold for "prime" conditions alert (default: 75)
Display Options
Toggle IV Rank, IV Percentile, and raw HV display
Show/hide zone backgrounds
Show/hide info panel
Panel position selection
Info Panel
The panel displays:
Field ------- Description
IV Rank ------- Current reading with color coding
IV Pctl ------- Current percentile with color coding
HV 20d ------- Raw historical volatility percentage
52w Range ------- Lowest to highest HV in lookback period
Zone ------- Current zone status
Premium ------- Signal quality for premium selling
Lookback ------- Days used for calculations
R/P Spread ------- Difference between Rank and Percentile
Alerts
Six alerts are available:
Zone Transitions
IV Entered High Zone — Favorable for premium selling
IV Reached Extreme Levels — Prime conditions
IV Dropped to Low Zone — Caution for premium sellers
Threshold Crosses
IV Rank Crossed Above High Threshold
IV Rank Crossed Below Low Threshold
IV Percentile Above 75
IV Percentile Below 25
Set up alerts to get notified when conditions change without watching charts.
Technical Notes
Volatility Calculation Method
This indicator uses close-to-close historical volatility as an IV proxy:
Calculate log returns: ln(Close / Previous Close)
Take standard deviation over HV Period
Annualize: multiply by √(Trading Days)
This method correlates well with implied volatility for most liquid instruments. On highly liquid options underlyings (SPY, QQQ, major stocks), HV and IV tend to move together, making this a reliable proxy for IV Rank analysis.
Non-Repainting
All calculations use confirmed bar data. Values are fixed once a bar closes.
Lookback Requirement
The indicator needs sufficient history to calculate accurately. For a 252-day lookback, ensure your chart has at least 300+ bars of data.
Best Used On
ETFs: SPY, QQQ, IWM, DIA
Indices: SPX, NDX
High-volume stocks: AAPL, TSLA, NVDA, AMD, META
Timeframe: Daily (recommended), Weekly for longer-term view
The indicator works on any instrument but is most meaningful on underlyings with active options markets.
Important Notes
⚠️ This indicator uses historical volatility as a proxy for implied volatility. While HV and IV are correlated, they are not identical. For precise IV data, consult your options broker's platform.
⚠️ High IV Rank does not guarantee profitable premium selling. It indicates favorable conditions, not guaranteed outcomes. Position sizing and risk management remain essential.
⚠️ Past volatility patterns do not guarantee future behavior. Volatility regimes can shift, and historical ranges may not predict future ranges.
Suggested Workflow
Add to daily chart of your preferred underlying
Set up alert for "IV Entered High Zone"
When alerted, check both IV Rank and IV Percentile
If both elevated, evaluate premium selling opportunities
Use your broker's actual IV data for final entry decisions
Questions? Leave a comment below.
Selling

Short Sale Restriction (SSR) Level - Intraday and daily chartsThis script plots the Short Sale Restriction (SSR) Level relative to the previous day's closing price. It works on any time frame from 1 minute to daily, showing the correct level even during the extended session.
The Short Sale Restriction (SSR) is a rule of the Securities and Exchange Commission (SEC) that restricts traders from short-selling stocks that are rapidly decreasing in value in an attempt to profit from the price drop. The rule was introduced in 2010, after the 2008 financial crisis, to prevent market manipulation and excessive volatility.
The SSR works as follows: when the price of a particular stock drops 10% compared to the previous day's closing price, the SSR is triggered and a temporary limitation is imposed on traders' ability to short-sell that stock for the rest of the trading day and the following day. During the SSR activation period, traders can still short-sell, but only if the sale is "covered" by another long position on the same stock.
Knowledge of the SSR level is especially important for day traders because it helps them to plan their trading strategies in advance, avoiding situations where short-selling becomes more difficult. Additionally, if a stock has exceeded the SSR threshold, traders can expect an increase in price volatility.
Buying and Selling Pressure Raw Multi (TG Fork)Visualize raw buying and selling pressure via 3 different calculation methods, all superimposed with dynamic rescaling.
Buying and selling pressure is the concept of quantifying the disproportion between buying and selling. In practice, there is no single definitive way to calculate it.
This indicator is a merge to display three different methods to calculate buying and selling pressure, with automatic visual rescaling to superimpose the three simultaneously, updated to PineScript v5, and with some additional improvements for speed and calculation precisions, and instead of the EMA, other types of moving averages can be used.
I primarily made it for my own needs, but as always, I like sharing with the community, as maybe others may find this useful too.
How to use:
* As often, the goal is to get as many of the 3 signals concur together to get a stronger aggregated signal.
* First signal: If the green bars on the histogram are bigger than the red ones, then there is more buying pressure, and vice versa.
* Second signal: If the background is green, there is more buying pressure, and vice versa if the background is orange. The yellow and green lines define the background color, but they are by default hidden for a less cluttered visual experience.
* Third signal: If the cloud is blue, there is more buying pressure, and the bigger the cloud, the more momentum there is for it to stay (and more difficult it is to reverse to selling pressure). If the cloud is red, there is more selling pressure.
If you like this indicator, please don't give me any credit, instead please show some love to the original authors (in no particular order):
ceyhun:
daytraderph (I could not find the link to the original script, the page is inaccessible?):
www.tradingview.com
fract:

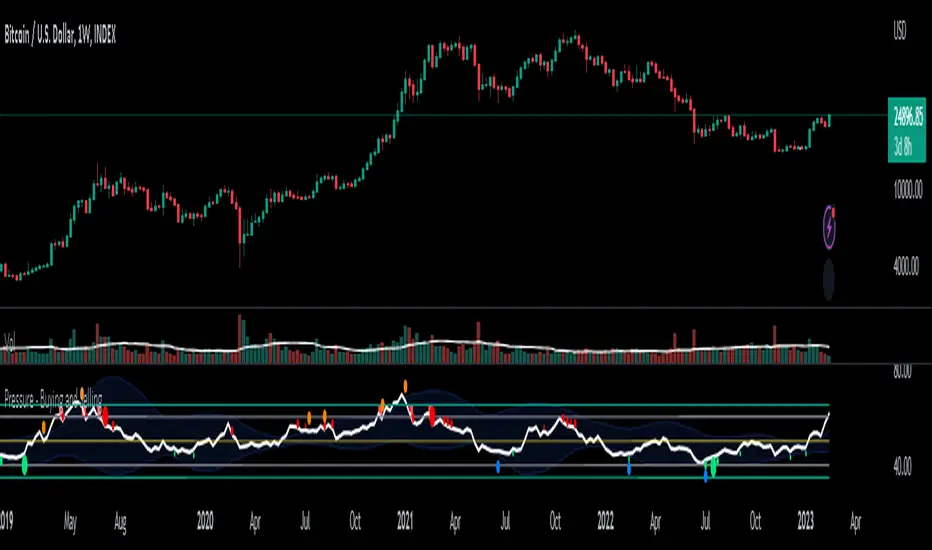
Pressure - Buying and SellingThis is the Pressure Indicator.
The Pressure Indicator analyzes a number of price ratios to measure the pressure of Buyers and Sellers.
I’ve also added to the indicator:
1) Moving Averages (MA) – You can choose 3 types of MA:
- Simple Moving Average (SMA)
- Exponential Moving Average (EMA) - default
- Volume Weighted Moving Average (VWMA)
- Arnaud Legoux Moving Average (ALMA)
By default the MA are not displayed. You can turn them on or off.
2) Standard Deviation Bands and MA Bands – Bands only for the MA type 1 selection. Usually, the Pressureis inside the Bands. If it is beyond the Bands that could mean the current trend is ending. The MA Bands are turned off by default but you can turn them on the Styles Tab Menu.
3) Levels for Overbought and Oversold Zones:
- Gray Overbought 60
- Gray Oversold 40
4) Levels for Buying and Selling Pressure (3 types of pressure + 1 more). If the Pressure is crossing various intermediate levels that means there is Buying or Selling Pressure at those levels.
5) Signals for Crossing Overbought and Oversold Levels:
- Top Red fills for Crossing Down Overbought Level
- Bottom Lime fills for Crossing Up Oversold Level
6) Signals for Buying and Selling Pressure:
- Buy Pressure 1 and 2 are the smaller lime dots.
- Buy Pressure 1 and 2 together are the bigger lime dots.
- Buy Pressure 3 (Crossing Deviation Bands Up) are the blue dots.
- Sell Pressure 1 and 2 are the smaller red dots.
- Sell Pressure 1 and 2 together are the bigger red dots.
- Sell Pressure 3 (Crossing Deviation Bands Down) are the orange dots.
If there are more than one dot appearing at the same moment they will appear displaced in a vertical way at the same time.
If there is something wrong with the code or its calculations, please let me know.
If you want to modify or improve the code, feel free to do that, but please let me know the changes you made.
This Indicator is very accurate when using the Weekly Timeframe . I hope you enjoy it!
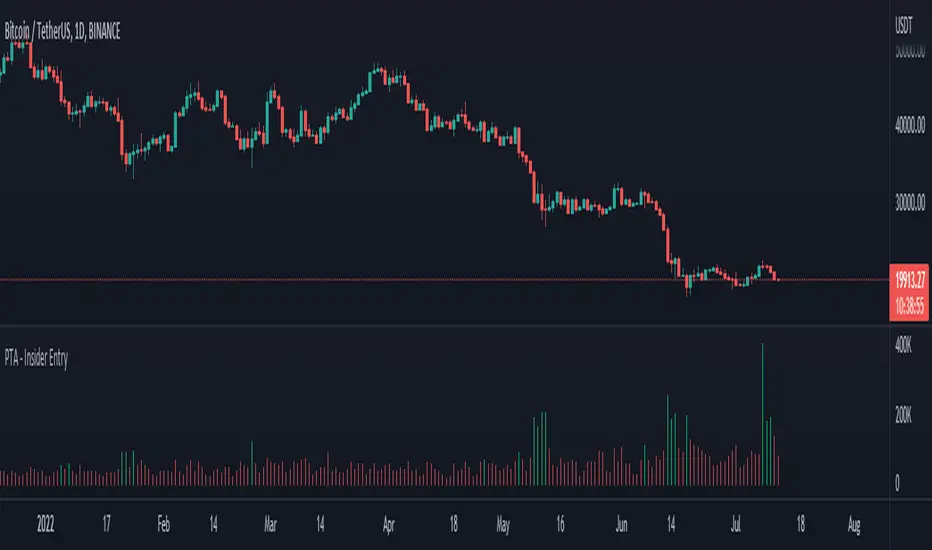
Pro Trading Art - Insider Entry with alertThis indicator is based on volume and ma. This will help you to detect higher volume on chart. You can create alert to stay updated. I am using Fibonacci golden ratio to multiply the current volume. My logic is if volume comes greater than factor of Fibonacci number and current volume then consider it as a insider entry.
Artharjan INDIA VIX v/s Nifty Volatility DashboardHi,
I have created Artharjan INDIA VIX v/s Nifty Volatility Dashboard to forecast the Annual, Quarterly, Monthly, Weekly, Daily and Hourly Volatility of NIFTY Benchmark Index based on current value of INDIA VIX. This will help Index Options Sellers to decide the range of Nifty for the given period based on current level of volatility indicated by INDIA VIX.
Options Sellers may make use of the Min Range and Max Range values for the Strike Price Selection.
Regards
Rahul Desai
@Artharjan

Buying climax and Selling climaxBuying climax and Selling climax appear at the end of bullish and bearish market ..i trade them little bit different way .when price break buying and selling climax i look for trade sharing some example
Breakout and test of buying climax high
same with selling climax ..there can be various method to take trade
A) trend continue method
1) when buying climax appear at bullish trend and price break it then take trade as breakout upside + test pullback trade
2) when selling climax appear at bear trend and price break it then take trade as breakout downside + test pullback trade
B)trend reversal method
1) when buying climax appear at top of the trend trader can look for reversal
2)when selling climax appear at bottom of the trend trader can look for reversal
thanks @yaheesweety for Boring and Explosive Candles script . i add volume for filter and line so i can check high and low of buying climax

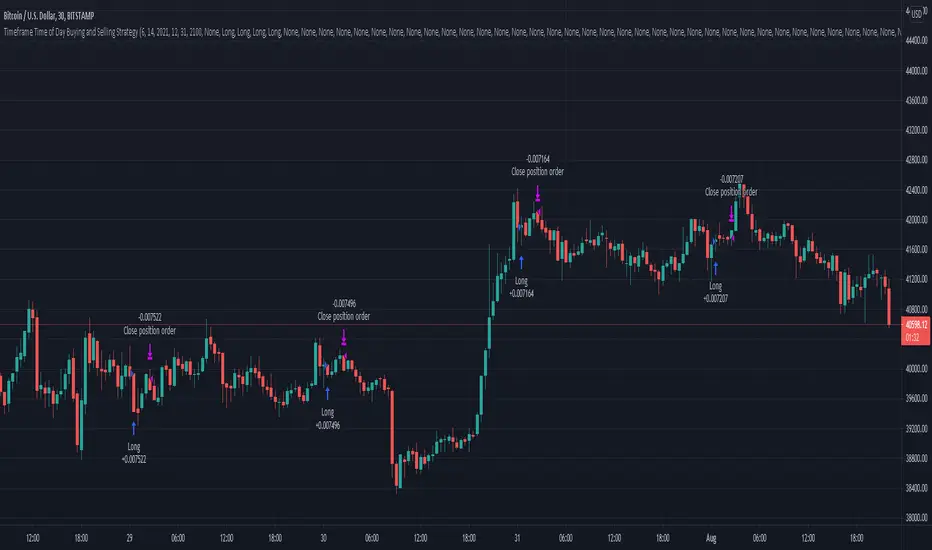
Timeframe Time of Day Buying and Selling StrategyThis strategy allows you to back test longing or shorting or do nothing during time increments of 30 minutes. The price trends in one direction every 30 minutes and this strategy allows you to test various 30 minute time frames across a range of dates to capitalize on this.
Make sure you are in the 30 minute time frame while viewing the performance and trade history.
Rolling Cumulative VolumeThis indicator show a simple rolling cumulative volume. A field is specified. Then all last volume indicators are summed.
For example it could calculate last 24h Volume if you use the 1h bars and set the length for 24.
Day's Buy Sell Volume label
This indicator looks simple but it was bit tricky to code and to make it work on all time frames .
I have used array in this to showcase the use of array, array give you more flexibly.
It works on all time frame 1m 2m 3m 5m 10m 15m 30m 60m 120m.
When the time frame is greater than the or equal to "D" it will show the current bar volume only.
Total volume is made up of buying volume and selling volume. Buying volume is the number of shares, contracts, or lots that were associated with buying trades, and selling volume is the number that were associated with selling trades.
This indicator shows two labels green one is showing the buying volume of the current day and the red label is showing the selling volume of the current day.
I am making this code available to all.
This code is for Total volume is made up of buying volume and selling volume. Buying volume is the number of shares,
contracts, or lots that were associated with buying trades, and selling volume is the number that were associated with selling trades.
//thanks to @Doc6272 who asked to make this indicator Label

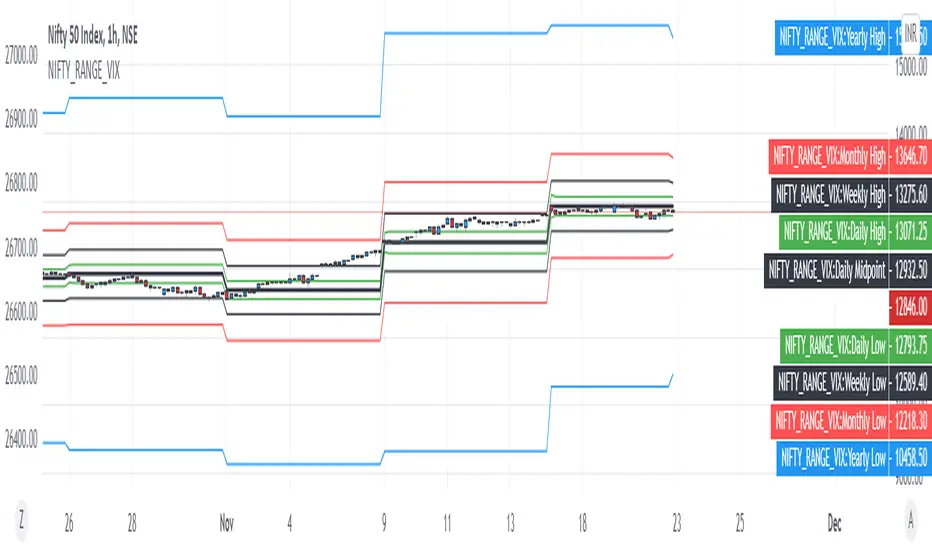
NIFTY VIX BANDSThis script can be used to visually identify the 1 standard deviation range of price movement anticipated by NSE ticker for Volatility Index NSE:INDIAVIX
Ideal to use on NSE:NIFTY ticker only!
The NIFTY range is extended to Yearly, Monthly, Weekly, Daily based on the current value of INDIAVIX.
All options are customizable:
Time frame of the VIX Bands
Select / De-select of Plots for Yearly, Monthly Weekly and Daily
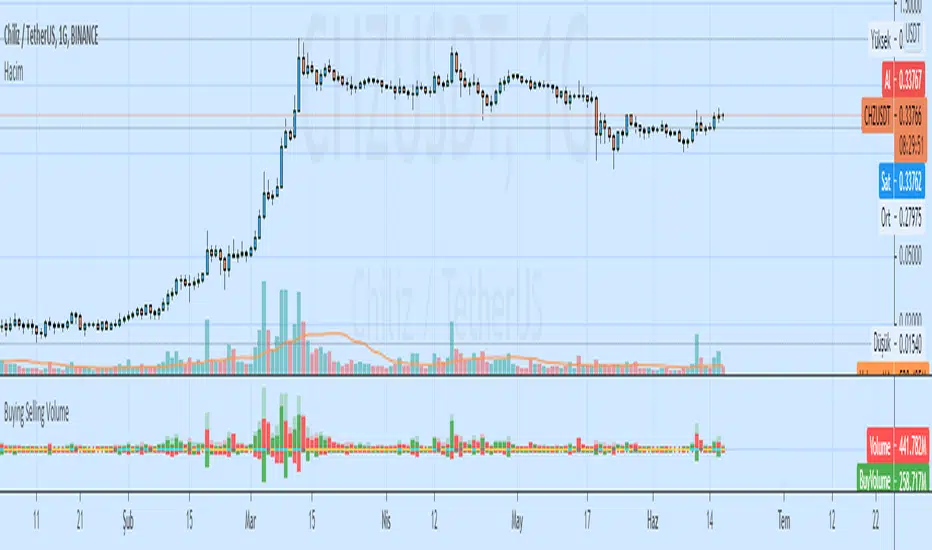
Buying Selling VolumeBuying Selling Volume
-Buy Volume
-Sell Volume
-Buy Volume Percent %
-Sell Volume Percent %
-Volume Index
-Buy Sell Volume-
BuyVolume>SellVolume=Blue barcolor
SellVolume>BuyVolume=Purple barcolor
-Volume Index-
VolumeIndex>length and close > open =Cyan barcolor
VolumeIndex>length and close < open =Gray barcolor
VolumeIndex<=length = Yellow barcolor
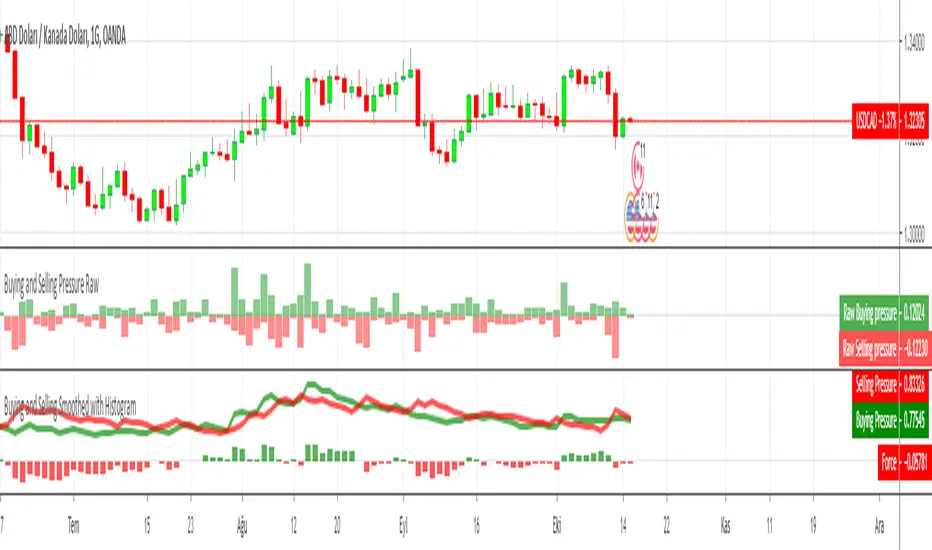
Buying and Selling Smoothed with HistogramBuying and Selling Smoothed with Histogram
Smoothed version with version with a red line representing the selling pressure and a green line which represents the Buying pressure.
If the green line is above the red line it would mean that the Buying pressure is more and vice versa.
The difference between the two is plotted as a Histogram. This is a cumulative value of the buying and selling pressure and provides a easy visual presentation of the dominating pressure.

Buying and Selling Pressure RawBuying and Selling Pressure Raw
Raw Buying and selling pressure Indicator. The Raw buying and selling indication is provided in terms of a Columns.
Green bars above zero show the buying pressure and the red bars below the zero line show the selling pressure.
This presents a good visual representation of the dominating pressure.
SSR - Short Selling Restriction PriceThis script draws the short selling restriction level in the intraday chart

