SCOTTGO - RVOL Bull/Bear Painter (Real-Time) SCOTTGO - RVOL Bull/Bear Painter (Real-Time Momentum Detection)
📌Overview
The RVOL Bull/Bear Painter is a Pine Script indicator designed to instantly highlight high-momentum candles driven by significant Relative Volume (RVOL).
It provides a clear visual signal (bar color, shape, and label) when a candle's volume exceeds its average by a user-defined threshold, confirming strong bullish or bearish interest in real-time. This helps traders quickly identify potential institutional accumulation/distribution or breakout/breakdown attempts.
✨ Key Features
Relative Volume (RVOL) Calculation: Automatically calculates the ratio of the current bar's volume to its moving average (SMA or EMA) over a customizable lookback period.
Momentum Confirmation: Paints the candle green (bullish) or red (bearish) only when both price direction and high RVOL criteria are met.
Real-Time Detection: Uses a plotshape method to display the signal triangle as soon as the RVOL and direction conditions are met on the currently forming candle, aiming for faster alerts than bar-close coloring.
Customizable Threshold: Easily adjust the RVOL multiplier (e.g., 1.5x, 2.0x, 3.0x) to filter out noise and only focus on truly significant volume events.
Labels and Alerts: Displays a volume multiplier label (e.g., BULL 2.55x) and includes pre-configured alert conditions for automated notifications.
🛠️ How to Use It
1. Identify High-Conviction Moves
Look for the painted candles and the corresponding labels. A candle painted green with a BULL label (e.g., BULL 2.5x) indicates that buyers stepped in with 2.5 times the typical volume to drive the price higher.
2. Configure Your Sensitivity
The power of the script lies in customizing the inputs:
RVOL Lookback Period: Determines the length of the volume moving average.
Shorter periods (e.g., 9-20) make the indicator more reactive to recent volume changes.
Longer periods (e.g., 50-200) require a much larger volume spike to trigger a signal.
RVOL Threshold: This is the multiplier.
Lower values (e.g., 1.5) will generate more signals.
Higher values (e.g., 3.0) will generate fewer, but generally higher-conviction, signals.
3. Set Up Alerts
Use the pre-configured alert conditions (Bullish RVOL Signal and Bearish RVOL Signal) in TradingView's alert menu. Crucially, set the alert frequency to "Once per bar" or "Once per minute" to receive notifications as soon as the high RVOL event occurs, without waiting for the bar to close.
Sma

VCAI MACD LiteVCAI MACD Lite is a clean, modern version of the classic MACD oscillator, rebuilt with selectable EMA/SMA types and a 2-tone histogram using VCAI’s visual style.
It keeps the indicator lightweight and easy to read while giving clearer momentum shifts through rising/falling histogram colour changes.
What it does
Calculates MACD using your choice of EMA or SMA
Plots signal line and histogram with 2-tone VCAI colours
Highlights changes in momentum strength as histogram bars rise or fade
Works on any market and timeframe
How to use it
Expanding yellow bars reflect strengthening upside momentum; dim yellow shows fading strength.
Darker and lighter VCAI purple tones show momentum behaviour below zero, helping you see when bearish pressure is increasing or weakening.
Part of the VCAI Lite Series — clean, minimal tools.

Moon Boys LineWe have the 44 and 125 day moving averages. When they cross, the trend is bullish or bearish.

Magic Moving AveragesThis indicator plots up to three adaptive “Magic MAs” plus a weighted combo line, with optional traditional SMAs for comparison.
Instead of averaging only closes, each Magic MA:
looks at the midpoints of highs/lows and opens/closes
decides whether recent behaviour favours the highs or the lows
builds a series of either highs or lows, then smooths it over your chosen length
You can run:
Short / Medium / Long Magic MAs
A weighted combo line (using 1–10 weights)
Optional traditional short/long SMAs on close
How I use it:
Price above the combo line → bullish bias
Price below the combo line → bearish bias
Short/medium/long Magic MAs together → dynamic support/resistance and trend structure
Traditional SMAs on for comparison with “classic” moving average behaviour
Inputs:
Magic MA lengths control how reactive vs smooth each regime is
Weights (1–10) let you emphasise short, medium or long regimes in the combo
This is a free / educational version of the Magic MAs.
It’s not financial advice – always manage your own risk.

VectorCoresAI SMA + Bollinger Fusion v1VectorCoresAI — SMA + Bollinger Fusion (Free)
A clean, modern visual tool combining four key SMAs with an adaptive Bollinger structure.
This script merges two of the most widely used charting concepts into one simple, readable view:
Included
✔ SMA 21
✔ SMA 50
✔ SMA 100
✔ SMA 200
✔ Bollinger Bands with adjustable length + multiplier
✔ Adaptive “Fusion Squeeze” shading to highlight compression phases
✔ Optional visibility toggles for each SMA
✔ Lightweight, non-intrusive overlay
What this indicator is designed for
This tool helps traders quickly understand:
Trend alignment using the 21/50/100/200 SMAs
Volatility conditions around the Bollinger midline
Price compression and expansion
Early awareness of breakout environments
Clean visual structure without clutter
Everything is intentionally simple and transparent.
No predictions, no signals, no trading advice — just clean chart structure.
Why this version is unique
Instead of using standard Bollinger visuals, this Fusion edition uses subtle adaptive shading to show when the bands contract.
This makes compression zones instantly visible without overwhelming the chart.
The SMAs are fixed to widely-used trend levels, giving consistent readings across all markets and timeframes.
Who this is for
Newer traders who want a clear introduction to SMAs + Bollinger Bands
Experienced traders who want a lightweight visual tool
Anyone building structure-based strategies
Users of the VectorCoresAI suite who want a simple companion tool
Notes
This indicator is part of the VectorCoresAI Free Tools collection.
All logic is open-source and educational only.
More tools coming soon.

MA Strength Indicator EnhancedThe "MA Strength" is an indicator that measures market trend strength or (in the case of forex pairs) the relative strength of individual currencies based on up to five different moving averages (MA). It offers multiple calculation methods, such as simple summation, normalized value, or measuring ATR/percentage distance from the price. The results are summarized in a clear table, and it provides customizable alerts for trend changes or shifts in currency strength. The high level of configurability (e.g., MA weighting, "all MA alignment" requirement) allows for fine-tuning the strategy.
💬 Interpreting the Table (Top Rows)
The top row of the table shows the final output of the indicator. This changes according to the set "Table Mode".
Trend Mode: The top row shows the final, aggregated trend status (e.g., "BULLISH", "NEUTRAL") and the corresponding "Trend Value". This is the value the indicator compares to its thresholds.
Forex Mode: (Only on 6-character pairs): The top two rows show the strength of the Base currency and the Quote currency separately.
Calculation of the top rows:
The indicator calculates the individual score of all active MAs (according to the chosen method).
Trend Value: This is the final value calculated from the scores.
If "Enable Averaging" is ON, this will be the average of the scores (e.g., MA1 score is 5.0, MA2 score is 7.0 -> Trend Value is 6.0).
If averaging is OFF, this will be the sum of the scores (e.g., 5.0 + 7.0 = 12.0).
Forex Calculation: "Forex Mode" uses this "Trend Value". If the Trend Value is +6.0 (on an EURUSD pair):
The Base currency (EUR) value will be +6.0.
The Quote currency (USD) value will be -6.0.
The indicator compares these values to the thresholds to determine the "STRONG" status for EUR and "WEAK" status for USD.
📊 Calculation Methods
The indicator can calculate trend strength using 5 methods. The final "Trend Value" is derived from the results of these calculations.
Sum:
Description: Simply adds up the individual scores of all enabled moving averages (MA).
Formula: If the price is above an MA, it gets the "Score Above" value (e.g., +2.0); if below, it gets the "Score Below" value (e.g., -2.0).
Example: Result = (MA1 score) + (MA2 score) + ...
Normalized:
Description: Takes the sum obtained by the "Sum" method and converts it to a scale between -100% (maximally bearish) and +100% (maximally bullish). It takes into account the maximum possible positive and negative scores.
Formula: Result = (Total Score / Max Possible Score) * 100
Percentage Distance:
Description: This method also considers distance. The further the price is from the MA in percentage terms, the higher the score.
Formula: MA Score = (|Close Price - MA| / MA * 100) * Weight (The "Weight" is the "Score Above/Below" value set in settings).
ATR Distance:
Description: Similar to percentage distance, but normalizes the distance using volatility via ATR (Average True Range).
Formula: MA Score = (|Close Price - MA| / ATR) * Weight
Candle Count:
Description: Counts how many consecutive candles have been above or below the MA. It multiplies this number by the set weight.
Formula: MA Score = (Number of consecutive candles) * Weight
⚙️ Settings Options
Moving Averages (MA 1-5)
For each moving average, you can set:
Enable MA: Turn the specific MA on or off.
Type: The type of moving average (SMA, EMA, WMA, etc.).
Period: The period of the MA (e.g., 50, 200).
Score Above / Below: The most important setting. This defines the "weight" of the MA in the calculation. In "Sum" mode, this is a fixed score; in distance-based modes, this is a multiplier (weight). It is advisable to write a positive number for "Score Above" and a negative number for "Score Below".
Calculation Settings
Enable Averaging: If this is on, the indicator shows the average of the active MA scores, not the total score.
Exception: This function is not available in "Normalized" mode.
Require All MA Alignment: This is a strict filter. If enabled, the indicator only gives a "BULLISH" (or "STRONG") signal if the price is above all enabled moving averages. Similarly, a "BEARISH" signal only occurs if the price is below all moving averages. If the price is on the opposite side of even just one MA (e.g., above 4, below 1), the status becomes "NEUTRAL", regardless of the scores.
Strength / Trend Thresholds
Enable Extra Levels: If active, statuses are expanded: "EXT. BULLISH" / "EXT. BEARISH" (Trend mode) or "EXT. STRONG" / "EXT. WEAK" (Forex mode). This indicates stronger, overbought/oversold conditions.
Threshold setting: The thresholds (e.g., "Strong Above - ATR") determine when the calculated value counts as a "STRONG" or "WEAK" status.
🔢 Setting Thresholds via Calculation
If "Enable Averaging" is OFF, the "Trend Value" shown in the table will be the sum of the individual MA scores. Therefore, we must define the threshold by adding up the minimum expected performance from each moving average. This allows us to set different expectations for short, medium, and long-term averages.
Step 1: Determine MA weights
In our example, we use 3 active MAs with the following weights (Score Above values):
MA1 (Short): Weight = +2
MA2 (Medium): Weight = +3
MA3 (Long): Weight = +4
Step 2: Determine the minimum expected distance
Define a minimum distance expected from each MA to trigger a "Strong" signal.
Step 3: Calculate target scores and the final threshold
Note: If "Enable Averaging" is ON, the resulting value (sum of target scores) must be
averaged to get the final threshold.
Example 1: ATR Distance
-Goal: I want a "Strong" signal if the price is...
...at least 1.0 ATR above MA1 (Short),
...at least 1.5 ATR above MA2 (Medium),
...and at least 2.0 ATR above MA3 (Long).
-Calculation (Expected Distance * Weight):
MA1 Target Score: 1.0 * 2 = 2.0
MA2 Target Score: 1.5 * 3 = 4.5
MA3 Target Score: 2.0 * 4 = 8.0
-Final Threshold (Sum of Target Scores): 2.0 + 4.5 + 8.0 = 14.5
-Setting: Set "Strong Above - ATR" threshold to 14.5.
If "Enable Averaging" is ON, the obtained value must be averaged, and the result will be the
threshold: 4.8 (14.5 / 3 = 4.83).
Example 2: Percentage Distance
-Goal: I want a "Strong" signal if the price is...
...at least 0.5% above MA1,
...at least 1.0% above MA2,
...and at least 1.5% above MA3.
-Calculation (Expected Distance * Weight):
MA1 Target Score: 0.5 * 2.0 = 1.0
MA2 Target Score: 1.0 * 3.0 = 3.0
MA3 Target Score: 1.5 * 4.0 = 6.0
-Final Threshold (Sum): 1.0 + 3.0 + 6.0 = 10.0
-Setting: Set "Strong Above - Percentage" threshold to 10.0.
If "Enable Averaging" is ON, the obtained value must be averaged, and the result will be the
threshold.
Example 3: Candle Count
-Goal: I want a "Strong" signal if...
...at least 3 consecutive candles are above MA1,
...at least 5 consecutive candles are above MA2,
...and at least 10 consecutive candles are above MA3.
-Calculation (Expected Candle Count * Weight):
MA1 Target Score: 3 * 2.0 = 6.0
MA2 Target Score: 5 * 3.0 = 15.0
MA3 Target Score: 10 * 4.0 = 40.0
-Final Threshold (Sum): 6.0 + 15.0 + 40.0 = 61.0
-Setting: Set "Strong Above - Candle" threshold to 61.0.
If "Enable Averaging" is ON, the obtained value must be averaged, and the result will be the
threshold.
Example 4: Sum
In this mode, distance does not matter, only whether the price is above or below the MA.
-Goal: "Strong" signal if the price is above the long-term averages, but can be below the short-term (MA1).
MA1 (Short): Can be below (Weight: -2.0)
MA2 (Medium): Must be above (Weight: +3.0)
MA3 (Long): Must be above (Weight: +4.0)
-Calculation: -2.0 + 3.0 + 4.0 = 5.0
-Setting: Set "Strong Above - Sum" threshold to 5.0.
If it must be above all three moving averages, the threshold would be 2.0 + 3.0 + 4.0 = 9.0.
If "Enable Averaging" is ON, the obtained value must be averaged, and the result will be the
threshold.
Example 5: Normalized
The basic logic is similar to the "Sum" method.
-Goal: "Strong" signal if price is above MA2 and MA3, but potentially below MA1.
-Calculation: Target Sum: 5.0. Max Possible Score (above all): 9.0.
-Threshold: (5.0 / 9.0) * 100 = 55.5
In this calculation method, averaging cannot be set.
The Usage of the "ATR %" Row
The "ATR %" row shows the percentage movement of an average candle.
How to use this with "Percentage Distance" mode:
This number gives a baseline. It helps decide if the "Percentage Distance" threshold is realistic.
Example: You see the "ATR %" value is hovering around 1.2%. This means a "normal" candle moves about 1.2%.
If you set the Percentage threshold to 0.5%, it is too low. The indicator will constantly give a "Strong" signal because even average movement (noise) exceeds the threshold.
Correct Usage: If "normal" movement is 1.2%, then a "strong" movement (trend) needs to be significantly larger. For example, set the threshold to double the ATR %: 2.4 (2 * 1.2). Thus, you only get a "Strong" signal if the movement is twice the average volatility.
Supplementary Information
Rounding Differences:
The numbers displayed in the table and the precision of calculations in the background differ.
Table Display: The indicator rounds numbers to two decimal places in the table. So, if the value is 0.996, the table shows 1.00 (rounded up).
Internal Calculation: The background calculation uses much higher precision. When determining status (STRONG vs NEUTRAL), the program compares the precise, unrounded value to the threshold.
Result: Due to rounding, it may happen that if the threshold is 1.00 and the table shows 1.00, the status flickers between Strong and Neutral. If this is bothersome, it is advisable to set a slightly lower threshold (e.g., 0.98).
🔔 Alert Settings
The indicator can send alerts when the status changes.
Alert Method:
Trend: Alerts when the main trend status changes (e.g., from "NEUTRAL" to "BULLISH"). You can specify which direction to alert for (e.g., only "BULLISH").
Forex: Works only on 6-character forex pairs. You can set separate alerts for the Base or Quote currency.
Forex Strength Level: You can specify at which status level to alert (e.g., "WEAK" or "EXT. STRONG").
📈 Trading Tips
Trend Confirmation: Use the "BULLISH" / "BEARISH" status to confirm your existing strategy (e.g., breakouts, bounces off support).
Forex Pairing: In Forex mode, look for pairs where the Base currency is "STRONG" and the Quote currency is "WEAK" (or "EXT. STRONG" / "EXT. WEAK") for a long position.
Short Position: Reverse the above (Base: WEAK, Quote: STRONG).

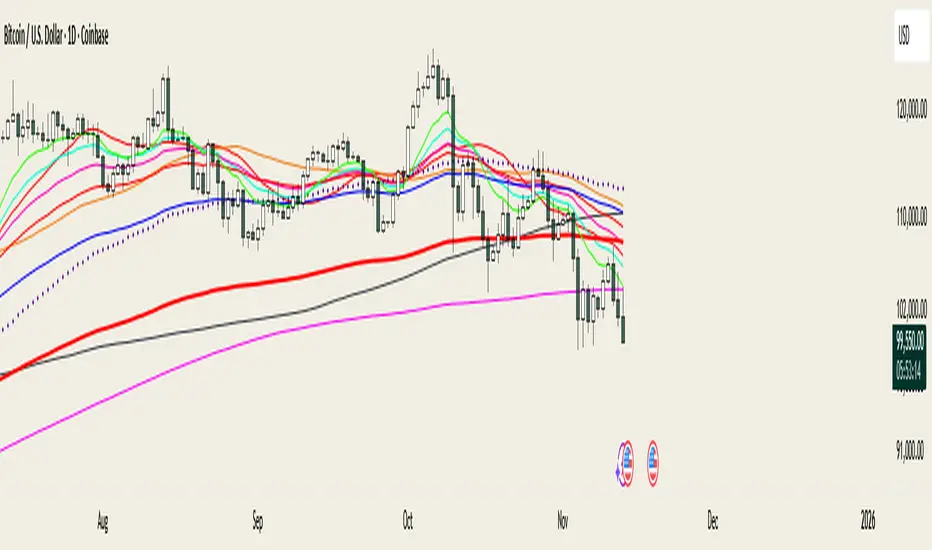
V-CORE SMA Matrix LiteV-CORE SMA Matrix Lite
A clean, lightweight 5-SMA structure tool built using Pine Script v6.
This open-source Lite edition provides a simple visual framework for identifying market structure using the most commonly used moving averages:
21 SMA
50 SMA
80 SMA
100 SMA
200 SMA
Each line is individually adjustable and colour-coded for easy trend reading.
No signals, no alerts, no automation — purely a visual tool for traders who prefer clarity over complexity.
This Lite version exposes only basic, non-proprietary logic.
Advanced regime systems, multi-stage confirmation models, and automation features are available only in the full V-CORE Engine suite.
Part of the V-CORE Lite Series
Free open-source tools designed for education, research, and clean charting.
Follow our work:
TradingView: VectorCoresAI
X (Twitter): vectorcoresai
Telegram: vectorcoresai

Simple Price ChannelSimple Price Channel
This indicator plots a basic volatility-based channel around a moving average.
Features:
Midline using Simple Moving Average (SMA)
Upper & lower bands using ATR or true range
Channel fill for easy trend visualisation
This script is designed for educational and analytical purposes only.
It does not provide signals, alerts, or financial advice.

DeepClean Linear indicator 1. Indicator Name
DeepClean Linear indicator
2. One-Line Introduction
A trend-recognition indicator that overlays a “transparent wave” on price, removing noise and revealing directional bias and trend intensity in a highly intuitive visual form.
3. Overall Summary
The DeepClean Linear indicator calculates trend direction using changes in linear regression slope and determines trend strength by comparing how consistently the regression line moves over a defined lookback window.
Rather than merely identifying trend direction, the indicator applies a triple-layer noise-filtering process (EMA → SMA → RMA) to produce a clean, wave-shaped data line that filters out unnecessary market noise.
This transparent wave sits directly on top of price, allowing traders to visually compare price movement and trend strength at the same time.
A stronger trend results in a taller, thicker wave, while weakening momentum causes the wave to thin, making it easier to spot trend continuation, exhaustion, or upcoming reversal.
Color automatically shifts based on trend:
Bright cyan/teal during bullish conditions
Reddish tones during bearish conditions
Transparency dynamically adjusts depending on strength
The indicator excels at identifying the true underlying trend by ignoring minor fluctuations and is well suited for scalping, swing trading, and position trading.
It also significantly reduces false signals in ranging markets, making it ideal for trend-following strategies.
4. Advantages
① Ultra-Clean Noise-Reduced Wave
Utilizes a 3-stage smoothing filter (EMA → SMA → RMA) to produce a much cleaner wave than standard moving averages, highlighting only core trend movement.
② Trend Direction & Strength at a Glance
Based on comparative linear regression behavior, the indicator quantifies both direction and strength, making convergence/divergence highly visible.
③ Intuitive Price Overlay Visualization
The semi-transparent wave sits directly on price action, allowing traders to instantly see divergence from price, trend weakening, or early turning points.
④ Dynamic Transparency Coloring
Strong trends appear bold and intense, while weaker trends fade visually—making signal interpretation effortless.
⑤ Excellent Range Filtering
During low-direction phases (state = 0), the wave turns neutral, preventing forced or premature entries.
⑥ Multi-Timeframe Compatibility
The wave remains stable from 1-minute to weekly charts, making it suitable for trend analysis, execution, and risk control across all timeframes.
📌 Core Concept Overview
The indicator evaluates the relative comparison of linear regression values over the last n periods.
A positive trend value indicates bullish bias
A negative trend value indicates bearish bias
Intensity represents strength and controls wave height
waveTop / waveBot define the visual wave area relative to price
State Values
1 = Bullish Trend
-1 = Bearish Trend
0 = Neutral / Weak Direction
⚙️ Settings Overview
Option Description
Trend Lookback (n) Comparison window for regression slope. Higher = bigger trend focus.
Range Tolerance (%) Strength threshold to classify bullish/bearish movement. Higher = more conservative.
Source Price source for regression calculations.
Linear Reg Length Length of the linear regression.
Noise Filter Strength (smoothK) Controls the smoothing intensity. Higher = smoother wave.
Wave Amplitude (amp) Adjusts the height/thickness of the wave.
Bull/Bear Color Colors for bullish/bearish waves.
Base Transparency Base opacity level; modified dynamically by trend strength.
📈 Bullish Timing Recognition Examples
Wave begins turning brighter teal and more opaque, indicating strengthening upward pressure.
waveTop expands above price, signaling early trend expansion.
State flips to 1, often marking a trend restart or early reversal phase.
A steadily rising wave height suggests sustained bullish momentum.
📉 Bearish Timing Recognition Examples
Wave shifts into red tones, showing bearish dominance.
waveBot expands below price, indicating rising downside volatility.
State stays at -1 while intensity increases, signaling entry into strong downtrend conditions.
A shift from weak → strong bearish intensity can provide short-entry timing cues.
🧪 Recommended Usage
Use as a core component in trend-following systems
Adjust position size based on wave thickness (trend strength)
Combine with RSI/MACD to reduce false signals during overbought/oversold zones
Sudden wave expansion during volatility increases helps detect trend acceleration
In sideways markets, frequent state = 0 readings help avoid low-probability trades
🔒 Important Notes
As a trend-based indicator, it may misread choppy/ranging markets
Because of smoothing, signals may appear slightly delayed
Extreme news volatility can temporarily distort trend clarity

Filter Trend1. Indicator Name
Premium EMA Ribbon Filter (Pro Version)
(Advanced Trend & Momentum Filtering System Based on EMA Ribbons)
2. One-Line Introduction
A professional trend-analysis indicator that blends an advanced noise-filtering algorithm with an EMA ribbon system to extract only the pure bullish/bearish trend while smoothing out market noise.
3. Overall Description (7+ lines)
The Premium EMA Ribbon Filter is more than just a set of EMAs.
It analyzes the structure of a fast, medium, and slow EMA ribbon—along with the spacing and alignment between them—to determine whether the market is in a bullish trend, bearish trend, or a neutral/noise-heavy zone.
The core of this indicator is its noise-reduction algorithm and trend-strength calculation system.
Instead of relying on simple EMA cross signals, it evaluates how consistently the ribbon maintains bullish/bearish alignment over a specified period and highlights only strong trends with color coding, while weak or noisy areas are displayed in gray.
This helps traders avoid confusing or false signals and clearly focus only on the “meaningful zones.”
A Triple-Smoothing System is applied to create smoother, more refined ribbon movements, forming a stable “premium trend curve” that is less affected by short-term volatility.
As a result, this indicator works effectively for scalping, swing trading, and long-term trend following—staying true to the principle of removing noise and highlighting only the core market flow.
4. Short Advantages (6 items)
① Complete Noise Filtering
Using EMA ribbon comparison + tolerance logic, false reversals are largely eliminated, leaving only stable trend phases.
② Highly Readable Color System
Bullish trends are mint, bearish trends are red, and neutral/noise zones are gray—instantly visualizing market conditions.
③ Trend Strength Visualization
Not only trend direction but also trend strength is displayed via dynamic color transparency.
④ Smooth, Premium-Style Ribbon Design
Triple-smoothing creates a refined, luxury-level smoothness in movement.
⑤ Works Across All Timeframes
From 1-minute scalping to daily/weekly macro trend analysis.
⑥ Excellent Real-Trading Compatibility
Works extremely well when combined with ATR, SuperTrend, and volume-based indicators.
Indicator Manual (Required Section)
📌 Understanding the Core Concept
The indicator uses three EMAs (e.g., 20/50/100) arranged as a ribbon to analyze the structural alignment of the trend.
When the EMAs are cleanly aligned Top → Middle → Bottom, the market is in a bullish trend.
When aligned Bottom → Middle → Top, the market is in a bearish trend.
The indicator further evaluates the ribbon spread (gap) and the consistency of alignment to compute trend strength.
Noisy market conditions are shaded gray to clearly indicate “uncertain/indecisive” zones.
⚙️ Settings Description
Option Description
Fast EMA Most sensitive EMA; detects early trend signals
Mid EMA Stabilizes the primary trend direction
Slow EMA Defines the broader, long-term trend flow
Trend Lookback The period used to analyze trend strength
Noise Tolerance (%) Higher values = stronger noise removal
Smoothing Steps Controls how smooth the ribbon becomes
📈 Example Recognition
A bullish continuation/entry scenario forms when:
EMAs align in the order Fast → Mid → Slow (top side)
Ribbon color shifts into mint (strong bullish trend)
The ribbon begins to expand while price stays above the ribbon
📉 Example Recognition
A bearish continuation/entry occurs when:
EMAs align Fast → Mid → Slow (bottom side)
Ribbon color remains red
After contracting, the ribbon expands again during renewed downside strength
🧪 Recommended Usage
Combine with volume-based indicators (OBV, Volume Profile) → enhanced strong-trend detection
Use with SuperTrend or ATR Stop → clearer stop-loss placement
Combine with RSI/Stoch → avoid counter-trend entries in overheated conditions
Higher leverage traders should use higher tolerance settings
🔒 Cautions
EMA ribbons are trend-following tools; signals may weaken in ranging/sideways markets.
Never rely solely on this indicator—always confirm with volume, price patterns, or structure.
Very low Lookback values may cause excessive re-entry signals.
In high-volatility environments, ribbon spacing can contract/expand rapidly—use with caution.

[CASH] Crypto And Stocks Helper (MultiPack w. Alerts)ATTENTION! I'm not a good scripter. I have just learned a little basics for this project, stolen code from other public scripts and modified it, and gotten help from AI LLM's.
If you want recognition from stolen code please tell me to give you the credit you deserve.
The script is not completely finished yet and contains alot of errors but my friends and family wants access so I made it public.
_________________________________________________________________________________
CASH has multiple indicators (a true all-in-one multipack), guides and alerts to help you make better trades/investments. It has:
- Bitcoin Bull Market Support Band
- Dollar Volume
- 5 SMA and 5 EMA
- HODL Trend (a.k.a SuperTrend) indicator
- RSI, Volume and Divergence indicators w. alerts
More to come as well, like Backburner and a POC line from Volume Profile.
Everything is fully customizable, appearance and off/on etc.
More information and explainations along with my guides you can find in settings under "Input" and "Style".

Moving Aaverage (EMA) & VWAP by Vish
Multi-Timeframe Moving Averages with VWAP
This indicator combines essential moving averages with VWAP to provide comprehensive trend analysis on a single chart. Designed for traders who need quick visual reference of multiple timeframes and volume-weighted price levels.
Features:
• Six customizable moving averages: 8, 13, 21, 50, 100, and 200 periods
• Toggle between Simple Moving Average (SMA) and Exponential Moving Average (EMA) for all lines
• Individual on/off controls for each moving average
• Volume Weighted Average Price (VWAP) with customizable settings
• VWAP anchor options: Session, Week, Month, Quarter, and Year
• Clean, color-coded visualization for easy identification
• Fully customizable through settings panel
Use Cases:
• Identify trend direction across multiple timeframes
• Find dynamic support and resistance levels
• Spot potential entry and exit points
• Analyze price action relative to volume-weighted average
• Confirm trend strength with multiple MA convergence/divergence
Settings:
All parameters are adjustable including MA type (SMA/EMA), individual MA visibility, VWAP source, and VWAP anchor period.
Suitable for all markets and timeframes. Works on stocks, forex, crypto, commodities, and indices.
#moving average #MA #EMA #SMA #VWAP #trend #support #resistance #multi-timeframe

@MO_XBT - EMA/MA ToolkitClean set of EMAs & MAs I use for trend tracking, momentum shifts, and cross signals
If you found this useful, follow me on X: @mo_xbt
Exponential Moving Average + ATR MTF [YSFX]Description:
This indicator is a reupload of a previously published EMA + ATR tool, updated and enhanced after a house rule violation to provide additional features and a cleaner, more versatile experience for traders.
It combines trend analysis and volatility measurement into one intuitive tool, allowing traders to visualize market direction, dynamic support and resistance, and adaptive risk levels—all in a clean, minimal interface.
The indicator calculates a customizable moving average (MA) type—EMA, SMA, WMA, HMA, RMA, DEMA, TEMA, VWMA, LSMA, or KAMA—and surrounds it with ATR-based bands that expand and contract with market volatility. This creates a dynamic envelope around price, helping traders identify potential breakouts, pullbacks, or high-probability entry/exit zones.
Advanced Features:
Multiple MA types: Supports all major moving averages, including advanced options like KAMA, DEMA, and TEMA.
KAMA customization: Adjustable fast and slow lengths for precise tuning.
Dual timeframe support: Optionally use separate timeframes for the MA and ATR, or a global timeframe for both.
Dynamic ATR bands: Automatically adjust to market volatility, useful for setting adaptive stop-loss levels.
Optional fill: Shade the area between upper and lower ATR bands for a clear visual representation of volatility.
Flexible for all markets: Works across any timeframe or asset class.
Who It’s For:
This indicator is ideal for trend-following traders, swing traders, and volatility-focused analysts who want to:
Confirm trend direction while accounting for volatility
Identify high-probability trade entries and exits
Implement dynamic, ATR-based stop-loss strategies
Keep charts clean and uncluttered while still capturing key market information
This reuploaded version ensures compliance with platform rules while offering enhanced flexibility and clarity for modern trading workflows.

Quantum Fluxtrend [CHE] Quantum Fluxtrend — A dynamic Supertrend variant with integrated breakout event tracking and VWAP-guided risk management for clearer trend decisions.
Summary
The Quantum Fluxtrend builds on traditional Supertrend logic by incorporating a midline derived from smoothed high and low values, creating adaptive bands that respond to market range expansion or contraction. This results in fewer erratic signals during volatile periods and smoother tracking in steady trends, while an overlaid event system highlights breakout confirmations, potential traps, or continuations with visual lines, labels, and percentage deltas from the close. Users benefit from real-time VWAP calculations anchored to events, providing dynamic stop-loss suggestions to help manage exits without manual adjustments. Overall, it layers signal robustness with actionable annotations, reducing noise in fast-moving charts.
Motivation: Why this design?
Standard Supertrend indicators often generate excessive flips in choppy conditions or lag behind in low-volatility drifts, leading to whipsaws that erode confidence in trend direction. This design addresses that by centering bands around a midline that reflects recent price spreads, ensuring adjustments are proportional to observed variability. The added event layer captures regime shifts explicitly, turning abstract crossovers into labeled milestones with trailing VWAP for context, which helps traders distinguish genuine momentum from fleeting noise without over-relying on raw price action.
What’s different vs. standard approaches?
- Baseline reference: Diverges from the classic Supertrend, which uses average true range for fixed offsets from a median price.
- Architecture differences:
- Bands form around a central line averaged from smoothed highs and lows, with offsets scaled by half the range between those smooths.
- Regime direction persists until a clear breach of the prior opposite band, preventing premature reversals.
- Event visualization draws persistent lines from flip points, updating labels based on price sustainment relative to the trigger level.
- VWAP resets at each event, accumulating volume-weighted prices forward for a trailing reference.
- Practical effect: Charts show fewer direction changes overall, with color-coded annotations that evolve from initial breakout to continuation or trap status, making it easier to spot sustained moves early. VWAP lines provide a volume-informed anchor that curves with price, offering visual cues for adverse drifts.
How it works (technical)
The process starts by smoothing high and low prices over a user-defined period to form upper and lower references. A midline sits midway between them, and half the spread acts as a base for band offsets, adjusted by a multiplier to widen or narrow sensitivity. On each bar, the close is checked against the previous bar's opposite band: crossing above expands the lower band downward in uptrends, or below contracts the upper band upward in downtrends, creating a ratcheting effect that locks in direction until breached.
Persistent state tracks the current regime, seeding initial bands from the smoothed values if no prior data exists. Flips trigger new horizontal lines at the breach level, styled by direction, alongside labels that monitor sustainment—price holding above for up-flips or below for down-flips keeps the regime, while reversal flags a trap.
Separately, at each flip, a dashed VWAP line initializes at the breach price and extends forward, accumulating the product of typical prices and volumes divided by total volume. This yields a curving reference that updates bar-by-bar. Warnings activate if price strays adversely from this VWAP, tinting the background for quick alerts.
No higher timeframe data is pulled, so all computations run on the chart's native resolution, avoiding lookahead biases unless repainting is enabled via input.
Parameter Guide
SMA Length — Controls smoothing of highs and lows for midline and range base; longer values dampen noise but increase lag. Default: 20. Trade-offs: Shortens responsiveness in trends (e.g., 10–14) but risks more flips; extend to 30+ for stability in ranging markets.
Multiplier — Scales band offsets from the half-range; higher amplifies to capture bigger swings. Default: 1.0. Trade-offs: Above 1.5 widens for volatile assets, reducing false signals; below 0.8 tightens for precision but may miss subtle shifts.
Show Bands — Toggles visibility of basic and adjusted band lines for reference. Default: false. Tip: Enable briefly to verify alignment with price action.
Show Background Color — Displays red tint on VWAP adverse crosses for visual warnings. Default: false. Trade-offs: Helps in live monitoring but can clutter clean charts.
Line Width — Sets thickness for event and VWAP lines. Default: 2. Tip: Thicker (3–5) for emphasis on key levels.
+Bars after next event — Extends old lines briefly before cleanup on new flips. Default: 20. Trade-offs: Longer preserves history (40+) at resource cost; shorter keeps charts tidy.
Allow Repainting — Permits live-bar updates for smoother real-time view. Default: false. Tip: Disable for backtest accuracy.
Extension 1 Settings (Show, Width, Size, Decimals, Colors, Alpha) — Manages dotted connector from event label to current close, showing percentage change. Defaults: Shown, width 2, normal size, 2 decimals, lime/red for gains/losses, gray line, 90% transparent background. Trade-offs: Fewer decimals for clean display; adjust alpha for readability.
Extension 2 Settings (Show, Method, Stop %, Ticks, Decimals, Size, Color, Inherit, Alpha) — Positions stop label at VWAP end, offset by percent or ticks. Defaults: Shown, percent method, 1.0%, 20 ticks, 4 decimals, normal size, white text, inherit tint, 0% alpha. Trade-offs: Percent for proportional risk; ticks for fixed distance in tick-based assets.
Alert Toggles — Enables notifications for breakouts, continuations, traps, or VWAP warnings. All default: true. Tip: Layer with chart alerts for multi-condition setups.
Reading & Interpretation
The main Supertrend line colors green for up-regimes (price above lower band) and red for down (below upper band), serving as a dynamic support/resistance trail. Flip shapes (up/down triangles) mark regime changes at band breaches.
Event lines extend horizontally from flips: green for bull, red for bear. Labels start blank and update to "Bull/Bear Cont." if price sustains the direction, or "Trap" if it reverses, with colors shifting lime/red/gray accordingly. A dotted vertical links the trailing label to the current close, mid-labeled with the percentage delta (positive green, negative red).
VWAP dashes yellow (bull) or orange (bear) from the event, curving to reflect volume-weighted average. At its end, a left-aligned label shows suggested stop price, annotated with offset details. Background red hints at weakening if price crosses VWAP opposite the regime.
Deltas near zero suggest consolidation; widening extremes signal momentum buildup or exhaustion.
Practical Workflows & Combinations
- Trend following: Enter long on green flip shapes confirmed by higher highs, using the event line as initial stop below. Trail stops to VWAP for bull runs, exiting on trap labels or red background warnings. Filter with volume spikes to avoid low-conviction breaks.
- Exits/Stops: Conservative: Set hard stops at suggested SL labels. Aggressive: Hold through minor traps if delta stays positive, but cut on regime flip. Pair with momentum oscillators for overbought pullbacks.
- Multi-asset/Multi-TF: Defaults suit forex/stocks on 15m–4H; for crypto, bump multiplier to 1.5 for volatility. Scale SMA length proportionally across timeframes (e.g., double for daily). Combine with structure tools like Fibonacci for confluence on event lines.
Behavior, Constraints & Performance
Live bars update lines and labels dynamically if repainting is allowed, but signals confirm on close for stability—flips only trigger post-bar. No higher timeframe calls, so no inherent lookahead, though volume weighting assumes continuous data.
Resources cap at 1000 bars back, 50 lines/labels max; events prune old ones on new flips to stay under budget, with brief extensions for visibility. Arrays or loops absent, keeping it lightweight.
Known limits include lag in extreme gaps (e.g., overnight opens) where bands may not adjust instantly, and VWAP sensitivity to sparse volume in illiquid sessions.
Sensible Defaults & Quick Tuning
Start with SMA 20, multiplier 1.0 for balanced response across majors. For choppy pairs: Lengthen SMA to 30, multiplier 0.8 to tighten bands and cut flips. For trending equities: Shorten to 14, multiplier 1.2 for quicker entries. If traps dominate, enable bands to inspect range compression; for sluggish signals, reduce extension bars to focus on recent events.
What this indicator is—and isn’t
This serves as a visualization and signal layer for trend regimes and breakouts, highlighting sustainment via annotations and risk cues through VWAP—ideal atop price action for confirmation. It is not a standalone system, predictive oracle, or risk calculator; always integrate with broader analysis, position sizing, and stops. Use responsibly as an educational tool.
Disclaimer
The content provided, including all code and materials, is strictly for educational and informational purposes only. It is not intended as, and should not be interpreted as, financial advice, a recommendation to buy or sell any financial instrument, or an offer of any financial product or service. All strategies, tools, and examples discussed are provided for illustrative purposes to demonstrate coding techniques and the functionality of Pine Script within a trading context.
Any results from strategies or tools provided are hypothetical, and past performance is not indicative of future results. Trading and investing involve high risk, including the potential loss of principal, and may not be suitable for all individuals. Before making any trading decisions, please consult with a qualified financial professional to understand the risks involved.
By using this script, you acknowledge and agree that any trading decisions are made solely at your discretion and risk.
Do not use this indicator on Heikin-Ashi, Renko, Kagi, Point-and-Figure, or Range charts, as these chart types can produce unrealistic results for signal markers and alerts.
Best regards and happy trading
Chervolino

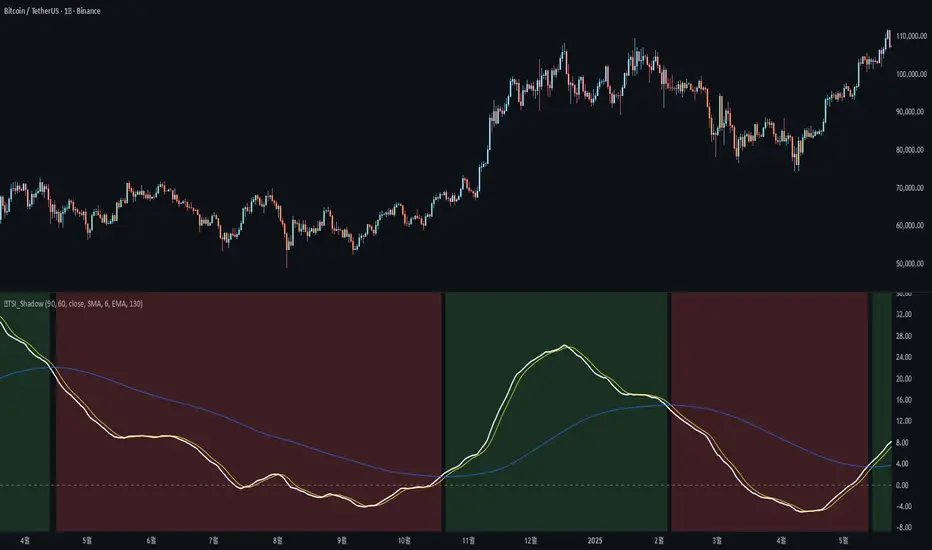
🐬TSI_ShadowAdded the following features to the original TSI Shadow indicator by Daveatt
- Candle color on/off
=> Displays the current trend status by coloring the chart candles.
- Background color on/off
=> Displays the current trend status by coloring the chart background.
- Conservative signal processing based on the zero line on/off
=> When calculating the trend with the TSI, a bullish trend is only confirmed above the zero line, and a bearish trend is only confirmed below the zero line.
- Conservative signal processing based on full signal alignment on/off
=> This enhances the original trend calculation (bullish when TSI and Fast MA are above Slow MA). With this option, the trend is determined by the specific alignment of all three lines: TSI, Fast MA, and Slow MA.
기존 Daveatt 유저가 개발한 TSI Shadow 에서 아래 기능을 추가 하였습니다.
- 캔들 색상 on/off
=> 캔들에 추세의 상태를 색상으로 나타냅니다.
- 배경 색상 on/off
=> 배경에 추세의 상태를 색상으로 나타냅니다.
- 0선 기준으로 신호 발생 보수적 처리 on/off
=> TSI로 추세를 계산할 때 0선 위에서는 매수추세, 0선 아래서는 매도추세를 계산합니다.
- 전체 배열 신호 발생 보수적 처리 on/off
=> TSI선과, FastMA 선이 SlowMA 위에 있을때 상승추세, 반대면 하락추세를 나타내 주던 계산식에서 TSI-FastMA-SlowMA 세가지 선의 배열 상태로 추세를 나타냅니다.
Best MA Finder: Sharpe/Sortino ScannerThis script, Best MA Finder: Sharpe/Sortino Scanner, is a tool designed to identify the moving average (SMA or EMA) that best acts as a dynamic trend threshold on a chart, based on risk-adjusted historical performance. It scans a wide range of MA lengths (SMA or EMA) and selects the one whose simple price vs MA crossover delivered the strongest results using either the Sharpe ratio or the Sortino ratio. Reading it is intuitive: when price spent time above the selected MA, conditions were on average more favorable in the backtest; below, less favorable. It is a trend and risk gauge, not an overbought or oversold signal.
What it does:
- Runs individual long-only crossover backtests for many MA lengths across short to very long horizons.
- For each length, measures the total number of trades, the annualized Sharpe ratio, and the annualized Sortino ratio.
- Uses the chosen metric value (Sharpe or Sortino) as the score to rank candidates.
- Applies a minimum trade filter to discard statistically weak results.
- Optionally applies a local stability filter to prefer a length that also outperforms its close neighbors by at least a small margin.
- Selects the optimal MA and displays it on the chart with a concise summary table.
How to use it:
- Choose MA type: SMA or EMA.
- Choose the metric: Sharpe or Sortino.
- Set the minimum trade count to filter out weak samples.
- Select the risk-free mode:
Auto: uses a short-term risk-free rate for USD-priced symbols when available.
Manual: you provide a risk-free ticker.
None: no risk-free rate.
- Optionally enable stability controls: neighbor radius and epsilon.
- Toggle the on-chart summary table as needed.
On-chart output:
- The selected optimal MA is plotted.
- The optional table shows MA length, number of trades, chosen metric value annualized, and the annual risk-free rate used.
Key features:
- Risk-adjusted optimization via Sharpe or Sortino for fair, comparable assessment.
- Broad MA scan with SMA and EMA support.
- Optional stability filter to avoid one-off spikes.
- Clear and auditable presentation directly on the chart.
Use cases:
- Traders who want a defensible, data-driven trend threshold without manual trial and error.
- Swing and trend-following workflows across timeframes and asset classes.
- Quick SMA vs EMA comparisons using risk-adjusted results.
Limitations:
- Not a full trading strategy with position sizing, costs, funding, slippage, or stops.
- Long-only, one position at a time.
- Discrete set of MA lengths, not a continuous optimizer.
- Requires sufficient price history and, if used, a reliable risk-free series.
This script is open-source and built from original logic. It does not replicate closed-source scripts or reuse significant external components.

Trend Pro V2 [CRYPTIK1]Introduction: What is Trend Pro V2?
Welcome to Trend Pro V2! This analysis tool give you at-a-glance understanding of the market's direction. In a noisy market, the single most important factor is the dominant trend. Trend Pro V2 filters out this noise by focusing on one core principle: trading with the primary momentum.
Instead of cluttering your chart with confusing signals, this indicator provides a clean, visual representation of the trend, helping you make more confident and informed trading decisions.
The dashboard provides a simple, color-coded view of the trend across multiple timeframes.
The Core Concept: The Power of Confluence
The strength of any trading decision comes from confluence—when multiple factors align. Trend Pro V2 is built on this idea. It uses a long-term moving average (200-period EMA by default) to define the primary trend on your current chart and then pulls in data from three higher timeframes to confirm whether the broader market agrees.
When your current timeframe and the higher timeframes are all aligned, you have a state of "confluence," which represents a higher-probability environment for trend-following trades.
Key Features
1. The Dynamic Trend MA:
The main moving average on your chart acts as your primary guide. Its color dynamically changes to give you an instant read on the market.
Teal MA: The price is in a confirmed uptrend (trading above the MA).
Pink MA: The price is in a confirmed downtrend (trading below the MA).
The moving average changes color to instantly show you if the trend is bullish (teal) or bearish (pink).
2. The Multi-Timeframe (MTF) Trend Dashboard:
Located discreetly in the bottom-right corner, this dashboard is your window into the broader market sentiment. It shows you the trend status on three customizable higher timeframes.
Teal Box: The trend is UP on that timeframe.
Pink Box: The trend is DOWN on that timeframe.
Gray Box: The price is neutral or at the MA on that timeframe.
How to Use Trend Pro V2: A Simple Framework
Step 1: Identify the Primary Trend
Look at the color of the MA on your chart. This is your starting point. If it's teal, you should generally be looking for long opportunities. If it's pink, you should be looking for short opportunities.
Step 2: Check for Confluence
Glance at the MTF Trend Dashboard.
Strong Confluence (High-Probability): If your main chart shows an uptrend (Teal MA) and the dashboard shows all teal boxes, the market is in a strong, unified uptrend. This is a high-probability environment to be a buyer on dips.
Weak or No Confluence (Caution Zone): If your main chart shows an uptrend, but the dashboard shows pink or gray boxes, it signals disagreement among the timeframes. This is a sign of market indecision and a lower-probability environment. It's often best to wait for alignment.
Here, the daily trend is down, but the MTF dashboard shows the weekly trend is still up—a classic sign of weak confluence and a reason for caution.
Best Practices & Settings
Timeframe Synergy: For best results, use Trend Pro on a lower timeframe and set your dashboard to higher timeframes. For example, if you trade on the 1-hour chart, set your MTF dashboard to the 4-hour, 1-day, and 1-week.
Use as a Confirmation Tool: Trend Pro V2 is designed as a foundational layer for your analysis. First, confirm the trend, then use your preferred entry method (e.g., support/resistance, chart patterns) to time your trade.
This is a tool for the community, so feel free to explore the open-source code, adapt it, and build upon it. Happy trading!
For your consideration @TradingView

Anrazzi - EMAs/ATR - 1.0.2The Anrazzi – EMAs/ATR indicator is a multi-purpose overlay designed to help traders track trend direction and market volatility in a single clean tool.
It plots up to six customizable moving averages (MAs) and an Average True Range (ATR) value directly on your chart, allowing you to quickly identify market bias, dynamic support/resistance, and volatility levels without switching indicators.
This script is ideal for traders who want a simple, configurable, and efficient way to combine trend-following signals with volatility-based position sizing.
📌 Key Features
Six Moving Averages (MA1 → MA6)
Toggle each MA on/off individually
Choose between EMA or SMA for each
Customize length and color
Perfect for spotting trend direction and pullback zones
ATR Display
Uses Wilder’s ATR formula (ta.rma(ta.tr(true), 14))
Can be calculated on current or higher timeframe
Adjustable multiplier for position sizing (e.g., 1.5× ATR stops)
Displays cleanly in the bottom-right corner
Custom Watermark
Displays symbol + timeframe in top-right
Adjustable color and size for streamers, screenshots, or clear charting
Compact UI
Organized with group and inline inputs for quick configuration
Lightweight and optimized for real-time performance
⚙️ How It Works
MAs: The script uses either ta.ema() or ta.sma() to compute each moving average based on the user-selected type and length.
ATR: The ATR is calculated using ta.rma(ta.tr(true), 14) (Wilder’s smoothing), and optionally scaled by a multiplier for easier use in risk management.
Tables: ATR value and watermark are displayed using table.new() so they stay anchored to the screen regardless of zoom level.
📈 How to Use
Enable the MAs you want to track and adjust their lengths, type, and colors.
Enable ATR if you want to see volatility — optionally select a higher timeframe for broader context.
Use MAs to:
Identify overall trend direction (e.g. price above MA20 = bullish)
Spot pullback zones for entries
See when multiple MAs cluster together as support/resistance zones
Use ATR value to:
Size your stop-loss dynamically (e.g. stop = entry − 1.5×ATR)
Detect volatility breakouts (ATR spikes = market expansion)
🎯 Recommended For
Day traders & swing traders
Trend-following & momentum strategies
Volatility-based risk management
Traders who want a clean, all-in-one dashboard

SMA MAD SuperTrend | OquantThe SMA MAD SuperTrend | Oquant is an trend-following indicator designed to help traders identify potential trend directions and reversals using a unique combination of a Simple Moving Average (SMA), Mean Absolute Deviation (MAD), and a SuperTrend mechanism. This script aims to provide clear visual signals for trend entries and exits, making it suitable for traders looking to capture trends.
This indicator innovatively combines the smoothing properties of an SMA with the volatility-adaptive qualities of MAD to create dynamic SuperTrend bands. Unlike traditional SuperTrend indicators that rely on Average True Range (ATR) for volatility, this script uses Mean Absolute Deviation(MAD) to measure the average absolute deviation from the mean price, providing a different perspective on price volatility. The result is a SuperTrend system that adapts to market conditions with a focus on price deviation, offering a unique tool for trend detection.
Components and Calculations
Simple Moving Average (SMA):
The SMA is a widely used indicator that calculates the average of a specified number of closing prices. It smooths price data to identify the overall trend direction. In this script, the SMA serves as the baseline for calculating dynamic upper and lower bands.
Mean Absolute Deviation (MAD):
MAD measures the average absolute deviation of the price from its mean. It quantifies volatility by calculating how far prices deviate from the mean price, offering an alternative to ATR.
SuperTrend Mechanism:
This SuperTrend indicator generates dynamic upper and lower bands around the Simple Moving Average (SMA) using mean absolute deviation as measure of volatility.
It tracks trend direction by comparing the close price to the bands:
If the price crosses above the upper band, the trend turns bullish, and the SuperTrend follows the lower band.
If the price crosses below the lower band, the trend turns bearish, and the SuperTrend follows the upper band.
The bands adjust based on their previous values, updating only when the price crosses a band or the band shifts in the correct direction, reducing false signals and ensuring stable trend detection.
How to Use the Indicator
Trend Signals:
Green Line: Indicates a bullish trend (price above the SuperTrend line).
Purple Line: Indicates a bearish trend (price below the SuperTrend line).
Bar and Candle Coloring: Bars and candles are colored green for bullish trends and purple for bearish trends, making it easy to visualize trend direction.
Filled Areas: The area between the price and the SuperTrend line is filled with transparent colors (green for bullish, purple for bearish) to highlight trend.
Inputs:
Source: Choose the price data for calculations.
SMA Length: Adjust the period for the SMA. Longer periods smooth the trend further.
MAD Length: Set the period for MAD calculation. Shorter periods make the MAD more sensitive.
Factor: Control the distance of the SuperTrend bands from the SMA. Higher values widen the bands, reducing sensitivity to price fluctuations.
Alerts:
The script includes alert conditions for trend changes:
SMA MAD SuperTrend Long: Triggered when the trend turns bullish.
SMA MAD SuperTrend Short: Triggered when the trend turns bearish.
Set up alerts in TradingView to receive notifications for these conditions.
Why Use This Script?
The SMA MAD SuperTrend | Oquant offers a fresh take on trend-following by integrating SMA as baseline and MAD for volatility measurement, providing an alternative to ATR-based SuperTrend indicators. Its clear visual signals, customizable inputs, and alert conditions make it versatile for traders of all levels.
⚠️ Disclaimer: This indicator is intended for educational and informational purposes only. Trading/investing involves risk, and past performance does not guarantee future results. Always test and evaluate indicators/strategies before applying them in live markets. Use at your own risk.

Volume Rotor Clock [hapharmonic]🕰️ Volume Rotor Clock
The Volume Rotor Clock is an indicator that separates buy and sell volume, compiling these volumes over a recent number of bars or a specified past period, as defined by the user. This helps to reveal accumulation (buying) or distribution (selling) behavior, showing which side has superior volume. With its unique and beautiful display, the Volume Rotor Clock is more than just a timepiece; it's a dynamic dashboard that visualizes the buying and selling pressure of your favorite symbols, all wrapped in an elegant and fully customizable interface.
Instead of just tracking price, this indicator focuses on the engine behind the movement: volume. It helps you instantly identify which assets are under accumulation (buying) and which are under distribution (selling).
---
🎨 20 Pre-configured Templates
---
🧐 Interpreting the Clock Display
The interface is designed to give you multiple layers of information at a glance. Let's break down what each part represents.
1. The Main Clock Hands (Current Chart Symbol)
The clock hands—hour, minute, and second—are dedicated to the symbol on your current active chart .
Minute Hand: Displays the base currency of the current symbol (e.g., USDT, USD) at its tip.
Hour Hand: Displays the percentage of the winning volume side (buy vs. sell) at its tip.
Color Gauge: The color of the text characters at the tip of both the hour and minute hands acts as your primary volume gauge for the current symbol.
If buy volume is dominant , the text will be green .
If sell volume is dominant , the text will be red .
Tooltip: Hovering your mouse over the text at the tip of the hour or minute or other spherical elements hand will reveal a detailed tooltip with the precise Buy Volume, Sell Volume, Total Volume, Buy %, and Sell % for the current chart's symbol.
2. The Volume Scanner: Bulls & Bears (Symbols Inside the Clock) 🐂🐻
The circular symbols scattered inside the clock face are your multi-symbol volume scanner. They represent the assets you've selected in the indicator's settings.
Green Circles (Bulls - Upper Half): These represent symbols from your list where the total buy volume is greater than the total sell volume over the defined "Lookback" period. They are considered to be under bullish accumulation. The size of the circle and its text grows larger as the buy percentage becomes more dominant. The percentage shown within the circle represents the buy volume's share of the total volume, calculated over the 'Lookback (Bars)' you've set.
Red Circles (Bears - Lower Half): These represent symbols where the total sell volume is greater than the total buy volume. They are considered to be under bearish distribution or selling pressure. The size of the circle indicates the dominance of the sell-side volume. The percentage shown within the circle represents the sell volume's share of the total volume, calculated over the 'Lookback (Bars)' you've set.
3. The Bullish Watchlist (Symbols Above the Clock) ⭐
The symbols arranged neatly along the top edge of the clock are the "best of the bulls." They are symbols that are not only bullish but have also passed an additional, powerful strength filter.
What it Means: A symbol appears here when it shows signs of sustained, high-volume buying interest . It's a way to filter out noise and focus on assets with potentially significant accumulation phases.
The Filter Logic: For a bullish symbol (where total buy volume > total sell volume) to be promoted to the watchlist, its trading volume must meet specific criteria based on this formula:
ta.barssince(not(volume > ta.sma(volume, X))) >= Y
In plain English, this means: The indicator checks how many consecutive bars the `volume` has been greater than its `X`-bar Simple Moving Average (`ta.sma(volume, X)`). If this count is greater than or equal to `Y` bars, the condition is met.
(You can configure `X` (Volume MA Length) and `Y` (Consecutive Days Above MA) in the settings.)
Why it's Useful: This filter is powerful because it looks for consistency . A single spike in volume can be an anomaly. However, when an asset's volume remains consistently above its recent average for several consecutive days, it strongly suggests that larger players or a significant portion of the market are actively accumulating the asset. This sustained interest can often precede a significant upward price trend.
---
⚙️ Indicator Settings Explained
The Volume Rotor Clock is highly customizable. Here’s a detailed walkthrough of every setting available in the "Inputs" tab.
🎨 Color Scheme
This group allows you to control the entire aesthetic of the clock.
Template: Choose from a wide variety of professionally designed color themes.
Use Template: A simple checkbox to switch between using a pre-designed theme and creating your own.
`Checked`: You can select a theme from the dropdown menu, which offers 20 unique templates like "Cyberpunk Neon" or "Forest Green". All custom color settings below will be disabled (grayed out and unclickable).
`Unchecked`: The template dropdown is disabled, and you gain full control over every color element in the sections below.
🖌️ Custom Appearance & Colors
These settings are only active when "Use Template" is unchecked.
Flame Head / Tail: Sets the start and end colors for the dynamic flame effect that traces the clock's border, representing the second hand.
Numbers / Main Numbers: Customize the color of the regular hour numbers (1, 2, 4, 5...) and the main cardinal numbers (3, 6, 9, 12).
Sunburst Colors (1-6): Controls the six colors used in the gradient background for the "sunburst" effect inside the clock face.
Hands & Digital: Fine-tune the colors for the Hour/Minute Hand, Second Hand, central Pivot point, and the digital time display.
Chain Color / Width: Customize the appearance of the two chains holding the clock.
📡 Volume Scanner
Control the behavior of the multi-symbol scanner.
Show Scanner Labels: A master switch to show or hide all the bull/bear symbol circles inside the clock.
Lookback (Bars): A crucial setting that defines the calculation period for buy/sell volume for all scanned symbols. The calculation is a sum over the specified number of recent bars.
`0`: Calculates using the current bar only .
`7`: Calculates the sum of volume over the last 8 bars (the current bar + 7 historical bars).
Symbols List: Here you can enable/disable up to 20 slots and input the ticker for each symbol you want to scan (e.g., BINANCE:BTCUSDT , NASDAQ:AAPL ).
⭐ Bullish Watchlist Filter
Configure the criteria for the elite watchlist symbols displayed above the clock.
Enable Watchlist: A master switch to turn the entire watchlist feature on or off.
Volume MA Length: Sets the lookback period `(X)` for the Simple Moving Average of volume used in the filter.
Consecutive Days Above MA: Sets the minimum number of consecutive days `(Y)` that volume must close above its MA to qualify.
Symbols Per Row: Determines the maximum number of watchlist symbols that can fit in a single row before a new row is created above it.
Background / Text Color: When not using a template, you can set custom colors for the watchlist symbols' background and text.
📏 Position & Size
Adjust the clock's placement and dimensions on your chart.
Clock Timezone: Sets the timezone for the digital and analog time display. You can use standard formats like "America/New_York" or enter "Exchange" to sync with the chart's timezone.
Radius (Bars): Controls the overall size of the clock. The radius is measured in terms of the number of bars on the x-axis.
X Offset (Bars): Moves the entire clock horizontally. Positive values shift it to the right; negative values shift it to the left.
Y Offset (Price %): Moves the entire clock vertically as a percentage of your screen's price pane. Positive values move it up; negative values move it down.

MA Table [RanaAlgo]The "MA Table " indicator is a comprehensive and visually appealing tool for tracking moving average signals in TradingView. Here's a short summary of its usefulness:
Key Features:
Dual MA Support:
Tracks both EMA (Exponential Moving Average) and SMA (Simple Moving Average) signals (10, 20, 30, 50, 100 periods).
Users can toggle visibility for EMA/SMA separately.
Clear Signal Visualization:
Displays Buy (▲) or Sell (▼) signals based on price position relative to each MA.
Color-coded (green for buy, red for sell) for quick interpretation.
Customizable Table Design:
Adjustable position (9 placement options), colors, text size, and border styling.
Alternating row colors improve readability.
Optional MA Plots:
Can display the actual MA lines on the chart for visual confirmation (with distinct colors/styles).
Usefulness:
Quick Overview: The table consolidates multiple MA signals in one place, saving time compared to checking each MA individually.
Trend Confirmation: Helps confirm trend strength when multiple MAs align (e.g., price above all MAs → strong uptrend).
Flexible: Suitable for both short-term (10-20 period) and long-term (50-100 period) traders.
Aesthetic: Professional design enhances chart clarity without clutter.
Ideal For:
Traders who rely on moving average crossovers or price-MA relationships.
Multi-timeframe analysis when combined with other tools.
Beginners learning MA strategies (clear visual feedback).

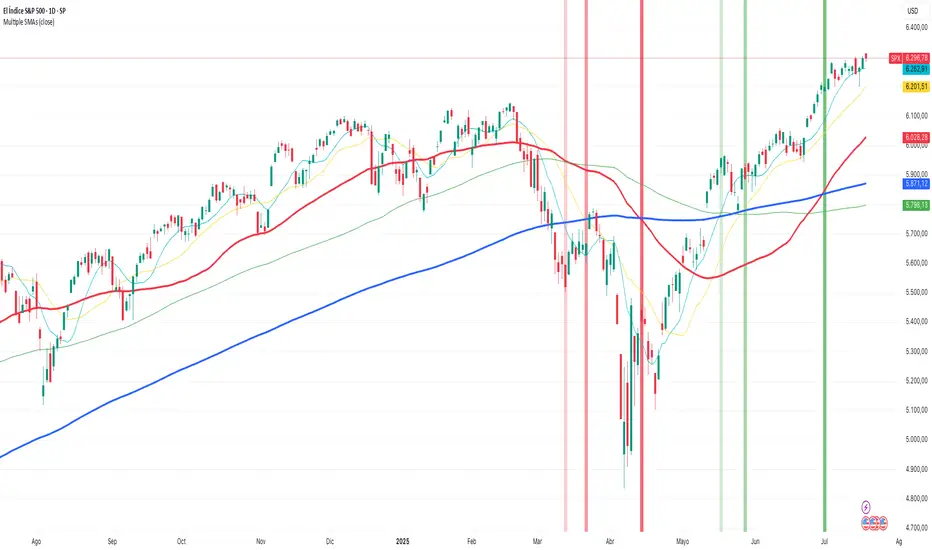
Multiple SMAsPlots multiple SMAs in a single indicator.
This script only plots the SMAs if the timeframe is set to daily.
- SMA10 in light blue
- SMA20 in yellow
- SMA50 in red
- SMA100 in green
- SMA200 in blue
It also plots the crosses between SMA20 and SMA50