(JS) Moving Average Secuirty OscillatorThis is kind of like the Moving Average Crossover Oscillator - except this measures in % the distance between the security you're charting and the MA you have entered in.
The goal is to see when the price pulls too far from the MA.
Hope you like it!
Sma

(JS) Moving Average Crossover OscillatorPretty simple really - another indicator I built with the intention of keeping the price action as clear as possible.
This oscillator is pretty generic;
-You have a choice between two SMA or two EMA which you simply just check the box to decide.
-There is a box you can check to use the resolution on your chart, or you can turn it off and use a custom resolution instead.
-The oscillator is graphed on the percentage of distance - so positive 4 means the fast MA is 4% above the slow one.
I like to see the price action clearly without obstruction - so I hope that people who share my view like this as much as I do.
Enjoy!
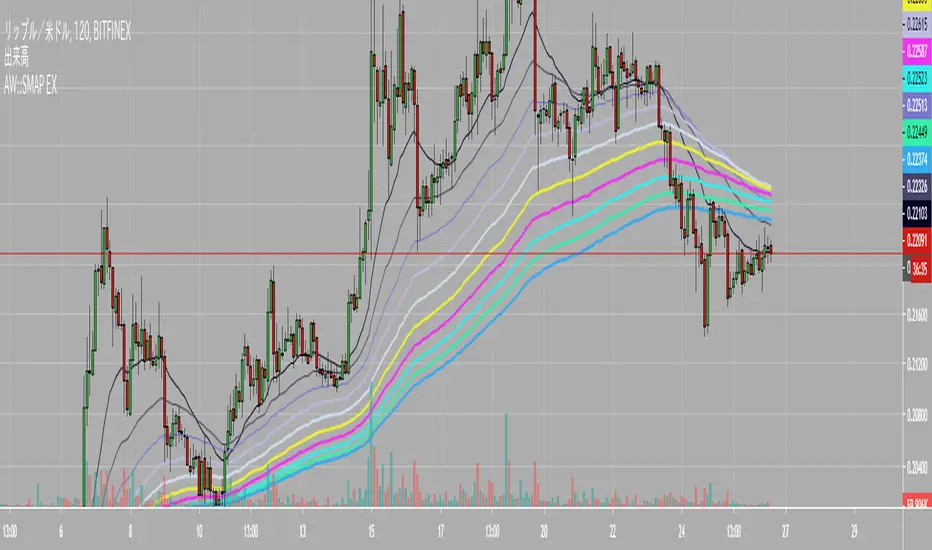
ArkWork:: Switchable MA Package ExtensionThis indicator add many EMA (or SMA ).
Each EMA switchable to SMA .
If you need shiftable x, like "Ichimoku clouds", it's avalable.
This have "arithmetic progression" system.
If "AP" option isn't 0, "arithmetic progression" to active.
(* If "arithmetic progression" active, EMA 02 - EMA 10 isn't avalable)
Length01 = 20
Length02 = (Length01 + AP)
.... to 10.
Q. How many?
A. It’s 10 EMA .
Q. How much does it cost?
A. 850 JPY or other.
Q. How to buy.
A. note.mu

ArkWork:: Switchable MA PackageThis indicator add many EMA(or SMA).
Each EMA switchable to SMA.
Q. How many?
A. It’s 10 EMA.
Q. How much does it cost?
A. 600 JPY or other.
Q. How to buy.
A. note.mu

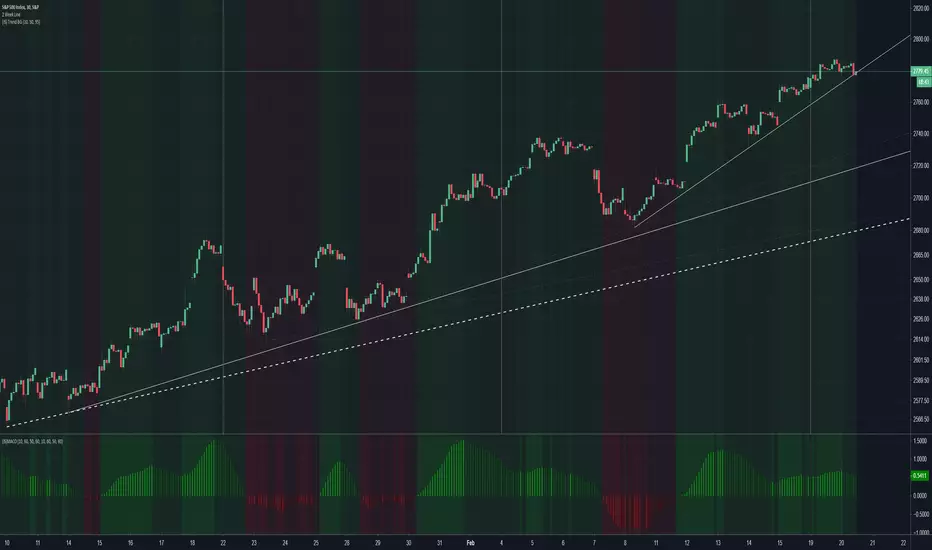
[ALERTS] CMYK-RMI-SMA
▼ This is the study version of the script, For usage with Autoview
◊ Introduction
This script makes use of three RMI's and SMA's, that indicate Overbought/Oversold on different Periods that correspond with Frequency’s that move the market.
◊ Origin
This is an update on █▓▒░ CMYK ♦ RMI ♦ TRIPLE ░▒▓█
◊ Usage
This script is intended for Automated Trading on the 1-5 minute chart.
◊ Features Summary
Two Part Indicator
Strategy Type Selection
Three RMI's SMA's
Trend adjustment
Pump/Dump Entry Delay
Pyramiding
Ignore first entries
Take Profit
Interval between Entries
Multiring Fix
Alert signal Seperation
◊ Community
Wanna try this script out ? need help resolving a problem ?
CMYK :: discord.gg
AUTOVIEW :: discordapp.com
TRADINGVIEW UNOFFICIAL :: discord.gg
◊ Setting up Autoview Alerts
Use the study version of this script, To set up The Alerts Autoview Picks up on.
Goto the CMYK Discord for support and Settings.
◊ Backtesting
Use the strategy version of this script for backtesting.
◊ Contact
Wanna try this script out ? need help resolving a problem ?
CMYK :: discord.gg
HAPPY TRADES!!!

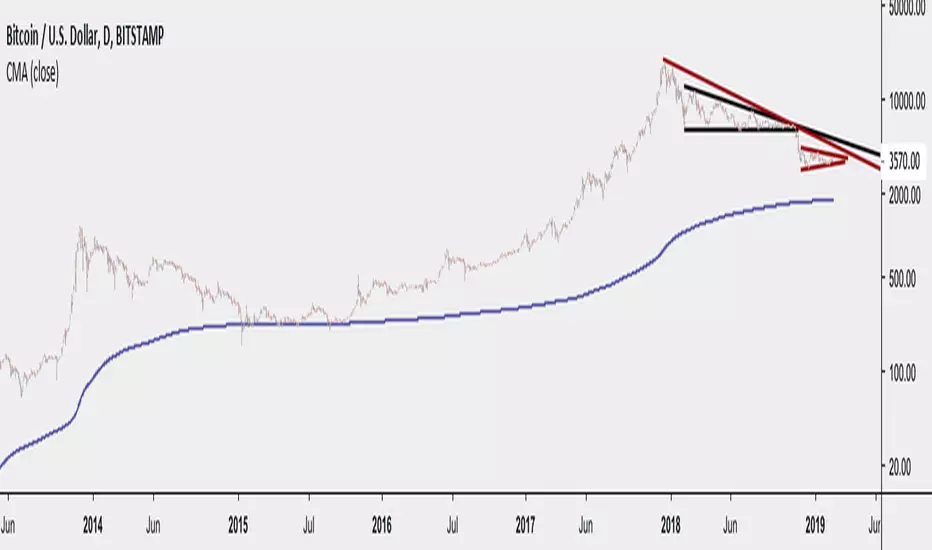

Multiple Simple Moving AveragesOne no-fuss indicator for SMA for 6 different time period (10, 20, 50, 100, 200, 250), styled with sharp and thin line for shorter time period to light-coloured and wide line for longer time period.

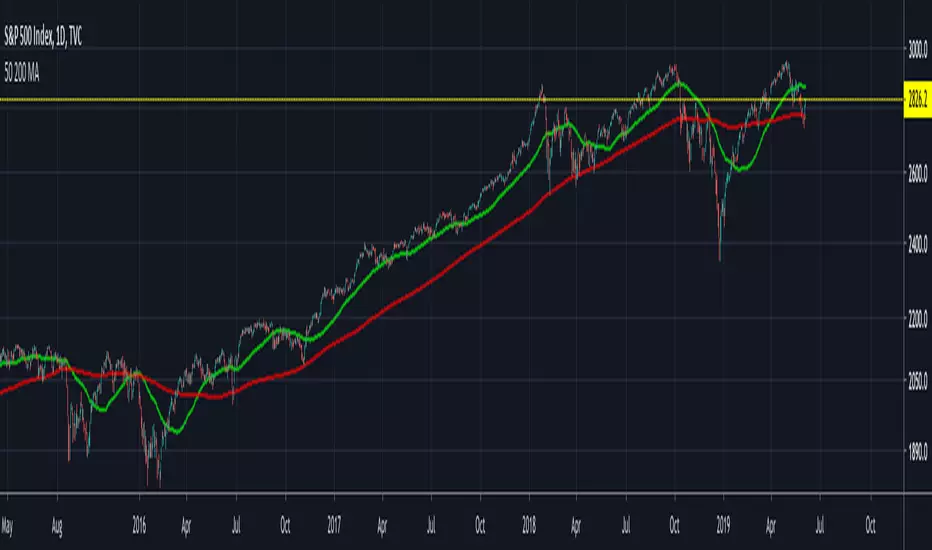
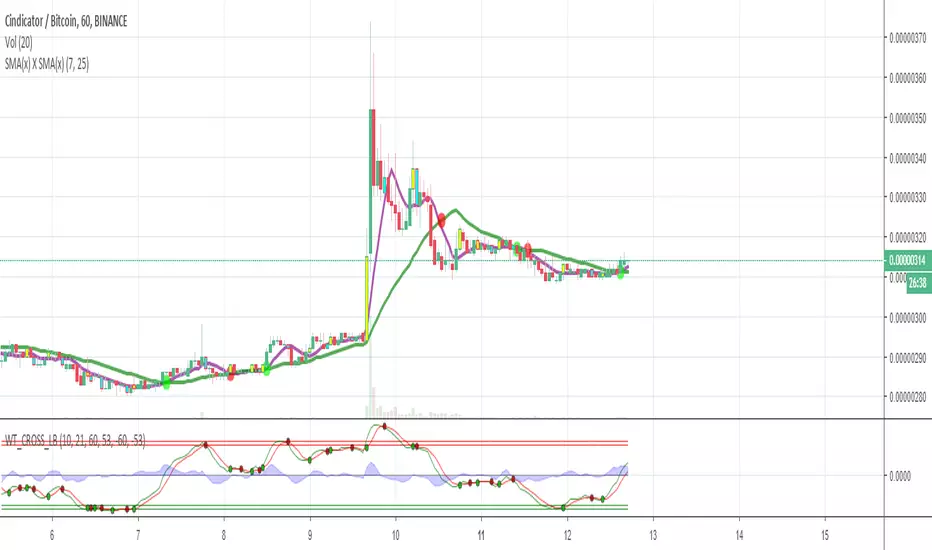
SMA Cross (Short X Long)Its a graph for detecting the SMA cross points.
When short SMA crosses the long SMA downside up it may be a buy signal and the opposite is may be a sell signal.
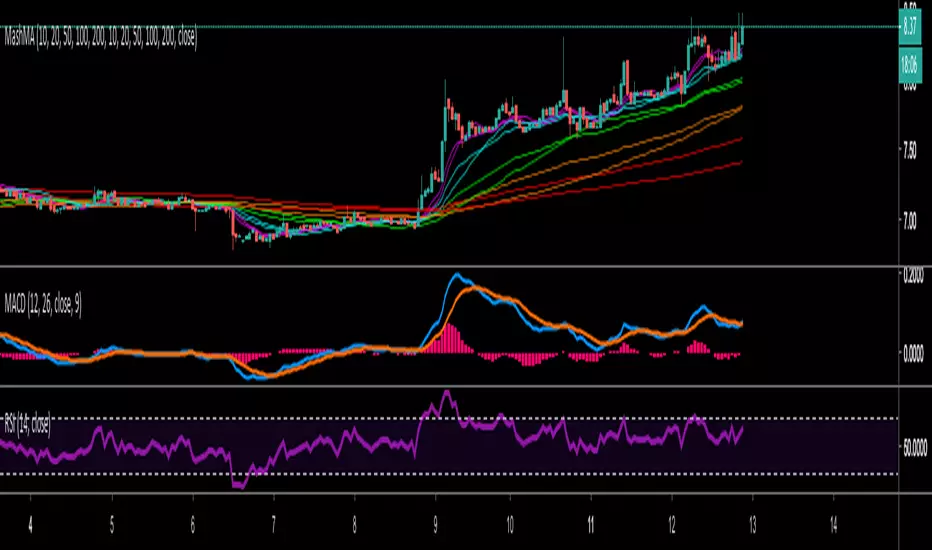
Mash Moving AveragesThis tweaked Moving averages script allows you to edit your Moving Averages to whatever you like, plus you have the option of choosing EMA and SMA
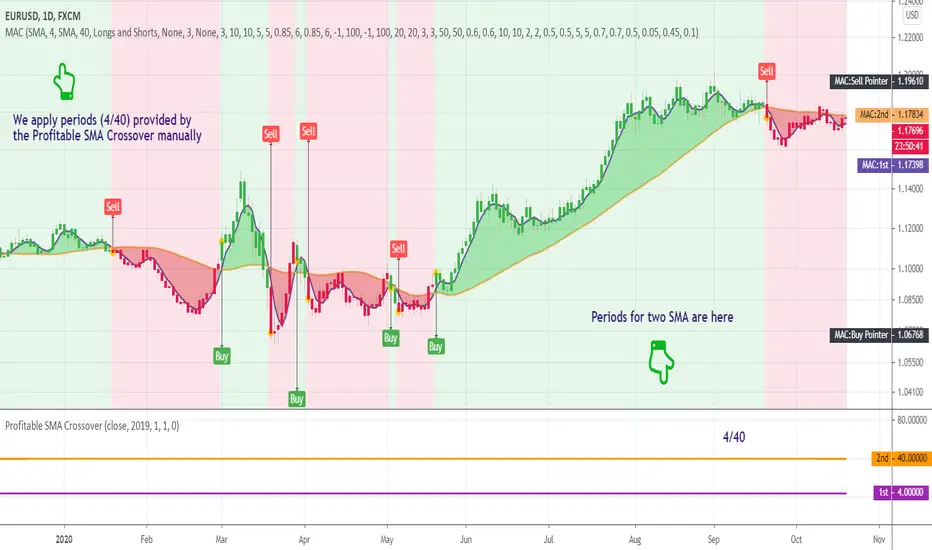
Profitable SMA CrossoverWhat is this tool?
This tool is a performance scanner of the crossover trading system that is based on the two simple moving averages (SMA). It uses a decision tree-based algorithm under the hood to find and plot the most profitable periods of the SMA combination.
It analyzes the range of periods between 4 to 45 and backtests each combination across the entire history of an instrument. If the more profitable periods were detected the indicator will switch periods of the moving averages immediately.
This is an add-on for the Ingenious SMA Crossover but can be used standalone.
Alerts
It has an alert that notifies when the more profitable periods were detected.
NOTE : It does not change what has already been plotted.
Good luck!
Ingenious SMA CrossoverIntroduction
A popular use for moving averages is to develop simple trading systems based on moving average crossovers. A trading system using two moving averages would give a buy signal when the shorter (faster) moving average advances above the longer (slower) moving average. A sell signal would be given when the shorter moving average crosses below the longer moving average. The speed of the systems and the number of signals generated will depend on the period of the moving averages.
What is this tool?
This tool is a crossover system of two simple moving averages. I called it "Ingenious" because it uses a decision tree-based algorithm under the hood to find and plot the most profitable SMA combination.
It analyzes the range of periods between 4 to 45 and backtests each combination across the entire history of an instrument. If the more profitable periods were detected the indicator will switch periods of the moving averages to the found ones immediately.
NOTE : It does not change what has already been plotted.
Good luck!

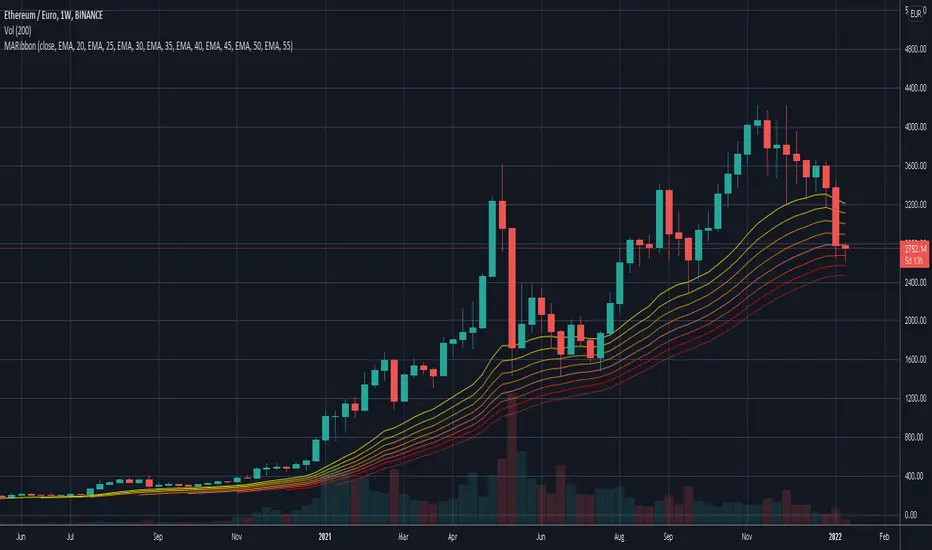
Multi SMAPlot all of the most important SMA values.
SMA 5, 8, 13 are based on Fibonaci values and frequently used in day trading frequently.
SMA 50, 100, 200 are important support/resistance lines.
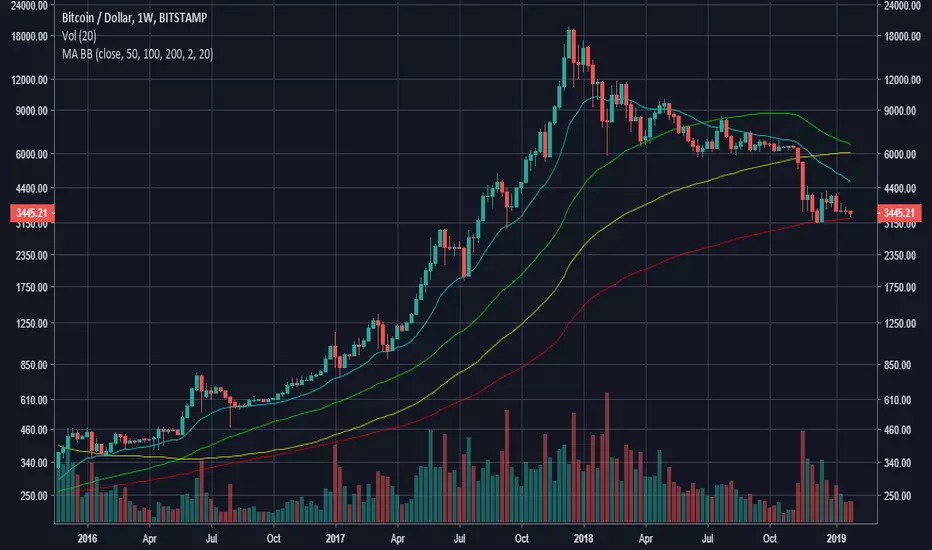
Especially, SMA 50, 100, 200 are the most important support/resistance on BTC 1W. Dont forget to look at the weekly prices when trading :)
Bitazu MA 5,10Displays 5,10 MAs on a single indicator.
Useful for Crypto trading and reduced the number of indicators needed to view multiple EMAs
When shorter MA crosses over the longer it's a good sign of Bullish/Bearish reversal.
This sentiment is more true at longer timeframes, such as daily candles, as the trend has more momentum.

Bitazu MA 10,20Displays 10, 20 MAs on a single indicator.
Useful for Crypto trading and reduced the number of indicators needed to view multiple MAs
When shorter MA crosses over the longer it's a good sign of Bullish/Bearish reversal.
This sentiment is more true at longer timeframes, such as daily candles, as the trend has more momentum.

Multiple customizable MA own timeresolution own MA-typeMultiple (8) customizable MA
Features:
Set MA-Type/Smoothing: "RMA", "SMA", "EMA", "WMA", "VWMA"
Set Timeframe/Resolution: "60", "240", "1D", "1W", "1M", "Chart"
To use the native chart time resolution select "Chart" as TimeFrame

Moving Averages & Bollinger Bands3 Moving Averages and Bollinger Bands in 1 Indicator
SMA or EMA
Exponential Bollinger Bands available
Turn bands on or off
Customize period length and standard deviations
Momentum Oscillators [CP]This is collection of 3 Momentum Oscillators:
*RSI
*Stochastic
*SRSI
You can filter each one with the following options:
*SMA
*EMA
*Hull MA
*Linear Regression
*Laguerre
*SuperSmoother
*SuperSmoother
