RMI Valid FVG & IFVGRMI • Valid FVG & iFVG (Smart Money Concept)
RMI • Valid FVG & iFVG is a precision-focused Fair Value Gap indicator designed for traders who follow Smart Money Concepts (SMC) / ICT logic and want to filter out low-quality, random gaps.
This indicator does not plot every FVG.
It highlights only structurally relevant FVGs that form in the direction of the trend and have a high probability of being filled.
Core Features
Bullish & Bearish Fair Value Gaps
Inverse Fair Value Gaps (iFVG)
Trend-aligned FVG filtering
Automatic invalidation after mitigation
Clean background zones for clear visibility
Optimized for intraday trading
Adjustable settings for scalping, intraday & swing trading
Smart Filtering Logic
FVGs are validated using market structure context
Only FVGs that form within the active trend are displayed
Weak or low-probability gaps are ignored
Inverse FVGs appear after strong displacement and rejection
Zones are visually faded once mitigated
This helps reduce chart noise and keeps the focus on high-probability reaction zones.
Best Use Cases
Entry refinement after BOS / CHoCH
Confluence with liquidity grabs
Premium / discount zone trading
Intraday & session-based trading
Works well with ICT, SMC, price action & structure-based strategies
Recommended Timeframes
Scalping: M1 – M5
Intraday (default): M5 – M15
Swing Trading: M15 – H1
(Default settings are optimized for intraday trading.)
Important Notes
This is not a signal indicator
No repainting
No buy/sell arrows
Designed as a decision-support tool, not an automated system
Always combine with proper risk management and confirmation.
RMI • Precision over noise.
Trade structure, not randomness.
SMC

ICT MTF FVG BPR Toolkit [D4A}The ICT MTF FVG BPR Toolkit encompasses the following 5 components:
- Fair Value Gaps - current timeframe
- Fair Value Gaps - higher timeframe
- BPR - Balanced Price Range
- Long Wicks - which are considered to be gaps by ICT
- Immediate Rebalance - it leaves no gaps, but is as important in assessing current workflow
This is advanced Fair Value Gaps script that uses trading methodology taught by ICT trader. To use it effectively it requires at least some basic knowledge of Smart Money Concepts (SMC) as outlined in ICT's lectures found on YT. I may publish another SMC related scripts in future if this kind of tool is useful to anybody.
The idea behind this work, is to have all the necessary tools related to Fair Value Gaps in one script that is easy to use (requires SMC knowledge), fully customizable and will keep the chart as clutter free as possible. Since, I could not find a ready-made script which would tick all my requirements, I created this new script, partially by borrowing some ideas and code from existing open source projects that I liked. Rather than re-inventing the wheel, I focused on adopting and improving existing solutions and have them work together in one tool that could present the information accurately and in a polished way, where the trader can customize almost everything. Full credit goes to other coders, who tackled this subject before me, but particularly to:
QuantVue
LuxAlgo
pmk07
The script have these unique features:
- Can present FVGs from up to 3 different timeframes at any given interval
- The amount and interval of higher timeframe FVGs is fully customizable
- FVGs can be displayed based on size
- Volume Imbalance can be included as part of FVG (as recommended by ICT)
- Higher timeframe FVGs can have quadrants displayed along with C.E. (based on ATR filter)
- Both current and higher timeframe FVGs can be displayed in different ways depending on price interactions
- BPR which works on current timeframe only
- Long Wick detection logic has been slightly changed from the original LuxAlgo code
- Immediate Rebalance code has been simplified and re-focused on clarity
-----------------
Disclaimer
The information contained in my Scripts/Indicators/Ideas/Algos/Systems does not constitute financial advice or a solicitation to buy or sell any securities of any type. I will not accept liability for any loss or damage, including without limitation any loss of profit, which may arise directly or indirectly from the use of or reliance on such information.
All investments involve risk, and the past performance of a security, industry, sector, market, financial product, trading strategy, backtest, or individual's trading does not guarantee future results or returns. Investors are fully responsible for any investment decisions they make. Such decisions should be based solely on an evaluation of their financial circumstances, investment objectives, risk tolerance, and liquidity needs.
My Scripts/Indicators/Ideas/Algos/Systems are only for educational purposes!

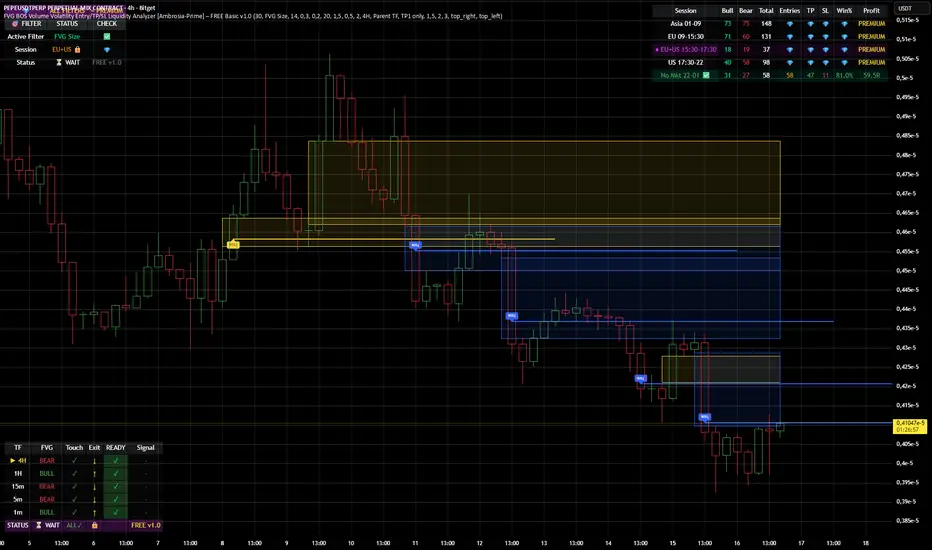
FVG BOS SMC Liquidity Analyzer - Ambrosia-Prime - Basic v1.0# 📘 USER GUIDE
# FVG BOS Volume Volatility Entry/TP/SL Liquidity Analyzer
## 🆓 FREE Basic v1.0 | by Ambrosia-Prime
---
## 📋 TABLE OF CONTENTS
1. (#what-is-this-indicator)
2. (#settings-explained)
3. (#understanding-the-tables)
4. (#your-first-trade)
5. (#free-vs-premium)
6. (#faq)
---
## 🎯 WHAT IS THIS INDICATOR?
The **FVG Analyzer** is a professional trading tool based on **Smart Money Concepts (SMC)** and **ICT strategies**. It automatically detects:
✅ **Fair Value Gaps (FVG)** - Market imbalances
✅ **Break of Structure (BOS)** - Trend confirmations
✅ **Multi-Timeframe Analysis** - 4H, 1H, 15m, 5m, 1m
✅ **Entry, Stop-Loss & Take-Profit** - Automatic level calculation
### The Debug Table shows you everything:
| TF | FVG | Touch | Exit | READY | Signal |
|-----|------|-------|------|-------|--------|
| ► 4H| BULL | ✓ | ↑ | ✓ | LONG |
| 1H | BULL | ✓ | ↑ | ✓ | LONG |
| 15m | BULL | ✓ | ↑ | ✓ | LONG |
When all timeframes show **READY** → **ENTRY SIGNAL!**
---
## ⚙️ SETTINGS EXPLAINED
### 👁 DISPLAY SETTINGS
| Setting | Description |
|---------|-------------|
| Show Bullish FVG | Display yellow FVG boxes |
| Show Bearish FVG | Display blue FVG boxes |
| Show BOS lines | Break of Structure lines |
| Show Session Stats | Statistics table (top right) |
| Show Debug Table | Cascade status (bottom left) |
| Show Entry/SL/TP | Entry lines on signals |
### 🎯 BASIC FILTER (Choose ONE)
In the **FREE Version** you can only activate **1 filter** at a time:
| Filter | What it does |
|--------|--------------|
| **None** | No filter active |
| **FVG Size** | Only FVGs larger than X × ATR |
| **Volume** | Only on above-average volume |
| **Volatility** | Only on normal volatility (not too wild) |
| **BOS only with FVG** | BOS only when open FVG exists |
| **Fill Delete** | FVG disappears when completely filled |
> 💎 **PREMIUM:** Use all 15+ filters simultaneously!
### 🔄 TOUCH + EXIT CASCADE
| Setting | Options | Recommendation |
|---------|---------|----------------|
| Cascade Parent TF | 4H, 1H, 15m | **4H** for Swing |
| Confirm EXIT by WICK | ON/OFF | **ON** for more signals |
| Entry Trigger Level | Lowest/Middle/Parent | **Parent TF** |
| Require ALL TFs | ON/OFF | **ON** for quality |
### 📊 TP SETTINGS
| Setting | Description |
|---------|-------------|
| TP Mode | TP1 only / TP1+TP2 / TP1+TP2+TP3 |
| TP1 Risk:Reward | e.g. 1.5 = 1.5× your risk |
| TP2 Multiplier | e.g. 2.0 = 2× TP1 |
| TP3 Multiplier | e.g. 3.0 = 3× TP1 |
---
## 📈 UNDERSTANDING THE TABLES
### 📍 Filter Status (Top Left)
```
┌─────────────────────────────────────┐
│ 💎 │ ALL FILTERS │ = PREMIUM │
├─────────────────────────────────────┤
│ Active Filter │ FVG Size │ ✅ │
│ Session │ EU 🔒 │ 💎 │
│ Status │ ⏳ WAIT │FREE v1.0│
└─────────────────────────────────────┘
```
- **Active Filter:** Your selected filter
- **Session:** Current trading session
- 🔒 = Locked (PREMIUM only)
- ✅ = Unlocked (No Market 22-01 CET)
- **Status:** WAIT / 🟢 LONG / 🔴 SHORT
### 📊 Session Stats (Top Right)
```
┌──────────────────────────────────────────────────────────┐
│ Session │Bull│Bear│Total│Entries│TP│SL│Win%│Profit│
├──────────────────────────────────────────────────────────┤
│ Asia 01-09 │173 │161 │ 334 │ 💎 │💎│💎│ 💎 │PREMIUM│
│ EU 09-15:30 │131 │146 │ 277 │ 💎 │💎│💎│ 💎 │PREMIUM│
│ EU+US 15:30-17:30│ 37 │ 42 │ 79 │ 💎 │💎│💎│ 💎 │PREMIUM│
│ US 17:30-22 │ 95 │106 │ 201 │ 💎 │💎│💎│ 💎 │PREMIUM│
│ No Mkt 22-01 ✅ │ 42 │ 52 │ 94 │ 14 │14│ 0│100%│ 9.8R │
└──────────────────────────────────────────────────────────┘
```
**In FREE you see:**
- ✅ Bull/Bear/Total FVGs for **ALL** sessions
- ✅ Complete stats only for **No Market (22-01 CET)**
- 💎 Other sessions = **PREMIUM**
### 🔍 Debug Table (Bottom Left)
Shows the **live status** of the cascade:
| Symbol | Meaning |
|--------|---------|
| ► | Parent timeframe (selected) |
| BULL/BEAR | FVG direction |
| ✓ (Touch) | Price touched the zone |
| ↑/↓ (Exit) | Price exited the zone |
| ✓ (READY) | Timeframe is ready |
| LONG/SHORT | Signal direction |
---
## 🚀 YOUR FIRST TRADE
### Preface - Why this Indicator is Different
This indicator can filter so **aggressively** that you receive few or almost no signals. **That was exactly my goal!**
I don't need 500 entries per day staring at a chart all day long.
**I only need 1-3 signals per day - and they should work.**
That was the goal. Quality over quantity.
---
### Step-by-Step Guide:
**1. Create a Watchlist**
- Create a watchlist in TradingView
- Add as many charts as your account allows
- Add the indicator to all charts
**2. Set up Alerts**
- Go to the **4H chart**
- Set up the alert:
- **FREE:** Only "No Market" session (22-01 CET)
- **PREMIUM:** All sessions available
- Select "Any Entry Signal"
**3. React to Alert Signal**
- When an alert comes → Switch to the chart
- Check the **Session Stats Table** (top right)
- There you see: Entry, TP, SL, Win%, Profit
**4. Optimize Entry**
- Open the **Settings** (gear icon)
- Adjust the **TP** until you win all trades
- *(Sometimes profit is higher when you lose one trade but have a higher TP)*
- When you've found the best profit result:
- **Take the set TP minus 10-20%**
- *(We don't want to be greedy, but we want to win!)*
**5. Manage Trade**
- The **SL price** is already provided
- The **TP price** adjusts to your settings
- Set your trade accordingly
**6. Done!**
- Start the trade
- Wait for the next signal on another chart
- Repeat!
---
### ⚠️ Important Note
> Remember: A trade can always hit SL!
> Only trade with money you can afford to lose.
>
> I wish you great success and let me know how successful you were.
> **I will read every comment and answer to the best of my ability.**
---
## 💎 FREE vs PREMIUM
### *Coming soon - Currently in Release Testing*
### What you get with FREE:
| Feature | FREE 🆓 |
|---------|---------|
| FVG Detection (all TFs) | ✅ |
| BOS Detection | ✅ |
| Cascade Logic | ✅ |
| Debug Table | ✅ |
| Session Stats Table | ✅ |
| Entry/SL/TP Lines | ✅ |
| Filters | **1 at a time** |
| Trading Sessions | **Only No Market (22-01)** |
| Alerts | **Only No Market** |
### What you get with PREMIUM:
| Feature | PREMIUM 💎 |
|---------|------------|
| Everything from FREE | ✅ |
| **15+ filters simultaneously** | ✅ |
| **All sessions unlocked** | ✅ |
| → Asia (01-09) | ✅ |
| → EU (09-15:30) | ✅ |
| → EU+US Overlap (15:30-17:30) | ✅ |
| → US (17:30-22) | ✅ |
| **Alerts for all sessions** | ✅ |
| **Session-based TP optimization** | ✅ |
| **HTF Zone Confluence Filter** | ✅ |
| **Structure Filter (HH/HL/LH/LL)** | ✅ |
| **RR Filter** | ✅ |
| **Trend EMA Filter** | ✅ |
| **Candle Quality Filter** | ✅ |
| **Cooldown Filter** | ✅ |
| **FVG Age Filter** | ✅ |
### 🚀 PREMIUM EDITION (Exclusive!)
The Premium version has **two different entry logics** - that's why the testing phase is still ongoing.
Finds setups with **10-100% potential!**
---
## ❓ FAQ
### "Why don't I see any entries?"
**Possible reasons:**
1. **Wrong session:** FREE only works 22:00 - 01:00 CET
2. **Cascade not READY:** All TFs must show ✓
3. **Filter blocking:** Check your active filter
4. **Already in trade:** "Single Trade" allows only 1 trade
### "What do the colors mean?"
| Color | Meaning |
|-------|---------|
| 🟡 Yellow | Bullish FVG / Entry line |
| 🔵 Blue | Bearish FVG |
| 🟢 Green | TP line / Positive |
| 🔴 Red | SL line / Negative |
| 🟣 Purple | EU+US Overlap Session |
### "Which timeframe should I use?"
| Your Style | Chart TF | Cascade Parent |
|------------|----------|----------------|
| Scalping | 1m - 5m | 15m |
| Daytrading | 5m - 15m | 1H |
| Swing | 15m - 1H | 4H |
### "Can I change the sessions?"
- **FREE:** No, only No Market (22-01) is available.
- **PREMIUM:** Yes, all sessions + session-based TP values!
---
## 📞 WANT MORE?
### Unlock PREMIUM:
- ✅ All Sessions
- ✅ All Filters
- ✅ 2 Entry Logics
- ✅ Priority Support
### Contact & Support:
📊 **TradingView:** (www.tradingview.com)
---
## 📜 CHANGELOG
### v1.0 FREE (December 2024)
- Initial Release
- Multi-TF FVG Detection
- BOS Detection
- Cascade Logic
- 1 Filter (Dropdown)
- No Market Session (22-01)
- Session Statistics
- Debug Table
---
## ⚠️ DISCLAIMER
This indicator is an **analysis tool** and not financial advice.
Trading involves risks. Past results do not guarantee future profits.
Only trade with capital you can afford to lose.
---
**Good luck with your trading! 🚀**
*Your Ambrosia-Prime*
---
*© 2024 Ambrosia-Prime. All rights reserved.*
Market Structure HighLow + Liquidity [MaB]📊 Market Structure HighLow + Liquidity
A comprehensive indicator combining precision market structure analysis with real-time liquidity zone detection.
━━━━━━━━━━━━━━━━━━━━━━━━━━━━━━━━━━━━━━━━
🎯 KEY FEATURES
• Automatic Swing Detection
Identifies structural High/Low points using a dual-confirmation system (minimum candles + pullback percentage)
• Smart Trend Tracking
Automatically switches between Uptrend (Higher Highs & Higher Lows) and Downtrend (Lower Highs & Lower Lows)
• Breakout Alerts
Visual markers for confirmed breakouts (Br↑ / Br↓) with configurable threshold
• Sequential Labeling
Clear numbered labels (L1, H2, L3, H4...) showing the exact market structure progression
• Color-Coded Structure Lines
- Green: Uptrend continuation legs
- Red: Downtrend continuation legs
- Gray: Trend inversion points
• Imbalance Zones (FVG)
Automatically detects Fair Value Gaps that form during impulsive moves between validated swing points
• Inducement Zones
Identifies potential liquidity traps - FVGs that form before breakout confirmation, often used as stop-hunt areas
• Dynamic Zone Management
Zones automatically close when price touches them, with configurable retracement sensitivity
━━━━━━━━━━━━━━━━━━━━━━━━━━━━━━━━━━━━━━━━
⚙️ CONFIGURABLE PARAMETERS
Market Structure
• Analysis Start Date: Define when to begin structure analysis
• Min Confirmation Candles: Required candles for validation (default: 3)
• Pullback Percentage: Minimum retracement for confirmation (default: 10%)
• Breakout Threshold: Percentage beyond structure for breakout (default: 1%)
Liquidity
• Show Zones: Toggle visibility of imbalance and inducement zones
• Zone Colors: Customize colors for Supply/Demand imbalances and inducements
• Zone Retracement %: How deep price must enter zone to consider it touched (0-100%)
• Inactive Zones Transparency: Visual distinction for closed zones
Display
• Show Market Structure Table: Toggle info panel
• Replay Mode: Optimize for TradingView Replay feature
━━━━━━━━━━━━━━━━━━━━━━━━━━━━━━━━━━━━━━━━
🎨 ZONE COLOR CODING
• 🔴 Imbalance Supply (Red): Bearish FVG - potential resistance/short entry
• 🟢 Imbalance Demand (Green): Bullish FVG - potential support/long entry
• 🟠 Inducement Supply (Orange): Pre-breakout bearish FVG - possible stop-hunt zone
• 🔵 Inducement Demand (Blue): Pre-breakout bullish FVb] - possible stop-hunt zone
━━━━━━━━━━━━━━━━━━━━━━━━━━━━━━━━━━━━━━━━
💡 HOW IT WORKS
1. Finds initial swing low using lookback period
2. Tracks price movement for potential High candidates
3. Validates candidates with dual criteria (candles + pullback)
4. Scans for FVG (Fair Value Gaps) between validated structure points
5. Classifies FVGs as Imbalance (post-breakout) or Inducement (pre-breakout)
6. Monitors zone interactions - closes zones when price retraces into them
7. Repeats the cycle, building complete market structure with liquidity mapping
━━━━━━━━━━━━━━━━━━━━━━━━━━━━━━━━━━━━━━━━
🔧 BEST USED FOR
• Identifying key support/resistance levels with liquidity context
• Spotting potential reversal zones (imbalances)
• Avoiding stop-hunt traps (inducement awareness)
• Trend direction confirmation
• Breakout trading setups with confluence
• Multi-timeframe structure and liquidity analysis
• Understanding where institutional orders may be resting
━━━━━━━━━━━━━━━━━━━━━━━━━━━━━━━━━━━━━━━━
⚠️ NOTES
- Works best on higher timeframes (1H+) for cleaner structure
- Inducement zones often convert to Imbalance zones after breakout confirmation
- Zone Retracement % allows fine-tuning: 0% = first touch, 25% = quarter penetration, 100% = full traversal
- Inactive zones remain visible (faded) to show historical liquidity levels
- Use Replay Mode when backtesting to prevent buffer overflow errors

STRUCTUREX SESSIONS - Smart Market Session ContextSTRUCTUREX SESSIONS is a clean, lightweight market session visualization tool that helps traders understand when different global markets are active.
█ WHAT IT DOES
This indicator displays:
- Session Boxes: Visual background for Asia, London, and New York sessions
- Session Opens: Horizontal line marking each session's opening price
- Session Transitions: Vertical markers at London and NY open times
- Kill Zones: Optional high-probability trading windows (London/NY open periods)
█ WHAT IT DOES NOT DO
- No BUY/SELL signals — this is context only
- No alerts or webhooks
- No regime detection — use STRUCTUREX CORE for that
█ HOW IT WORKS
The indicator uses TradingView's time() function to detect when price is within each session window. Sessions are fully customizable with hour inputs. Kill zones support minute-precision timing (e.g., 13:30-15:30 for NY).
Session detection includes safety guards to prevent issues if start and end times are set equal.
█ DEFAULT SESSION TIMES
- Asia: 00:00 - 07:00
- London: 07:00 - 12:00
- New York: 12:00 - 17:00
- London Kill Zone: 07:00 - 09:00
- NY Kill Zone: 13:30 - 15:30
All times reference your selected time zone (Exchange, UTC, or specific city).
█ PRESETS
- Minimal: Session boxes only, no labels or opens
- Clean: Session boxes + open lines, labels optional
- Detailed: All features enabled (boxes, opens, labels, transitions)
█ HOW TO USE
1. Add to chart — default "Clean" preset works for most traders
2. Choose your time zone reference (Exchange recommended for most)
3. Enable Kill Zones if you trade London/NY open strategies
4. Adjust session times if your broker uses different hours
█ STACKING WITH STRUCTUREX CORE
Add SESSIONS first (bottom layer), then STRUCTUREX CORE on top. Sessions provide timing context for when to look for setups; CORE provides the actual structure and zones.
█ SETTINGS OVERVIEW
Quick Start:
- Master toggles for Sessions, Opens, Transitions, Kill Zones
- Visual Preset selector
Time Reference:
- Exchange, UTC, or specific city time zone
Sessions:
- Individual enable toggles
- Start/End hour for each session
- Session label visibility
Session Opens:
- Line style (Solid/Dashed/Dotted)
- Line width
- Open label visibility
Kill Zones:
- London and NY kill zone windows
- Minute-precision timing support
Performance:
- Past sessions to display (0-5)
- Max boxes limit
█ NOTES
- Works on any market and timeframe
- Optimized for FX and Crypto
- Lightweight with minimal resource usage
- Part of the STRUCTUREX indicator suite

Auction Imbalance And Rebalance IndicatorThis indicator marks areas of Internal Range Liquidity along with Ecternal Range Liquidity

STRUCTUREX - Smart Market Structure and Liquidity (CORE)STRUCTUREX CORE is a comprehensive Smart Money Concepts (SMC) indicator that identifies market structure, liquidity zones, and institutional order flow patterns.
█ WHAT IT DOES
This indicator detects and visualizes:
- Market Structure: Swing Highs/Lows with HH, HL, LH, LL labels
- Break of Structure (BOS): Trend continuation signals
- Change of Character (CHOCH): Potential trend reversal signals with confidence grading (A/B/C)
- Order Blocks: Demand and supply zones from displacement candles
- Liquidity Pools: Equal Highs (EQH) and Equal Lows (EQL) with sweep detection
- Absorption Zones: Demand/supply from range compression with displacement
█ HOW IT WORKS
Structure Detection:
The swing engine uses configurable pivot detection with ATR-based filtering. Profile presets (Scalper/Intraday/Swing) automatically adjust sensitivity. BOS occurs when price breaks a reference swing level. CHOCH occurs when the opposite swing level breaks, signaling potential trend change.
Order Blocks:
Detected via displacement - strong impulsive candles that leave behind imbalance zones. Creation triggers include BOS, CHOCH, or pure displacement. Zones track mitigation (price returns to zone) and invalidation (price closes beyond zone).
Liquidity:
Equal Highs/Lows form when multiple pivots cluster at similar price levels (ATR tolerance). The engine detects sweeps (wick beyond, close inside) vs breaks (close beyond).
Absorption:
Range compression (tight consolidation) followed by displacement creates demand/supply zones.
█ QUALITY SCORING
All zones receive quality scores and tier grades (A/B/C) based on:
- Zone strength and displacement quality
- Freshness (recency)
- Position relative to current price
- Regime alignment (bullish zones in bullish regime score higher)
Top-N governance shows only the best zones per side to reduce clutter.
█ HOW TO USE
1. Select a Profile matching your timeframe (Scalper for M1-M5, Intraday for M15-H1, Swing for H4+)
2. Use Zone Density to control how many zones appear (Minimal/Balanced/Rich)
3. Look for confluence: OB + Liquidity + Structure alignment = higher probability
4. BOS = trend continuation opportunity
5. CHOCH = potential reversal, wait for confirmation
█ SETTINGS OVERVIEW
Quick Start:
- Profile: Preset pivot and filter values
- Enable Structure: Master toggle for Swing/BOS/CHOCH
- Enable Zones: Master toggle for OB/Liquidity/Absorption
Structure Visuals:
- BOS/CHOCH display style (Labels, Lines, or both)
- Line extension and styling
Order Blocks / Liquidity / Absorption:
- Enable toggles
- Tier display (A_B recommended)
- Max zones per side
- Advanced detection parameters
█ RECOMMENDED DEFAULTS
- Profile: Intraday
- OB/Liquidity/Absorption: Tier A_B, TopN 2-3
- Structure: Line+Label, 80 bar extension
- This gives a clean, professional chart
█ ALERTS
For alerts and webhooks, use the companion STRUCTUREX SIGNALS indicator (coming soon).
█ NOTES
- This is the CORE visual indicator - all drawings, no alerts
- Works on any market and timeframe
- Optimized for performance with visual throttling
- Settings organized for easy use: most users only need Quick Start options
APS - Sweeps & BOSThis indicator identifies pivot highs and lows, detects liquidity sweeps, and marks Break of Structure (BOS).
Key Features:
1) Pivot Detection :
The script uses configurable left and right bar parameters to identify significant pivot highs and lows, marking them with "X" labels on the chart. These pivots represent potential areas where price may react.
2) Sweep Detection :
A sweep occurs when price temporarily moves beyond a previous pivot level but closes back inside, suggesting a liquidity grab or stop hunt. The indicator draws horizontal lines connecting the original pivot to the sweep location and labels these events. Sweeps often precede reversals as they collect liquidity before moving in the opposite direction.
3) Break of Structure (BOS) :
BOS events are marked when price closes beyond a previous pivot level, indicating a potential shift in market structure. Bullish BOS occurs when price closes above a pivot high, while Bearish BOS occurs when price closes below a pivot low. These can signal continuation moves or trend changes.
4) Previous Day High/Low (PDH/PDL):
The indicator tracks the previous session's high and low (based on 6 PM ET session breaks, which auto-adjusts for DST) and displays whether these levels have been breached. It also calculates and displays a 50% equilibrium line between PDH and PDL.
5) Higher Timeframe Context :
A table in the top-right corner shows whether the higher timeframe close is in premium (above equilibrium) or discount (below equilibrium) territory. The HTF automatically adjusts based on your current timeframe.
6) Customization Options:
Adjustable pivot sensitivity (left/right bars)
Configurable sweep lookback period
Customizable colors, line styles, and label sizes for all elements
Toggle visibility for any component
Optional alerts for sweeps and BOS events
How to Use:
Sweeps near support/resistance often indicate liquidity grabs before reversals
BOS events can confirm directional bias changes
Use PDH/PDL levels as reference points for intraday trading
Consider HTF context when taking trades (discount zones for longs, premium zones for shorts)
Important Notes:
This indicator is designed for educational purposes and market analysis. Past patterns do not guarantee future results. Please follow proper risk management.

Smart Money Liquidity Structure AlgoSmart Money Liquidity Structure Algo is a rule-based trading strategy designed to analyze market structure, liquidity zones, and volatility conditions.
The script combines structure breakout logic, volatility filtering, order-block style price gaps, and Supertrend direction to generate systematic long and short signals.
This strategy is intended for educational and research purposes, helping traders study how liquidity, structure, and trend alignment can be combined into a single framework.
All signals are generated objectively using predefined conditions without repainting after bar close.
The strategy includes built-in risk management logic using ATR-based stop-loss and trailing exit mechanisms.
⚙️ Core Logic Overview
Market structure based on pivot-derived support and resistance
Volatility normalization filter to avoid low-activity periods
Price gap detection inspired by order-block concepts
Supertrend-based directional confirmation
Time-based holding logic before exits are allowed
✨ Features
Rule-based long and short entries
Liquidity & structure breakout detection
Volatility-filtered signal generation
Optional Supertrend trend filter
ATR-based stop-loss and trailing exits
Non-repainting logic after candle close
🧪 How to Use
Apply on liquid markets such as crypto, indices, or forex
Works best on intraday to higher timeframes
Adjust volatility filter and ATR multiplier based on the instrument
Always forward-test and paper-trade before live use
⚠️ Disclaimer
This script is not financial advice.
Trading involves risk, and past performance does not guarantee future results.
Use this strategy for analysis, testing, and educational purposes only.

SMC KZ NYThis script plots vertical lines on the chart to highlight KZ opens and closes based on New York time.
Key characteristics:
The indicator is plotted on the price chart (overlay).
It draws thin, dotted vertical lines at specific kz.
Killzones are calculated using the America/New_York timezone to ensure correct alignment.
Only weekdays (Monday to Friday) are considered.
The script draws sessions for today and up to one week back (maximum 7 calendar days).
All drawings are created once on the last bar to avoid duplicates and performance issues.
Each session has its own color for clear visual distinction:
Asia KZ(open)
London KZ (open and close)
New York / KZ Morning (open and close)
Lunch (open and close)
New York / KZ Afternoon (open and close)
The Asia KZ open at 20:00 NY is intentionally excluded on Fridays, as there is no valid Asia KZ start on Friday evening.
The vertical lines extend across the entire visible price range of the chart.
The script is optimized to stay well within TradingView object limits.
Purpose:
The indicator is designed to give traders a clean, non-intrusive visual reference for key KZ transitions, helping to analyze price behavior around killzones opens and closes without cluttering the chart.

INSTITUTIONAL MOMENTUM [@Ash_TheTrader]⚡ The Impulse Engine: Institutional Velocity & Smart Structure System
Subtitle/Short Description: Stop looking at just Open and Close. Visualize the speed of price action, detect institutional footprints, and trade off dynamic "living" market structure that flips and burns automatically. Developed by @Ash_TheTrader.
The Hidden Dimension of Price Action
Most traders look at a standard candlestick and see four data points: Open, High, Low, and Close.
But this hides the most critical information: The struggle.
Did the buyers step in aggressively in the first 5 minutes, pushing price to highs instantly? (Institutional buying)
Or did it take 59 minutes of slow, grinding effort to reach that high? (Retail exhaustion/Trap)
Standard candles look identical in both scenarios. The Impulse Engine, developed by @Ash_TheTrader, solves this by visualizing the "Speed of Price" (Velocity) directly onto your chart, combined with a state-of-the-art, dynamic market structure system.
It’s not just an indicator; it’s a complete market X-ray.
1. The Velocity Painter: See the Speed ⚡
The core of this system is the Velocity Engine. It looks "inside" your current timeframe bar (using lower timeframe data) to calculate how fast price traveled to its extremes.
It paints the bars based on institutional urgency, allowing you to ignore the noise and focus on the momentum.
The Visual Code:
⚡ NEON CYAN (Bullish Impulse) : Aggressive buying. Price ripped from the open to the high very quickly. This is where the smart money is stepping on the gas.
⚡ NEON MAGENTA (Bearish Impulse): Aggressive selling. Price crashed from the open to the low immediately.
💤 FADED GREY (Exhaustion/Trap): The "grind." Price took a long time to reach its extremes. These are often low-momentum environments or potential traps waiting to reverse.
STANDARD GREEN/RED: Normal market flow with no significant velocity extremes.
"Trade the Neon, Ignore the Grey." — @Ash_TheTrader
2. Smart Structure: "Living" Levels 🏗️
Old-school pivot indicators clutter your chart with endless historical lines that are no longer relevant. The Impulse Engine uses a "Living Structure" algorithm that manages the lifecycle of every support and resistance level.
It only shows you the two most relevant Resistance levels (R1, R2) above price, and the two most relevant Support levels (S1, S2) below price.
Risk-Based Classification:
You choose the structure based on your trading style in the settings:
Scalp Mode: Detects short-term, 5-bar swings. (Thin dotted lines).
Trend Mode: Detects standard trend swings (21-bar). (Dashed lines).
Major Swing: Detects deep, major structural points (60-bar). (Thick solid lines).
The "Flip & Burn" Mechanic (Viral Feature) 🔥
This is where the system gets smart. It understands market mechanics:
The Flip (Role Reversal): If a Resistance level is broken by a candle close, it automatically turns Gold and becomes Support (Flip). The same applies to Support turning into Resistance. You no longer need to guess if an old level will hold from the other side.
The Burn (Auto-Cleaning): If a "Flipped" level is broken again, the system recognizes it has lost its structural integrity. The line is instantly "burned" (removed from the chart).
This ensures your chart only ever shows levels that are active and respected.
3. Whale Signs: The Footprint of Big Money 🐋
Sometimes, velocity isn't enough. You need to see raw power.
The Whale Sign feature detects massive expansions in volatility. It flags any candle whose range is significantly larger (default 2x) than the average of the previous two candles.
💚 Green Triangle + $ (Below Bar): A massive bullish expansion candle. A "Wake Up" call for longs.
❤️ Red Triangle + $ (Above Bar): A massive bearish expansion candle. A warning sign for shorts.
These often precede sustained velocity moves.
4. The Pro HUD (Heads-Up Display) 💻
In the bottom right corner, the dynamic HUD gives you a real-time health check of the current candle.
Status Header: Instantly tells you if the current candle is IMPULSE, EXHAUSTION, or NORMAL.
Live Velocity %: The exact speed score. The text color changes to Neon during impulses and fades to grey during exhaustion.
Mode Info: Reminds you which risk setting you are currently using (e.g., Mode: ).
Signature: The official @Ash_TheTrader stamp of quality.
How to Trade With The Impulse Engine
This system is designed for confluence. Never trade a signal in isolation.
📈 Strategy 1 : The "Velocity Bounce" (Trend Continuation)
Ensure the market is trending (e.g., making higher highs).
Wait for price to pull back to a Smart Support level (Cyan dashed line or Gold "Flip" line).
Trigger: Look for a Neon Cyan Impulse Candle to form right off that support level. This confirms institutions are defending the structure with speed.
📉 Strategy 2: The "Whale Breakout"
Identify a consolidation zone below a Smart Resistance level.
Trigger: A Whale Sign ($) appears on a candle that successfully closes above the Resistance level.
Confirmation: The very next candle should ideally be a Neon Impulse candle continuing the move.
Conclusion
The markets are moved by aggression and speed. By obscuring this data, standard charts put you at a disadvantage.
The Impulse Engine brings this hidden data to the forefront, combining institutional velocity detection with smart, automated market structure that reacts to price just like a professional trader would.
Trade faster, trade smarter.
Developed by @Ash_TheTrader.
(Disclaimer: This tool is for informational purposes only and does not constitute financial advice. Always manage your risk.)

SMC Sessions NYThis script plots vertical session markers on the chart to highlight session opens and closes based on New York time.
Key characteristics:
The indicator is plotted on the price chart (overlay).
It draws thin, dotted vertical lines at specific session times.
Sessions are calculated using the America/New_York timezone to ensure correct alignment.
Only weekdays (Monday to Friday) are considered.
The script draws sessions for today and up to one week back (maximum 7 calendar days).
All drawings are created once on the last bar to avoid duplicates and performance issues.
Each session has its own color for clear visual distinction:
Asia session (open)
London session (open and close)
New York / Kill Zone Morning (open and close)
Lunch session (open and close)
New York / Kill Zone Afternoon (open and close)
The Asia session open at 20:00 NY is intentionally excluded on Fridays, as there is no valid Asia session start on Friday evening.
The vertical lines extend across the entire visible price range of the chart.
The script is optimized to stay well within TradingView object limits.
Purpose:
The indicator is designed to give traders a clean, non-intrusive visual reference for key session transitions, helping to analyze price behavior around session opens and closes without cluttering the chart.
This approach is suitable for intraday and session-based trading models, including SMC-style workflows.

The Physics Engine [@Ash_TheTrader]🏛️ Welcome to the Physics of Finance
By @Ash_TheTrader
Traditional technical analysis often relies on "lagging" indicators. Tools like the RSI or moving averages tell you where price has been. While useful, they are like driving a car looking only in the rearview mirror.
The Kinematic Impulse Engine (KIE) is different. It is designed to be a leading indicator of momentum shifts.
It doesn't just look at price; it treats price action like a physical object moving through space to measure its Velocity (Speed), Acceleration (G-Force), and Mass (Volume). By understanding the physics behind a move, we can determine if a trend is a powerful impulse or an exhausted drift waiting to reverse.
⚛️ The Core Concept: Trading with G-Force
If you step on the gas pedal in a car, you feel pushed back into your seat. That is acceleration (positive G-Force). When you slam on the brakes, you are thrown forward. That is deceleration (negative G-Force).
The market works the same way.
Standard momentum indicators only measure speed. The KIE measures how fast that speed is changing.
The Problem with Standard Indicators: Price can be moving higher (high speed), but the rate at which it is moving higher is slowing down (deceleration). A standard indicator will still look bullish right up until the reversal happens.
The KIE Solution: The KIE detects that deceleration instantly, warning you that the "G-Force" pushing the price up has vanished, often before the price peaks.
🎨 Visual Decoder: Reading the Heatmap
We have eliminated the need to stare at complex oscillator lines below your chart. The KIE paints the candles directly based on their "Kinetic Energy."
1. Neon Cyan : The Impulse (High G-Force) 🚀
Physics State: High Velocity + Positive Acceleration.
Meaning: The market has "pedal to the metal." Buyers are aggressive, and the move is speeding up. This is where you want to be in a trade.
Signal: Look for the small triangles (🚀) marking the start of these impulse moves out of the noise.
2. Deep Purple : Exhaustion (Braking) 🛑
Physics State: High Velocity + Negative Acceleration (Deceleration).
Meaning: The car is still moving forward fast, but the driver has taken their foot off the gas or hit the brakes.
Signal: This is a massive warning sign. If you are long and candles turn purple, the trend is running on fumes. Expect consolidation or a reversal soon.
3. Dark Gray : Equilibrium (Chop) 💤
Physics State: Low Velocity.
Meaning: No significant energy present. The market is chopping sideways.
Signal: Stay out of the market or use range-bound strategies.
⚠️ Unique Feature: Gravity Divergence Detection
This is the most powerful feature of the Kinematic Impulse Engine. It detects when price action is defying the laws of physics.
Imagine throwing a ball into the air. As it reaches the very peak of its arc, it is still moving upward, but gravity is decelerating it rapidly just before it falls back down.
The KIE detects this exact moment in the market:
Gravity Sell Signal: Price makes a new high, but Acceleration (G-Force) crashes rapidly. The market is fighting gravity and will likely snap back.
If you see a "GRAVITY" label pop up on a Deep Purple candle at a high, take notice.
🧠 The Engine Room (Under the Hood)
For the technical traders, here is how @Ash_TheTrader designed the engine:
Relative Velocity: Price changes are normalized against Average True Range (ATR) volatility. A $10 move in Bitcoin is not the same as a $10 move in a penny stock; the KIE adjusts for this automatically.
Mass Integration (Volume Weighting): In physics, Force = Mass x Acceleration. The KIE optionally uses relative Volume as "Mass." A move backed by high volume has more "weight" and is harder to stop than a low-volume move.
The HUD: The on-screen dashboard gives you real-time readings of the current Velocity and raw G-Force metrics, along with an instant trend status summary.
🛡️ How to Use This in Your Trading
The Breakout Trader: Wait for gray candles (chop). Enter when the first Neon Cyan candle appears, ideally accompanied by an Impulse Triangle (🚀). Ride the cyan until it turns purple.
The Reversal Trader: Wait for an extended run of cyan candles. When the candles turn Deep Purple and you see a "GRAVITY" warning label, look for shorting opportunities as the momentum is exhausted.
Trade smart. Trade with physics.
Developed by @Ash_TheTrader

Smart Money Concepts [Kodexius]Smart Money Concepts is a price action framework designed to integrate market structure, liquidity behavior, and inefficiencies into a single, readable view. Rather than acting as a signal generator, it serves as a live market map highlighting where price has displaced, where liquidity may be resting, which zones remain valid, and how that context updates as new candles print.
What separates this script from typical “SMC bundles” is not the presence of familiar concepts like swings, order blocks, FVGs or liquidity sweeps. The value is in the engine design and how the components are maintained together as a consistent state, with automatic pruning and prioritization so the chart stays usable over time. Many tools can draw boxes, but fewer tools manage the lifecycle of those zones, reduce overlap, rank relevance, and keep the display focused on what still matters near current price.
At the core is a structure model that tracks directional state and labels structural transitions as they happen. CHoCH and BoS are not just printed whenever price crosses a line. Each event is anchored to a swing reference and handled in a way that reduces repeated triggers from the same context, helping you see genuine transitions versus minor noise. This gives structure a “narrative” across time instead of a cluttered sequence of identical labels.
Order blocks are built from the most relevant candle within the post break window and displayed as true zones that extend forward while they remain valid. Beyond the zone itself, the script adds context that is usually missing in basic OB implementations: a volumetric pressure visualization and a displacement strength score that is normalized and ranked over a rolling window. In practice, this creates an information hierarchy. You can quickly see which zones carried more participation, whether the internal push was dominated by buying or selling pressure, and whether the move that created the zone had meaningful displacement relative to recent history. This is designed to help prioritization, not to claim prediction.
Imbalances are handled as a dedicated module with multiple detection modes (FVG, VI, OG, IFVG) and optional MTF logic so you can map inefficiencies from a higher timeframe while executing on a lower timeframe. Each imbalance is displayed as a zone with a midline reference, and mitigation behavior can be tuned (wick or close). IFVG adds lifecycle depth by tracking inversion behavior rather than simply deleting the zone, which can be useful for monitoring how price rebalances and flips inefficiencies over time. An optional sentiment style internal fill is available for visual context, but it is intentionally framed as informational rather than a “buy/sell meter.”
Liquidity is treated as an event driven layer. Pivot highs and lows are tracked as potential liquidity pools, then monitored for sweeps and rejection behavior. If you enable EQH/EQL logic, the script can label equal highs and lows during the sweep process to highlight common resting liquidity formations. A volume filter is available to reduce low quality levels, aiming to keep the liquidity map focused on swings that occurred with meaningful participation rather than every small fluctuation.
Swing Failure Patterns (SFP) are included as a separate confirmation style tool that focuses on rejection after liquidity is taken. The module supports optional volume validation using lower timeframe volume distribution outside the swing level, which helps filter some low quality SFPs on noisy instruments. The output is a cleaner set of events intended to complement structure, liquidity and zones, not replace discretionary decision making.
For higher timeframe context, the HTF candle projection panel can display a compact set of higher timeframe candles to the right of current price, with classic or Heikin Ashi style and configurable sizing, spacing and labels. This allows you to maintain HTF awareness without switching charts, which is especially helpful when structure and zones are being interpreted across multiple timeframes.
Finally, the alert framework is designed around well defined structural and zone states. Alerts cover structural shifts (CHoCH, BoS), liquidity sweeps, new and broken order blocks, breaker behavior (if enabled), new and approached imbalances, premium and discount entries, trendline events, and SFP detection. These alerts are intended as monitoring prompts so you can review context, not as automated trade execution signals.
Every major component is modular and configurable. You can run a minimal structure only layout or enable a full framework with zones, imbalances, liquidity, SFP and HTF projection. The guiding principle is chart clarity and relevance: keep the most important information visible, reduce overlap and stale objects, and maintain a consistent view of how price is interacting with liquidity and value over time.
🔹 Features
🔸 Market Structure Engine (CHoCH and BoS)
This script automatically tracks zigzag based market structure and differentiates between:
CHoCH (Change of Character) : the first meaningful structural shift that suggests the prior directional leg is weakening.
BoS (Break of Structure) : continuation breaks that confirm structure extension in the active direction.
Instead of relying on plain pivot dots, our market structure swings are built with a lightweight zigzag style engine that tracks direction and “locks in” the true leg extreme only when the leg flips. This produces cleaner, more consistent swing highs/lows for BOS/CHoCH than simple left/right pivot checks.
Bullish CHoCH:
Bearish CHoCH:
Bullish BoS:
Bearish BoS:
🔸 Order Blocks with Volumetric and Displacement Insight
The script identifies recent bullish and bearish order block zones around meaningful structural reactions and keeps the display focused on the most relevant areas. Instead of drawing a static rectangle and leaving it there forever, each zone is maintained as an active region on the chart and can be limited by a user defined visibility depth to avoid clutter. When enabled, the overlay also adds compact volume based context inside the block so you can quickly compare relative participation between recent zones and see whether the origin move showed strong follow through versus a softer transition. The intention is to provide structured context and cleaner prioritization on the chart, not to present a trade call or a guaranteed reaction level.
Bullish Order Block:
Bearish Order Block:
Order blocks are derived from the structure shifts, marking the institutional “origin zone” behind a decisive move and projecting it forward as a live area of interest. In practice, it highlights the candle cluster where price last rebalanced before expanding away, so you can track potential retests with context instead of guessing.
Inside each order block, the internal bars act as a compact strength meter green vs red summarizes the relative bullish vs bearish participation, while the blue segment reflects the “departure force” (displacement/momentum) away from the zone. It’s meant to help you scan which blocks left clean and strong versus those that moved out more slowly or with mixed pressure.
🔸 Breaker Blocks & Mitigation Tracking
Tracks when previously identified order blocks fail and converts them into breaker blocks, visually marking a change in how price is interacting with that zone.
Bullish Breaker Block :
Bearish Breaker Block :
Separate handling of bullish and bearish breakers with clear color differentiation.
Includes optional “mitigation” logic using either wick or close to determine when a block is considered broken or mitigated.
Breaker blocks are updated and removed dynamically as price trades through them, keeping the chart focused on current, active zones.
🔸 Imbalances
The imbalance module maps common price inefficiencies as zones, with support for multiple detection styles such as Fair Value Gaps, volume style imbalances, opening gaps, and an inverted gap mode. Each imbalance is drawn as a practical area on the chart with a midpoint reference, so you can quickly see where price may be revisiting unbalanced movement. You can also choose how mitigation is evaluated (wick or close) and optionally run imbalance detection on a separate timeframe for cleaner higher timeframe context while staying on your execution chart.
Fair Value Gaps:
Inverse Fair Value Gaps:
Opening Gaps:
🔸 Liquidity Sweeps, EQH/EQL, and Optional Volume Filter
Liquidity levels are derived from swing highs and lows and then monitored for sweep behavior, where price trades beyond a prior level and rejects back. If you enable EQH/EQL marking, the script can highlight equal highs and equal lows behavior around those liquidity areas to make common pool formations easier to spot. An optional volume filter can be used to reduce tracking of low participation swings, helping keep the liquidity layer focused and less noisy on instruments that produce frequent small pivots.
Sellside Liquidity Sweep Definition:
Buyside Liquidity Sweep Definition:
Highlights equal highs (EQH) and equal lows (EQL) when sweeps occur, marking where price probed above/below prior liquidity and then rejected.
Optional volume filter to ignore low volume swings and focus on more meaningful liquidity zones.
🔸 Premium, Discount, and Equilibrium
The premium and discount view provides a simple contextual map of where price is trading within a measured range, alongside an optional equilibrium line as a midpoint reference. This is intended as a higher level framing tool to help you avoid treating every price location the same, especially when combining structure with reaction zones. Price labels can be enabled for quick orientation, and the display updates as the underlying range evolves.
Projects premium and discount bands based on a dynamically measured range, offering a simple view of where price is trading relative to that range.
Draws separate Premium and Discount boxes with optional price labels for quick orientation.
Optional mid line (equilibrium) to visualize the “50%” of the current range, often used as a reference for balanced versus extended price.
Zones auto update as the underlying range evolves, with logic to prevent stale levels from cluttering the chart.
🔸 Trend Channels
When enabled, the trend module draws swing based diagonal structure using trendlines and a channel style visualization. You can tune sensitivity and choose whether the source should be depending on how you prefer to read trend behavior. The channel is maintained dynamically so you can keep directional context without manually drawing and constantly adjusting diagonal lines, and the script can highlight basic break behavior when price pushes beyond the active diagonal reference.
🔸 Swing Failure Pattern (SFP) Detector
The SFP module highlights common swing failure behavior, where price briefly trades beyond a swing level and then reclaims it, often reflecting a liquidity grab followed by rejection. Bullish and bearish SFPs can be enabled independently, and the display is designed to keep the key level and the rejection visible without excessive clutter. Optional volume validation can be used as a filter, so you can choose whether you want the detector to be more permissive or more selective based on participation characteristics.
🔸 HTF Candle Projection Panel
The HTF panel projects a compact set of higher timeframe candles to the right of price, giving you higher timeframe context without switching charts. You can select classic candles or Heikin Ashi style, adjust the scale and spacing, and optionally display reference lines and labels for OHLC values. This is a visual context tool intended to support multi timeframe reading, not a replacement for your own higher timeframe analysis.
In addition to projecting higher timeframe candles, the HTF panel can also detect and visualize higher timeframe liquidity sweeps directly within the projected candle set. The script monitors each completed HTF candle’s high and low and evaluates subsequent HTF candles for sweep behavior i.e., when price briefly trades beyond a prior HTF extreme but fails to hold acceptance beyond it (filtered using the later candle’s body positioning). When a sweep is detected, the panel draws a dotted sweep line and marks the event, allowing you to spot HTF stop runs and failed breaks without switching timeframes. Sweeps are dynamically invalidated if a later HTF candle shows genuine acceptance beyond that level, ensuring the display stays context relevant and avoids stale markings. This turns the HTF projection from a passive visualization into an actionable context layer for identifying HTF liquidity events while executing on lower timeframes.
🔸 Alerts
Alerts are included for the most practical events produced by the overlay, such as structure shifts (CHoCH and BoS), liquidity sweeps, new and invalidated zones, price approaching recent zones, imbalance creation and mitigation, premium or discount entries, trendline events, and SFP detections. The alerts are designed to function as a monitoring layer so you can be notified when something changes in your mapped context, rather than acting as standalone trade instructions.
🔸 Originality & Usefulness
This script is not a collection of separate SMC drawings layered on top of price. It is built as a unified price action engine where market structure, order blocks, inefficiencies, and liquidity are produced from the same evolving state. That matters because most SMC indicators treat these concepts as independent overlays, which often leads to contradictory markings and excessive clutter. Here, the design priority is consistency and readability: modules update in sync, older elements are managed, and the chart stays usable during live conditions.
A key differentiator is the internal swing logic, which functions like a compact zigzag style structure engine. Instead of reacting to every minor fluctuation, it aims to focus on meaningful swing decisions and treat structure as a sequence. This reduces repetitive labeling and makes structural transitions easier to follow. Structure events are anchored to the swing that defined them and are designed to trigger in a clean, non spammy way, which is critical for anyone who uses structure as a workflow backbone.
The structure layer is intentionally narrative oriented. It separates a transition event from continuation events, so CHoCH is used to highlight the first meaningful shift after an established leg, while BoS is used to mark follow through in the same direction. This is not a prediction claim. It is a clarity feature that helps users read “phase changes” versus “continuation” without constantly second guessing whether the script is just printing noise.
Order blocks are where this script becomes especially distinctive compared to typical SMC tools. Instead of drawing identical rectangles, each block is rendered with an internal gauge that communicates participation and directional dominance at a glance. The zone is visually segmented to reflect bullish and bearish pressure components, and it also carries a volume readout plus a relative weight compared to other recent blocks. This creates a ranked view of blocks rather than an unfiltered pile. In practice, you can prioritize zones faster because the script surfaces which blocks had more meaningful participation and whether the internal push looked one sided or mixed. The result is less subjective filtering and a cleaner chart.
Imbalances are handled as structured inefficiency zones with clear references and optional context. Beyond drawing the zone and midpoint, the script can overlay a sentiment style gauge that divides the imbalance into bullish and bearish portions and updates as new data comes in. The practical value is that you can see whether an inefficiency remains strongly one sided or is gradually being balanced. This turns imbalances from static boxes into a living context layer, which is particularly useful when you monitor reactions over time instead of treating every touch the same.
Liquidity is treated as an event driven tracking system rather than simple pivot plotting. Liquidity pools are identified from swing behavior and can be gated through a participation filter so the script focuses on levels that formed with meaningful activity rather than low quality noise. Once tracked, levels are monitored for outcomes like sweeps and equal high/low behavior, and then updated or retired when they are decisively resolved. This prevents the display from accumulating stale levels and keeps the liquidity layer focused on what is still relevant now.
Swing failure patterns are integrated as selective events rather than continuous spam. The intent is to produce fewer but more structurally meaningful SFPs, aligned with the liquidity narrative, instead of printing clusters around the same price area. This keeps the pattern readable and reinforces the “event based” design philosophy across the script.
Higher timeframe context is supported through a compact HTF projection panel that provides quick orientation without forcing constant timeframe switching. It lets you see where current price action sits inside a larger timeframe candle and range, which helps maintain consistency when you are executing on a lower timeframe but respecting higher timeframe structure.
Disclaimer: This indicator is for educational and analytical purposes only. It does not provide financial advice, and it does not guarantee results.
🔹 How to Use
This tool is designed to support multiple trading styles, but it is most effective when you treat it as a top down mapping and decision support tool. A practical workflow looks like this.
1) Establish higher timeframe bias and context
Start on your reference timeframe such as H4 or Daily and read the market’s dominant story first. Use the Market Structure Engine to identify whether the market is in continuation mode or transition mode. The goal is to avoid executing lower timeframe ideas that conflict with the larger structure narrative.
Use the HTF Candle Projection Panel as a fast orientation aid. It helps you judge whether current price is building acceptance near the highs of the larger candle, rotating back toward its open, or rejecting from its extremes. This is especially useful when you execute on lower timeframes but want to stay aligned with higher timeframe positioning.
Add Premium and Discount framing to understand location. When price is trading in premium, continuation longs are often more selective and require stronger confirmation, while shorts may have better location if structure supports it. When price is in discount, the opposite applies. Treat this as location context, not a rule.
2) Map your key reaction zones with prioritization
Next, build your map of where reactions are most likely to occur. Enable Order Blocks with Volumetric Insight to highlight the most relevant origin zones that form after important structure events. Keep your focus on the most recent blocks and adjust the visible depth so the chart stays clean.
Use the internal gauge and participation readouts to prioritize. Instead of treating every zone as equal, treat higher participation blocks as primary candidates and lower participation blocks as secondary. The bullish and bearish split inside the gauge helps you quickly judge whether the zone formed from a clearly one sided push or a more mixed move, which can inform how strict you want to be with confirmation on a retest.
If you use Breaker Blocks, treat them as role shift zones. They are especially useful when the market has clearly transitioned and you want to track where a previously defended origin area may become a meaningful retest level later.
3) Layer in inefficiencies only where they add clarity
If your workflow includes imbalances, add them selectively to avoid visual overload. Use Fair Value Gaps, Volume Imbalances, or Opening Gaps as secondary reaction areas that often sit inside, near, or between larger zones.
If you enable the internal sentiment gauge, read it as context rather than a signal. It is meant to help you see whether the imbalance remains one sided or has started to balance out as price develops. A strongly one sided presentation can support the idea of continuation through the zone, while a more balanced presentation can support the idea of deeper mitigation or chop. Use it to refine expectations, not to force entries.
4) Track liquidity as events, not as static levels
Enable Liquidity Sweeps and EQH/EQL tagging to highlight where resting liquidity is likely concentrated and when it gets taken. The main value here is narrative: you can see when price runs obvious highs or lows and whether it immediately rejects back into structure or accepts beyond the level.
If you use the volume filter, treat it as a quality gate. The point is to ignore small, low participation swings and keep the liquidity layer focused on levels that formed with meaningful activity. This tends to reduce noise and makes sweeps and equal level behavior more relevant.
Combine the liquidity layer with the Swing Failure Pattern detector to isolate moments where liquidity is taken and then rejected. The cleanest use is when SFPs occur at or near your pre mapped reaction zones, after a sweep, and in alignment with your higher timeframe bias.
5) Refine execution timing on your entry timeframe
Drop to your execution timeframe and use local structure shifts as timing tools. CHoCH and BoS on the lower timeframe can help you see when micro structure is flipping in your intended direction after price interacts with your mapped zone.
If you use the Trend Channel framework, treat it as diagonal context rather than strict support and resistance. A channel helps you see where price is riding the trend and where it is deviating. This can help you time entries by waiting for price to re enter the corridor, show rejection near a boundary, or confirm a shift by building structure outside the channel.
A common practical sequence is: price reaches a mapped OB or imbalance area, liquidity gets taken, price rejects, micro structure begins to flip, and then you execute with your own confirmation and risk rules. The tool helps you see each step clearly, but your plan determines what is sufficient confirmation.
6) Use alerts as monitoring, not as standalone signals
Set alerts only for events that are meaningful to your workflow, such as:
-fresh CHoCH or BoS in your preferred direction
-new or invalidated order blocks and breaker blocks
-price approaching the most recent priority zones
-liquidity sweeps and EQH/EQL interactions
-new SFP events
-entry into premium or discount and interaction with HTF projection levels
-imbalance creation, mitigation, or approach
Treat alerts as prompts to check the chart, not as automatic entries or exits. This script is designed as a mapping and decision support tool. Trade execution, confirmation, and risk management remain entirely dependent on your own strategy and discretion.
🔴 Price Action Practical Notes
💠 Market structure
Market structure is the framework used to describe how price organizes itself into swings. It is built from successive swing highs and swing lows, and it is used to decide whether the market is expanding upward, expanding downward, or transitioning. A practical structure model focuses on “meaningful” turning points rather than every minor fluctuation, because the goal is to capture intent and flow, not noise.
💠 Swing highs and swing lows
A swing high is a local peak where price stops advancing and begins to rotate lower, while a swing low is a local trough where selling pressure pauses and price rotates higher. Swings matter because many traders anchor risk, liquidity, and entries around them. The stronger the reaction away from a swing, the more likely it is to be referenced again as a decision point.
💠 Break of structure
A break of structure is the event where price decisively exceeds a prior swing in the direction of the prevailing move. In practice, it is used as confirmation that a directional leg is still active and that liquidity resting beyond the swing has been taken. This concept is less about predicting and more about validating continuation.
💠 Change of character
A change of character is a structural break that signals transition rather than continuation. Instead of breaking a swing in the same direction as the recent trend, price breaks a key swing in the opposite direction, suggesting that control may be shifting. It is often treated as an early warning that the market may be moving from continuation into reversal or deeper pullback conditions.
💠 Order blocks
An order block is commonly described as the last opposing candle or consolidation zone that precedes a strong directional expansion. The idea is that this area represents a footprint of aggressive execution and unfilled interest. When price revisits it later, it can act as a reaction zone because participants who missed the move may defend it, or because remaining orders may still exist there.
💠 Mitigation and invalidation of a zone
Mitigation describes the process of price returning to a zone and “consuming” the remaining interest there. A zone is typically considered invalidated when price trades through it in a way that implies the resting orders were absorbed and the area no longer has protective value. Some approaches treat a wick through the boundary as enough to invalidate, while others require a candle close beyond the boundary to confirm that the level has truly failed.
💠 Breaker blocks
A breaker block is an order block concept that changes role after being invalidated. When a previously respected zone fails, it can later become a reaction area in the opposite direction because trapped participants may use the retest to exit, or because the market may recognize it as a new supply or demand reference. Breakers are often treated as “failed zones that become liquidity magnets” and are closely watched on retests.
💠 Liquidity and liquidity pools
Liquidity is the availability of resting orders that allow large transactions to execute with minimal slippage. In chart terms, liquidity pools often form around obvious swing highs and lows, equal highs and lows, and clear ranges. These areas attract price because they contain clustered stops and entries that can be used to fuel continuation or trigger reversals through rapid order flow shifts.
💠 Liquidity sweeps
A liquidity sweep is a move where price briefly trades beyond a known liquidity pool and then returns back inside, often closing back within the prior range. The concept implies that stops were triggered and liquidity was captured, but that continuation beyond the swept level did not sustain. Sweeps are frequently used as context for reversals or for confirming that a “cleanout” occurred before a directional move.
💠 Equal highs and equal lows
Equal highs and equal lows describe repeated swing levels that form a flat or nearly flat top or bottom. They matter because they concentrate liquidity. Many traders place stops just beyond these repeated levels, and many breakout traders place entries around them. The result is a dense cluster of orders that can be targeted efficiently by price.
💠Imbalances and inefficiencies
Imbalances represent zones where price moved so quickly that it left behind inefficient trading, meaning fewer transactions occurred in that region compared to surrounding areas. The underlying idea is that markets often revisit these areas to rebalance, fill gaps, or complete unfinished business. Imbalances are treated as areas of interest for pullback entries, targets, or reaction zones.
💠 Fair value gap
A fair value gap is a specific form of imbalance commonly framed as a three candle displacement that leaves a gap between candles, indicating rapid repricing. Traders use it as a proxy for inefficiency: if price returns, it may partially or fully fill the gap before continuing. The midpoint of the gap is often treated as a particularly relevant reference, but whether price respects it depends on context.
💠 Inverted fair value gap
An inverted fair value gap is the idea that once an imbalance is “broken” in a meaningful way, the zone can flip its behavior. Instead of acting like a supportive zone, it may become resistive (or vice versa) on a later retest. Conceptually, this is similar to role reversal: what once behaved as a continuation aid can become a rejection zone after failure.
💠 Premium, discount, and equilibrium
Premium and discount describe where price sits relative to a defined recent range. Premium is the upper portion of that range and discount is the lower portion. Equilibrium is the midpoint. The concept is mainly used to align trade direction with location: buying is generally more attractive in discount and selling is generally more attractive in premium, assuming you are trading mean reversion within a range or seeking favorable risk placement within a broader trend.
💠 Swing failure pattern
A swing failure pattern is a reversal archetype where price breaks a known swing level, fails to hold beyond it, and returns back through the level. The logic is that the breakout attempt attracted orders and triggered stops, but the market rejected the extension. SFPs are often considered higher quality when the failure is followed by a decisive move away and when it aligns with a broader liquidity narrative.
💠 Higher timeframe context
Higher timeframe context means framing intraday or lower timeframe signals within the structure of a larger timeframe. This can include aligning trades with higher timeframe swings, using higher timeframe candles as reference for open/high/low behavior, and avoiding taking counter trend signals when the larger timeframe is strongly directional. The purpose is to improve signal quality by ensuring the smaller timeframe idea is not fighting a dominant larger flow.
💠 Trend channels
A trend channel is a structured way to visualize a market’s directional “lane” by framing price between two roughly parallel boundaries. The central idea is that trending price action often oscillates in a repeatable corridor: pullbacks tend to stall around one side of the lane, while impulses tend to extend toward the opposite side. Instead of treating trend as a single line, a channel treats trend as an area, which better reflects real market behavior where reactions occur in zones rather than at perfect prices.
A channel typically has three functional references: a guiding line that represents the prevailing slope, an upper boundary that approximates where bullish expansions tend to stretch before mean reversion, and a lower boundary that approximates where bearish pullbacks tend to terminate before continuation. The space between boundaries represents the market’s accepted path. When price stays inside this corridor, the trend is considered healthy. When price repeatedly fails to progress within it, the trend is weakening.
Channels are commonly used for timing and location. In an uptrend channel, pullbacks into the lower portion of the corridor are often treated as higher quality “location” for continuation attempts, while pushes into the upper portion are treated as extension territory where risk of a pause or retracement increases. In a downtrend channel, the logic is mirrored: rallies into the upper portion are often treated as sell side location, and moves into the lower portion are treated as extension territory. The channel does not predict direction by itself; it provides a disciplined map for where continuation is more likely versus where momentum is more likely to cool.
A key concept is acceptance versus deviation. If price briefly pierces a boundary and snaps back inside, that is often interpreted as a deviation, meaning the market tested outside the lane but did not accept it. If price holds outside the corridor and begins to build new swings there, that suggests acceptance and a potential regime change: either a new channel with a different slope, a shift into range, or a broader reversal context. This is why channels are most useful when you treat them as a framework for evaluating behavior, not as rigid support and resistance.

ForzAguanno - Premium / Discount (Range Glissant)Premium / Discount Zones – Dynamic Range (Fibo-based)
This indicator highlights Premium, Discount, and Equilibrium zones using a dynamic Fibonacci range calculated from recent price action.
It is designed to help traders contextualize price and avoid taking trades in unfavorable locations (e.g. buying too high or selling too low).
- How it works
The indicator automatically:
- Detects the highest high (HH) and lowest low (LL) over a rolling range
- Builds a Fibonacci-style structure between LL → HH
- Defines three key areas:
Discount Zone (lower part of the range)
Equilibrium Zone (around the 50% level)
Premium Zone (upper part of the range)
Two additional extreme levels are used:
0.075 → deep discount
0.925 → deep premium
These levels help isolate areas where price is statistically stretched.
- Visual elements
- Horizontal levels:
- Green → Discount
- Purple → Equilibrium
- Red → Premium
- Text labels are placed inside each zone for instant readability.
Zones are extended into the future for cleaner visualization.
- How to use it
This tool is best used as a context filter, not a standalone signal generator.
Typical use cases:
Look for longs in Discount
Look for shorts in Premium
Use Equilibrium as a neutral / decision zone
Combine with structure, momentum, or entry models
It works particularly well with:
Market structure concepts
Smart money / range-based trading
Session-based strategies
⚠️ Important notes
This indicator does not predict direction
It provides context, not signals
Always combine with proper risk management
Final thoughts
The goal of this indicator is simplicity and clarity:
Know where price is located inside its range before taking a trade.
If you find it useful, feel free to share feedback.

Market Structure Pivots with BOS & CHoCH [zazenio]What is Market Structure?
Market structure is simply the pattern of highs and lows that price creates as it moves. When you look at any chart, you'll notice price doesn't move in a straight line — it swings up, pulls back, swings up again (in an uptrend), or the opposite in a downtrend.
These swing points — the peaks and valleys — are what traders call pivots . Identifying them correctly is the foundation of understanding where a market has been and where it might go next.
What This Indicator Does
Swing Pivots automatically marks these peaks and valleys on your chart so you don't have to draw them manually. It works on any market — stocks, crypto, forex, futures, indices — and on any timeframe.
Beyond just marking pivots, this indicator also draws BOS (Break of Structure) and CHoCH (Change of Character) lines — two essential concepts that help you understand when a trend is continuing or potentially reversing.
How Pivots Are Detected
This indicator confirms pivots based on price structure, not a fixed bar count.
Here's how it works:
A swing high is confirmed when price breaks below the previous swing low. At that moment, we know the high was real — price tried to go higher, failed, and reversed. The market "proved" that level was a genuine turning point.
A swing low is confirmed when price breaks above the previous swing high. The same logic applies — price tried to go lower, failed, and reversed direction.
This creates a natural alternation: high, low, high, low. Each pivot is validated by the market's actual behavior, not by waiting for an arbitrary number of bars to pass.
Understanding BOS and CHoCH
Once you can identify pivots, the next step is understanding what happens when price breaks through them. This is where BOS and CHoCH come in.
BOS (Break of Structure)
A Break of Structure occurs when price continues in the direction of the current trend by breaking a previous pivot level.
In an uptrend : Price breaks above a previous swing high → This signals strength. Buyers are pushing price to new highs, and the trend is likely to continue.
In a downtrend : Price breaks below a previous swing low → This signals weakness. Sellers are pushing price to new lows, and the trend is likely to continue.
Think of BOS as the market saying "the trend is still intact." Each BOS confirms that the dominant side (buyers or sellers) remains in control.
CHoCH (Change of Character)
A Change of Character occurs when price breaks a pivot level in the opposite direction of the current trend. This is an early warning signal that the trend may be reversing.
In an uptrend : Price breaks below a previous swing low → This is unexpected. In a healthy uptrend, lows should hold. When they don't, it suggests buyers are losing control and sellers may be taking over.
In a downtrend : Price breaks above a previous swing high → This is unexpected. In a healthy downtrend, highs should hold. When they don't, it suggests sellers are losing control and buyers may be stepping in.
Think of CHoCH as the market's behavior "changing character" — it's no longer acting the way it should if the trend were healthy.
Why BOS and CHoCH Matter
These concepts give you a framework for reading what the market is actually doing:
BOS tells you the trend is continuing — stay with it or look for entries in that direction
CHoCH warns you the trend may be ending — time to be cautious, take profits, or look for trades in the new direction
By visualizing these breaks directly on your chart, you don't have to guess. You can see at a glance whether the market is trending smoothly (consecutive BOS) or showing signs of reversal (CHoCH).
Why This Approach Works
Most pivot indicators use a "lookback" method — they wait for a certain number of bars (say, 5 or 10) on each side of a candle before confirming it as a pivot. This creates a fixed delay. By the time the pivot appears on your chart, price has already moved on.
This indicator doesn't wait. It confirms pivots the moment price structure proves them. The result is pivots that align with how traders actually read charts — based on breaks of structure, not arbitrary countdowns.
Settings
Configuration
Swing Width : Controls how sensitive the detection is. Higher numbers show only major swings; lower numbers capture smaller moves within the structure.
Pivot Settings
High/Low Color : Customize the colors of swing high and swing low markers
Style : Choose between Triangle or Circle markers
Size : Adjust the size of pivot markers (Auto, Tiny, Small, Normal)
Structure Lines
Show CHoCH : Toggle Change of Character lines on/off
CHoCH Color : Customize the color of CHoCH lines
CHoCH Label : Show/hide the "CHoCH" text label
Show BOS : Toggle Break of Structure lines on/off
BOS Color : Customize the color of BOS lines
BOS Label : Show/hide the "BOS" text label
Use Cases
See the "skeleton" of price action at a glance
Identify potential support and resistance levels
Understand if the market is trending or ranging
Spot trend continuations with BOS lines
Catch early reversal signals with CHoCH lines
Build a foundation for more advanced trading strategies
━━━━━━━━━━━━━━━━━━━━━━
Version History
v1.1
Added BOS (Break of Structure) lines to visualize trend continuation
Added CHoCH (Change of Character) lines to identify potential trend reversals
Added toggle options for BOS and CHoCH visibility
Added customizable colors for structure lines
Added optional labels for BOS and CHoCH
v1.0
Initial release
Automatic swing high and swing low detection
Structure-based pivot confirmation (not fixed lookback)
Customizable pivot markers (style, size, colors)
Adjustable swing width sensitivity
━━━━━━━━━━━━━━━━━━━━━━
Disclaimer:
This script is provided for educational and informational purposes only. It is not financial advice and does not constitute a recommendation to buy or sell any financial instrument. Always do your own research and trade at your own risk.

Swing Pivots - Market Structure High Low [zazenio]What is Market Structure?
Market structure is simply the pattern of highs and lows that price creates as it moves. When you look at any chart, you'll notice price doesn't move in a straight line — it swings up, pulls back, swings up again (in an uptrend), or the opposite in a downtrend.
These swing points — the peaks and valleys — are what traders call pivots. Identifying them correctly is the foundation of understanding where a market has been and where it might go next.
What This Indicator Does
Swing Pivots automatically marks these peaks and valleys on your chart so you don't have to draw them manually. It works on any market — stocks, crypto, forex, futures, indices — and on any timeframe.
How Pivots Are Detected
This indicator confirms pivots based on price structure, not a fixed bar count.
Here's how it works:
A swing high is confirmed when price breaks below the previous swing low. At that moment, we know the high was real — price tried to go higher, failed, and reversed. The market "proved" that level was a genuine turning point.
A swing low is confirmed when price breaks above the previous swing high. The same logic applies — price tried to go lower, failed, and reversed direction.
This creates a natural alternation: high, low, high, low. Each pivot is validated by the market's actual behavior, not by waiting for an arbitrary number of bars to pass.
Why This Matters
Most pivot indicators use a "lookback" method — they wait for a certain number of bars (say, 5 or 10) on each side of a candle before confirming it as a pivot. This creates a fixed delay. By the time the pivot appears on your chart, price has already moved on.
This indicator doesn't wait. It confirms pivots the moment price structure proves them. The result is pivots that align with how traders actually read charts — based on breaks of structure, not arbitrary countdowns.
Settings
Swing Width: Controls how sensitive the detection is. Higher numbers show only major swings; lower numbers capture smaller moves within the structure.
Style/Size/Colors: Customize how the pivot markers look on your chart.
Use Cases
See the "skeleton" of price action at a glance
Identify potential support and resistance levels
Understand if the market is trending or ranging
Build a foundation for more advanced concepts like Break of Structure (BOS) and Change of Character (CHoCH)
⸻
Disclaimer:
This script is provided for educational and informational purposes only. It is not financial advice and does not constitute a recommendation to buy or sell any financial instrument. Always do your own research and trade at your own risk.

SMC Pro [Stansbooth]
🔮 SMC × Fibonacci Confluence Engine — The Hidden Algorithm of the Markets
Welcome to a level of chart analysis where mathematics , market psychology , and institutional logic merge into one ultra-intelligent system.
This indicator decodes the true structure of price delivery by combining Smart Money Concepts with the timeless precision of Fibonacci ratios , revealing what retail traders can’t see — *the algorithmic heartbeat of the market*.
✨ What Makes This Indicator Different
Instead of drawing random lines or reacting to late signals, this tool **anticipates** market behavior by reading the footprints left behind by institutional algorithms. Every element is placed with purpose — every zone, every shift, every fib level — all forming a seamless narrative that explains *why* price moves the way it does.
🔥 Core Intelligence Features
Advanced BOS/CHOCH Auto-Detection — Spot structure shifts before momentum even forms.
Institutional Liquidity Mapping
— Identify liquidity pools, engineered sweeps, equal highs/lows, and trap zones designed by smart money.
Fibonacci-Aligned Precision Zones
— Auto-generated fib grids synced with SMC levels for pinpoint reversal and continuation setups.
Imbalance Engine
— FVGs, displacement, inefficiencies, and mitigation blocks displayed with crystal clarity.
Premium/Discount Algorithm
— Understand instantly whether price is in a zone of accumulation or distribution.
🚀 Designed for Traders Who Want an Edge
Whether you're scalping fast moves, capturing intraday swings, or holding higher-timeframe plays, this indicator provides a professional lens into the market. It turns complex price action into a structured, predictable system where every move has logic and every entry has confluence.
You don’t just see the chart —
you see the intention behind every push, pull, manipulation, and reversal.
💎 Why It Feels Like a Cheat Code
Because it mirrors the way institutions analyze the market:
— Identify liquidity
— Seek equilibrium
— Deliver price
— Create inefficiency
— Mitigate
— Continue the narrative
Using SMC and Fibonacci together unlocks the “algorithmic geometry” behind price movement, giving you clarity where others see chaos.
⚡ Trade With Confidence, Confluence & Control
This indicator isn’t just a tool.
It’s a complete trading framework — structured, intelligent, and deadly accurate.
Master the markets.
Decode the algorithm.
Trade like smart money .

SMC-Math by Thomas v1📌 SMC-Math by Thomas v1 — Description
SMC-Math by Thomas v1 is a complete Smart Money Concepts toolkit designed for traders who want a clean, mathematical, and structured view of market mechanics.
Rather than relying on abstract concepts or subjective drawings, this indicator focuses on rules-based detection of:
✔ Order Blocks (OB)
✔ Fair Value Gaps (FVG)
✔ Market Structure shifts (BoS / CHoCH)
✔ HTF trend confirmation
✔ Premium / Discount arrays
✔ Equal High & Equal Low Liquidity Zones (no hinting — expiry only)
This version is engineered for stability, clarity, and performance — with fully optimized array management, timestamp-based cleanup, and a clean visual presentation suitable for both discretionary and systematic trading.
📌 Key Features
🔹 1. Order Blocks (Bullish & Bearish)
Auto-detected using fractal swing highs/lows
Optional displacement + high volume filters
Midline display option
HTF trend alignment filter
Smart expiry + broken OB cleanup
Custom opacity, buffer, and extension controls
🔹 2. Fair Value Gaps (FVG)
Bullish and bearish gap detection
HTF confirmation-based dimming
No border for a clean ICT-style visuals
Auto remove when filled
Fully rule-based
🔹 3. Market Structure (BoS / CHoCH)
Based on fractal highs/lows
Automatic labeling (small, unobtrusive)
Direction validated by HTF option
Each structure level plotted with a projected line
Smooth, clean BOS/CHOCH flow
🔹 4. Premium / Discount Zones
Auto-calculated from most recent swing high & swing low
Box shading dynamically updates each bar
Helps identify optimal trade areas (OB → FVG → PD array)
🔹 5. Liquidity Zones (Equal Highs & Equal Lows)
This tool highlights where liquidity is likely resting:
Detects Equal Highs and Equal Lows using your tolerance or max difference
Auto-creates borderless shaded boxes
Adjustable box height and extension
NO hinting logic — the box remains for exactly cleanupDelay bars, then expires
Clean and predictable behavior, ideal for rule-based setups
This is especially useful for:
identifying buy-side and sell-side liquidity pools
anticipating runs on liquidity
targeting sweeps
🔹 6. HTF Status Panel
Shows higher-timeframe trend status on the live bar:
Bullish
Bearish
Or “HTF Not Required”
Useful for aligning entries with larger market flow.
📌 How to Use SMC-Math by Thomas v1
1️⃣ Identifying Direction
Start by reading:
HTF Trend Label
BOS & CHOCH reactions
Bullish: look for HL → HH structure + bullish OBs + bullish FVGs
Bearish: look for LH → LL structure + bearish OBs + bearish FVGs
This creates your directional bias.
2️⃣ Using Order Blocks
An OB is valid when:
It appears in line with structure
HTF alignment supports it (optional toggle)
Price returns after a displacement
OB is not “broken” (indicator handles this visually)
Use OBs as:
Rebalance targets
Entry areas
Stop placement logic
3️⃣ Fair Value Gaps
FVGs appear when price dislocates and leaves inefficiency.
Use them to:
Refine entries inside OBs
Project premium/discount zones
Identify continuation zones
The indicator auto-removes FVGs when filled.
4️⃣ Liquidity Zones
Liquidity zones identify resting orders at equal highs/lows.
This version uses simple expiry logic:
Box is created when EQH/EQL forms
It remains visible for 20 bars (default)
It disappears automatically after expiry
No hint/confirmation triggers deletion
Usage tips:
Expect price to run toward these zones
Use them as targets or continuation markers
Combine with OB/FVG for confluence
5️⃣ Premium / Discount Zones
Use PD arrays to gauge:
Premium = optimal shorting zones
Discount = optimal long zones
Not trade “in the middle” unless a clear BOS or CHoCH happens
📌 Recommended Workflow
HTF Bias → Check the HTF panel
Market Structure → Identify trend continuation or reversal
Liquidity → Mark where price is likely to target
FVG → Identify imbalance zones
OB → Confirm institutional origin points
PD Arrays → Determine optimal trade location
Execute with confluence
📌 Who Is This Indicator For?
✔ Traders using ICT / SMC logic
✔ Traders wanting rule-based, non-subjective markups
✔ Traders who want automated detection without repainting
✔ Anyone who uses OB, FVG, liquidity sweeps, and structure shifts

Fair Value Gap Signals [Kodexius]Fair Value Gap Signals is an advanced market structure tool that automatically detects and tracks Fair Value Gaps (FVGs), evaluates the quality of each gap, and highlights high value reaction zones with visual metrics and signal markers.
The script is designed for traders who focus on liquidity concepts, order flow and mean reversion. It goes beyond basic FVG plotting by continuously monitoring how price interacts with each gap and by quantifying three key aspects of each zone:
-Entry velocity inside the gap
-Volume absorption during tests
-Structural integrity and depth of penetration
The result is a dynamic, information rich visualization of which gaps are being respected, which are being absorbed, and where potential reversals or continuations are most likely to occur.
All visual elements are configurable, including the maximum number of visible gaps per direction, mitigation method (close or wick) and an ATR based filter to ignore insignificant gaps in low volatility environments.
🔹 Features
🔸 Automated Fair Value Gap Detection
The script detects both bullish and bearish FVGs based on classic three candle logic:
Bullish FVG: current low is strictly above the high from two bars ago
Bearish FVG: current high is strictly below the low from two bars ago
🔸 ATR Based Gap Filter
To avoid clutter and low quality signals, the script can ignore very small gaps using an ATR based filter.
🔸Per Gap State Machine and Lifecycle
Each gap is tracked with an internal status:
Fresh: gap has just formed and has not been tested
Testing: price is currently trading inside the gap
Tested: gap was tested and left, waiting for a potential new test
Rejected: price entered the gap and then rejected away from it
Filled: gap is considered fully mitigated and no longer active
This state machine allows the script to distinguish between simple touches, multiple tests and meaningful reversals, and to trigger different alerts accordingly.
🔸 Visual Ranking of Gaps by Metrics
For each active gap, three additional horizontal rank bars are drawn on top of the gap area:
Rank 1 (Vel): maximum entry velocity inside the gap
Rank 2 (Vol): relative test volume compared to average volume
Rank 3 (Dpt): remaining safety of the gap based on maximum penetration depth
These rank bars extend horizontally from the creation bar, and their length is a visual score between 0 and 1, scaled to the age of the gap. Longer bars represent stronger or more favorable conditions.
🔸Signals and Rejection Markers
When a gap shows signs of rejection (price enters the gap and then closes away from it with sufficient activity), the script can print a signal label at the reaction point. These markers summarize the internal metrics of the gap using a tooltip:
-Velocity percentage
-Volume percentage
-Safety score
-Number of tests
🔸 Flexible Mitigation Logic (Close or Wick)
You can choose how mitigation is defined via the Mitigation Method input:
Close: the gap is considered filled only when the closing price crosses the gap boundary
Wick: a full fill is detected as soon as any wick crosses the gap boundary
🔸 Alert Conditions
-New FVG formed
-Price entering a gap (testing)
-Gap fully filled and invalidated
-Rejection signal generated
🔹Calculations
This section summarizes the main calculations used under the hood. Only the core logic is covered.
1. ATR Filter and Gap Size
The script uses a configurable ATR length to filter out small gaps. First the ATR is computed:
float atrVal = ta.atr(atrLength)
Gap size for both directions is then measured:
float gapSizeBull = low - high
float gapSizeBear = low - high
If useAtrFilter is enabled, gaps smaller than atrVal are ignored. This ties the minimum gap size to the current volatility regime.
2. Fair Value Gap Detection
The basic FVG conditions use a three bar structure:
bool fvgBull = low > high
bool fvgBear = high < low
For bullish gaps the script stores:
-top as low of the current bar
-bottom as high
For bearish gaps:
-top as high of the current bar
-bottom as low
This defines the price range that is considered the imbalance area.
3. Depth and Safety Score
Depth measures how far price has penetrated into the gap since its creation. For each bar, the script computes a currentDepth and updates the maximum depth:
float currentDepth = 0.0
if g.isBullish
if l < g.top
currentDepth := g.top - l
else
if h > g.bottom
currentDepth := h - g.bottom
if currentDepth > g.maxDepth
g.maxDepth := currentDepth
The safety score expresses how much of the gap remains intact:
float depthRatio = g.maxDepth / gapSize
float safetyScore = math.max(0.0, 1.0 - depthRatio)
safetyScore near 1: gap is mostly untouched
safetyScore near 0: gap is mostly or fully filled
4. Velocity Metric
Velocity captures how aggressively price moves inside the gap. It is based on the body to range ratio of each bar that trades within the gap and rewards bars that move in the same direction as the gap:
float barRange = h - l
float bodyRatio = math.abs(close - open) / barRange
float directionBonus = 0.0
if g.isBullish and close > open
directionBonus := 0.2
else if not g.isBullish and close < open
directionBonus := 0.2
float currentVelocity = math.min(bodyRatio + directionBonus, 1.0)
The gap keeps track of the strongest observed value:
if currentVelocity > g.maxVelocity
g.maxVelocity := currentVelocity
This maximum is later used as velScore when building the velocity rank bar.
5. Volume Accumulation and Volume Score
While price is trading inside a gap, the script accumulates the traded volume:
if isInside
g.testVolume += volume
It also keeps track of the number of tests and the volume at the start of the first test:
if g.status == "Fresh"
g.status := "Testing"
g.testCount := 1
g.testStartVolume := volume
An average volume is computed using a 20 period SMA:
float volAvg = ta.sma(volume, 20)
The expected volume is approximated as:
float expectedVol = volAvg * math.max(1, (bar_index - g.index) / 2)
The volume score is then:
float volScore = math.min(g.testVolume / expectedVol, 1.0)
This produces a normalized 0 to 1 metric that shows whether the gap has attracted more or less volume than expected over its lifetime.
6. Rank Bar Scaling
All three scores are projected visually along the time axis as horizontal bars. The script uses the age of the gap in bars as the maximum width:
float maxWidth = math.max(bar_index - g.index, 1)
Then each metric is mapped to a bar length:
int len1 = int(math.max(1, maxWidth * velScore))
g.rankBox1.set_right(g.index + len1)
int len2 = int(math.max(1, maxWidth * volScore))
g.rankBox2.set_right(g.index + len2)
int len3 = int(math.max(1, maxWidth * safetyScore))
g.rankBox3.set_right(g.index + len3)
This creates an intuitive visual representation where stronger metrics produce longer rank bars, making it easy to quickly compare the relative quality of multiple FVGs on the chart.

IDLP – Intraday Daily Levels Pro [FXSMARTLAB]🔥 IDLP – Intraday Daily Levels Pro
IDLP – Intraday Daily Levels Pro is a precision toolkit for intraday traders who rely on objective daily structure instead of repainting indicators and noisy signals.
Every level plotted by IDLP is derived from one simple rule:
Today’s trading decisions must be based on completed market data only.
That means:
✅ No use of the current day’s unfinished data for levels
✅ No lookahead
✅ No hidden repaint behavior
IDLP reconstructs the previous trading day from the intraday chart and then projects that structure forward onto the current session, giving you a stable, institutional-style intraday map.
🧱 1. Previous Daily Levels (Core Structure)
IDLP extracts and displays the full previous daily structure, which you can toggle on/off individually via the inputs:
Previous Daily High (PDH)
Previous Daily Low (PDL)
Previous Daily Open
Previous Daily Close,
Previous Daily Mid (50% of the range)
Previous Daily Q1 (25% of the range)
Previous Daily Q3 (75% of the range)
All of these come from the day that just closed and are then locked for the entire current session.
What these levels tell you:
PDH / PDL – true extremes of yesterday’s price action (liquidity zones, breakout/reversal points).
Previous Daily Open / Close – how the market positioned itself between session start and end
Mid (50%) – equilibrium level of the previous day’s auction.
Q1 / Q3 (25% / 75%) internal structure of the previous day’s range, dividing it into four equal zones and helping you see if price is trading in the lower, middle, or upper quarter of yesterday’s range.
All these levels are non-repaint: once the day is completed, they are fixed and never change when you scroll, replay, or backtest.
🎯 2. Previous Day Pivot System (P, S1, S2, R1, R2)
IDLP includes a classic floor-trader pivot grid, but critically:
It is calculated only from the previous day’s high, low, and close.
So for the current session, the following are fixed:
Pivot P – central reference level of the previous day.
Support 1 (S1) and Support 2 (S2)
Resistance 1 (R1) and Resistance 2 (R2)
These levels are widely used by institutional desks and algos to structure:
mean-reversion plays, breakout zones, intraday targets, and risk placement.
Everything in this section is non-repaint because it only uses the previous day’s fully closed OHLC.
📏 3. 1-Day ADR Bands Around Previous Daily Open
Instead of a multi-day ADR, IDLP uses a pure 1-Day ADR logic:
ADR = Range of the previous day
ADR = PDH − PDL
From that, IDLP builds two clean bands centered around the previous daily Open:
ADR Upper Band = Previous Day Open + (ADR × Multiplier)
ADR Lower Band = Previous Day Open − (ADR × Multiplier)
The multiplier is user-controlled in the inputs:
ADR Multiplier (default: 0.8)
This lets you choose how “tight” or “wide” you want the ADR envelope to be around the previous day’s open.
Typical use cases:
Identify realistic intraday extension targets, Spot exhaustion moves beyond ADR bands, Frame reversals after reaching volatility extremes, Align trades with or against volatility expansion
Again, since ADR is calculated only from the completed previous day, these bands are totally non-repaint during the current session.
🔒 4. True Non-Repaint Architecture
The internal logic of IDLP is built to guarantee non-repaint behavior:
It reconstructs each day using time("D") and tracks:
dayOpen, dayHigh, dayLow, dayClose for the current day
prevDayOpen, prevDayHigh, prevDayLow, prevDayClose for the previous day
At the moment a new day starts:
The “current day” gets “frozen” into prevDay*
These prevDay* values then drive: Previous Daily Levels, Pivots, ADR.
During the current day:
All these “previous day” values stay fixed, no matter what happens.
They do not move in real time, they do not shift in replay.
This means:
What you see in the past is exactly what you would have seen live.
No fake backtests.
No illusion of perfection from repainting behavior.
🎯 5. Designed For Intraday Traders
IDLP – Intraday Daily Levels Pro is made for:
- Day traders and scalpers
- Index and FX traders
- Prop firm challenge trading
- Traders using ICT/SMC-style levels, liquidity, and range logic
- Anyone who wants a clean, institutional-style daily framework without noise
You get:
Previous Day OHLC
Mid / Q1 / Q3 of the previous range
Previous-Day Pivots (P, S1, S2, R1, R2)
1-Day ADR Bands around Previous Day Open
All calculated only from closed data, updated once per day, and then locked.

SMC Pro: Real-Time Final**Description:**
This comprehensive SMC indicator is designed to automatically visualize major **Trading Sessions** and **Killzones**, alongside Fair Value Gaps (FVG). It helps traders identify high-probability setups by correlating time and price, specifically during key market hours (London, New York, Asia).
**Key Features:**
1. **Trading Sessions & Killzones:** The indicator clearly highlights the open and duration of major sessions (Asia, London, New York), allowing traders to spot volatility injections and "Judas Swings."
2. **Automated FVG Detection:** Scans price action to locate valid Fair Value Gaps and Imbalances within these sessions.
3. **Entry Logic:** Marks potential entry zones at the 50% retracement level of the identified FVG.
4. **Risk Management:** Projects a fixed Risk-to-Reward ratio (e.g., 1:3) with automatic Stop Loss and Take Profit levels.
5. **Clean Visualization:** Color-coded boxes for sessions and gaps keep the chart organized.
**How to Use:**
* **Time Analysis:** Watch for price action as the London or NY session opens (highlighted by the indicator).
* **Signal:** Wait for an Imbalance/FVG to form during these high-volume times.
* **Entry:** Set a limit order at the 50% mark of the gap.
* **Exit:** Use the projected TP levels.
**Disclaimer:**
This tool is for educational purposes and technical analysis assistance only. Past performance does not guarantee future results.
