PT2_Stochastic RSI / MACDThis indicator is designed for use with Profit Trailer version 2 and plots the values of RSI, Stochastic, StochasticRSI and MACD.
Due to the decimal values that they all produce, There are some important things to understand before using this indicator.
In PT2, RSI and Stochastic require values between 0 and 100, but StochasticRSI requires values between 0.00 and 1.00. Because of this the following needs to be understood.
RSI:
----
The buy and sell values and limits are inputted as values between 0 and 100, but they get divided by 100 so to map alongside StochasticRSI on the indicator scale.
In other words an RSI buy value inputted as 30 will display as 0.3, but in your PT2 settings you would still input 30.
Stochastic:
-------------
Stochastic and StochasticRSI share common buy and sell value input fields for this indicator (so you can't use BOTH Stochastic and StochasticRSI at the same time, in the same indicator).
The buy and sell values and limits, need to be written as decimal values between 0.00 and 1.00 even though within the PT2 settings, Stochastic is inputted as values between 0 and 100.
So when translating values from this indicator to your PT2 settings, a Stochastic Buy Value of 0.3 in this indicator will be written in your PT2 settings as 30. Just like RSI.
StochasticRSI:
-----------------
PT2 uses StochasticRSI values between 0.00 and 1.00 (as mentioned above). It is because of this, to enable RSI and Stochastic to display together, everything is displayed using the decimal notation of between 0.00 and 1.00.
MACD:
--------
The MACD is completely different and produces a decimal value down to 9 decimal places as used in PT2, making it not compatible with the RSI and Stochastic values.
So at the top of the settings of this indicator, you need to choose which indicator you wish to view at a time (Stochastic-RSI or MACD, not both).
Also, Trading view doesn't handle negative decimals down to 9 places very well, so the Buy/Sell Value/Limit numbers you enter here will be divided by 100,000,000.
This means that if you enter a MACD Sell Value of -250 in this indicator, it gets translated to -0.000000250. This would be the decimal value you would put in your PT2 settings.
======================================================================================================================================================
I hope this indicator helps you all out, feel free to show any appreciation you have in what ever way you feel you can.
// Created 2018 - by @Squiggles#8806
// LTC Tip Jar: LX4bUBdjiRPsagUbZoAczSGgDC4YqTJL7w
======================================================================================================================================================
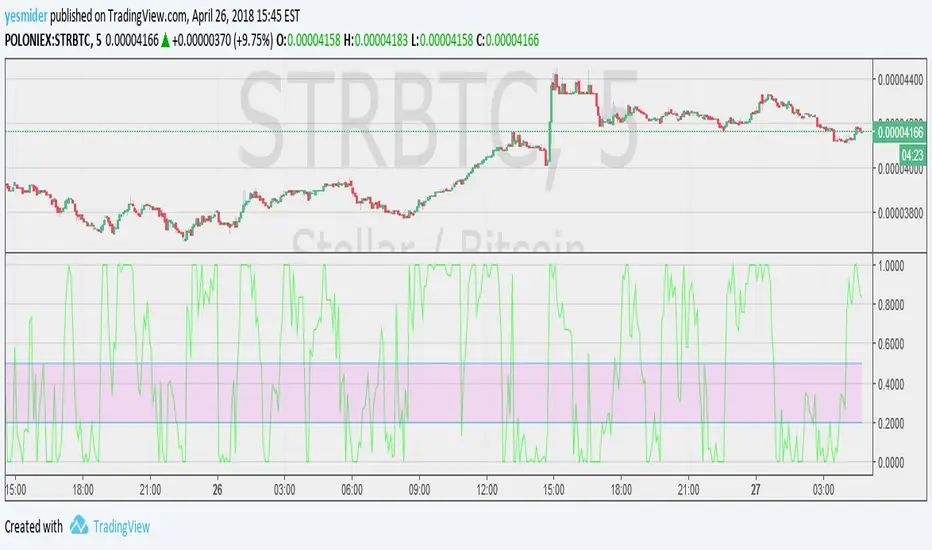
Chỉ báo Stochastic RSI (STOCH RSI)


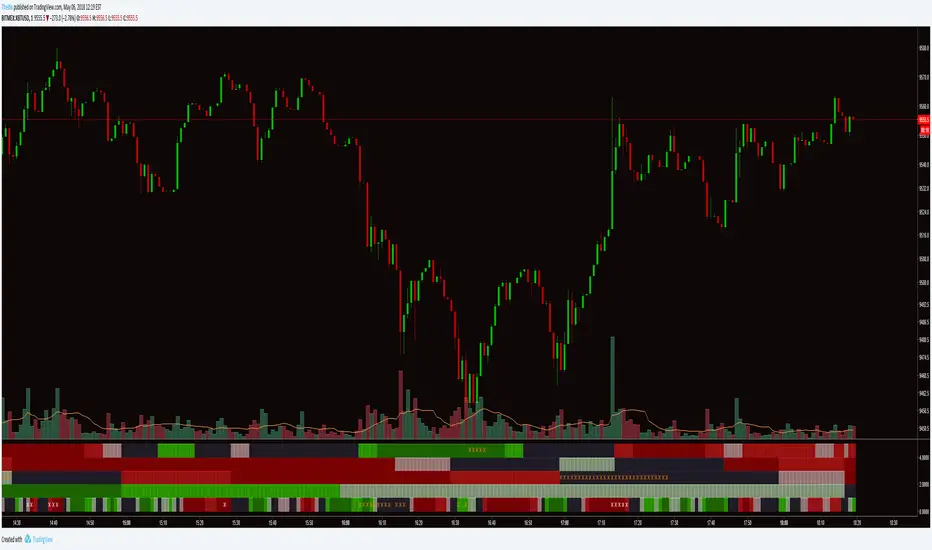
Zero Cross Buy/SellThis is an oscillator.
Buy on zero cross from below.
Sell on zero cross from above.
It prevents risky buys when price is too high and too low. It is capable of recognizing long bear runs to prevent you prom buying
Best used with Bollinger Bands.
Based on RSI and Stochastic RSI

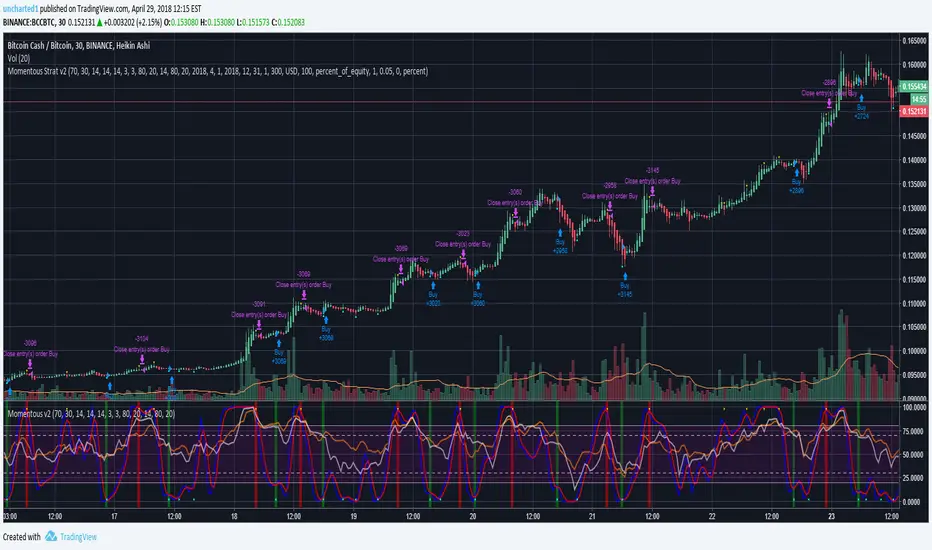
uncharted1 - Momentous v2Study using RSI, StochRSI, and MFI indicators. Mix and match to find your best entries and exits using these indicator combinations. All the switches are in the Inputs page so have fun with it. Alert setups are easy. I created this primarily for crypto currencies and long positions. Perfect for users of AutoView. Backtest component by @pbergden included.
Alert conditions are easy enough to set up. Just use 'Buy Alert' and 'Sell Alert'.

uncharted1 - Momentous v2Study using RSI, StochRSI, and MFI indicators. Mix and match to find what you think could be the best entries and exits using these indicator combinations. All the switches are in the Inputs page so have fun with it. Alert setups are easy. I created this primarily for crypto currencies and long positions. Perfect for users of AutoView.
Alert conditions are easy enough to set up. Just use 'Buy Alert' and 'Sell Alert'.
indicator for v3it's a simple indicator for my script there are some indicators can't be shown clearly when overlay.
Support MACD,RSI,STOCH,STOCHRSI
this script will only show the value profit trailer is using if you need the full function indicator you can use the built-in.
you need to set the SAME value of setting you are using in my script V3 except for buy_value and limit.
Feel free to donate if you think my scripts are useful.
BTC:17eguEeVVnLmYK9iDKQNxBQmKWNENH4bGj
ETH:0xb172BBc4CDAB7F334243A312A46FB8492674A914
BCH:qpy0zulq9s4pcqu3hd2m8h8h7tfm83jz7qle0690c4

DepthHouse RSI Grid MTFDepthHouse RSI Grid MTF is used to determine overbought and oversold levels based on the RSI across multiple time frames.
The default time frames are the 30m, 2H, 8H and 16H however these are completely adjustable.
This indicator also allows the user to select which RSI band to display based on the time frame.
The default is set to the current time frame, however the user can select any of the other four time frames.
OverBought & Oversold Levels are also entirely adjustable.
Meaning you can adjust the 30, 70 ranges, and it will alter the overbought and oversold values across ALL timeframes.
How to get:
As you can see this is an invite only script. In the coming month this indicator, along with many others will become pay to use only. (website on my profile page)
However all my indicators will be FREE until May 1, 2018 . So please try them out!
To take advantage of this free trial:
Just leave a comment!
IF you are viewing this after May 1st. Please feel free to send me a PM or visit my website.

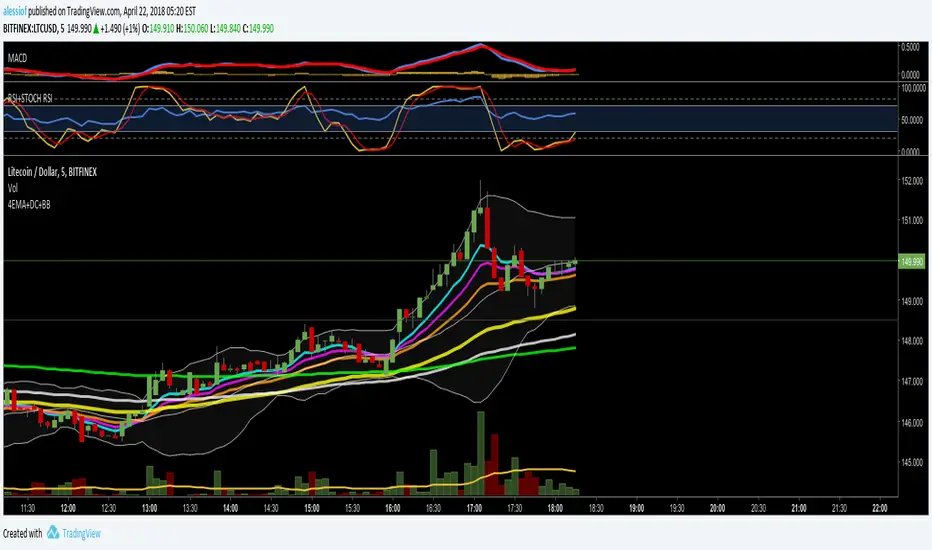
RSI + STOCH RSI OVERLAY by AlessiofRSI and Stochastic RSI in one. Standard settings.
Check out my other script for 4EMA + Death Cross + Bollinger Bands all in one.
Cryptopeep RSI, Stochastic RSI, Stochastic and Williams %R, 4in14 Charts all in one chart, RSI, Stochastic RSI, Stochastic and Williams %R
Hope you like, please let me know your thoughts.
If you would like to be kept up to date please FOLLOW us and try our indicators and strategies here: uk.tradingview.com
If you like it please click the LIKE button.

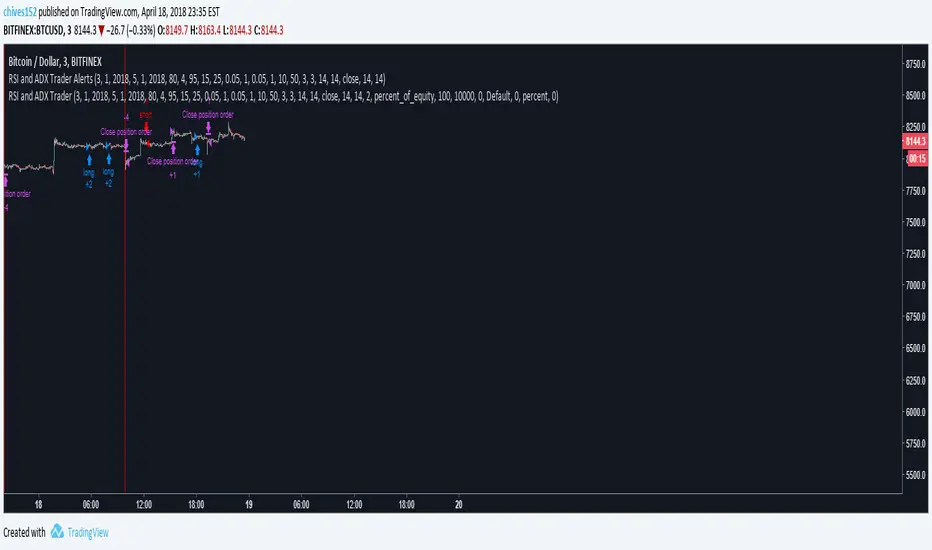
RSI and ADX Trader AlertsAlert system for development strategy. Please don't request access, this is for personal use. If you are interested in my actual indicator you can look here:


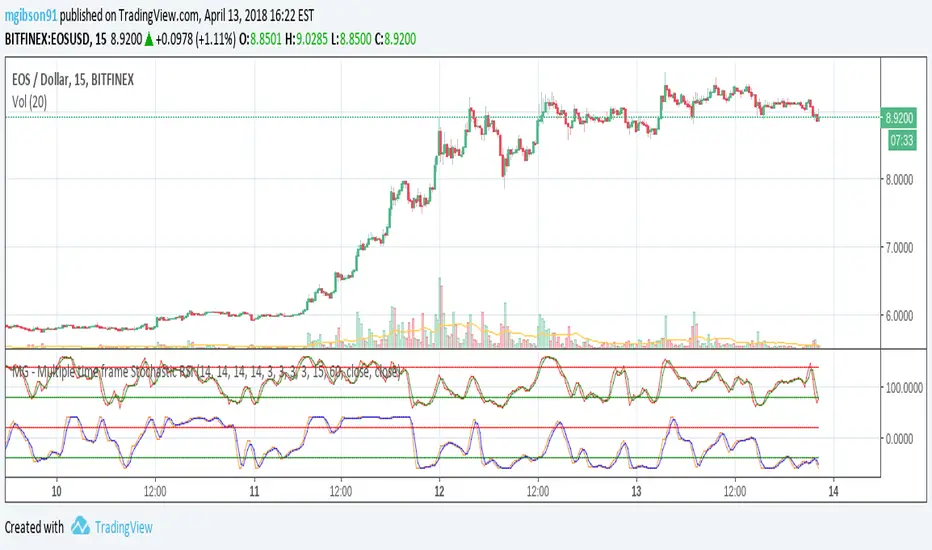
MG - Multiple time frame Stochastic RSIAllows user to view stochastic RSI from two different time frames.
Each stochastic RSI indicator is fully customizable, offering the following options:
- Timeframe
- RSI source
- RSI length
- Stochastic length
- Stochastic average length
- Stochastic smoothing length
Usage:
Comparing stochastic RSI across two different time frames can sharpen trades. For example, if you configure a 60 min and 5/15 min stochastic RSI pair, you might enter a long trade when the 60 min stoch RSI crosses up and exit / take profit when the 5 min stock RSI crosses down.
Draculapresley's Daytrading Scalping STRAT O' DoomUsing some custom settings with a few indicators and a custom movement algorithm I have backtested this script and used it with great results. Excellent for getting in and out for quick scalping trades. The results are typically 1% + and sometimes even a great deal more. The indicator gives you buy and sell points and works great with 15 min candles though you can modify the inputs to work with any time frame. Use all 3 indicators for safest bets but most of the time just using the Stoch input with the movement algorithm almost always yields positive results with tons of buys. Works pretty well even in a downturn but absolutely kills in a bull market.
Check out the screenshots below.
imgur.com

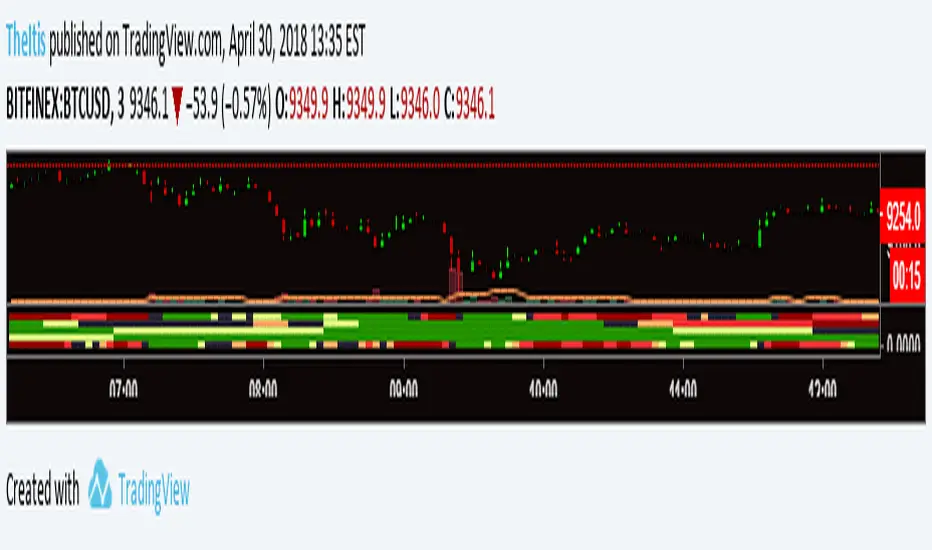
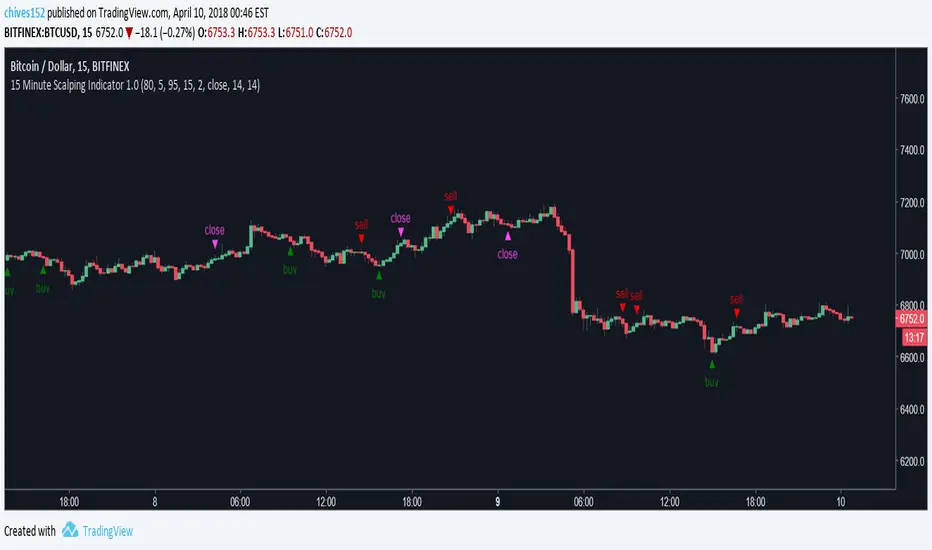
15 Minute Bitcoin Indicator 1.0Indicator Description:
This is a premium indicator that is intended for trading on the 15 minute time scale. This script uses ADX to judge the strength of trends. When a trend is confirmed by ADX, the indicator uses SRSI to find the optimal entry. The indicator works best on BITFINEX:BTCUSD .
Instructions:
Whenever there is a sell signal exit the current long and vice versa. If a close signal appears close the current position but do not open another trade in opposite direction. There is a indicator based stop loss system that is built into the signals, but no static stop loss based on % loss or pips moved in one direction.
Available Settings :
1. Buying and Selling Thresholds: These are the values that are used with SRSI to determine entries. The default values were experimentally determined
to be the most profitable.
2. Stacked Orders Allowed: This limits the amount of positions that can be entered in the same direction. This is useful for trading with leverage. This is defaulted to 2 because I limit myself to 2x leverage. Backtesting shows the more orders allowed, the more profitable, but also risk is increased.
3. ADX/DI Settings: These are settings the ADX smoothing and DI length.
Backtesting:
CLICK HERE
This is a strategy that enters and exits positions on the exact same criteria as this indicator. For the simulation the capital was 10,000 dollars and it was allowed to go up to 2x leverage. Each trade used 100% of available funds. The same simulation done from 1/1/2018 to 4/10/2018 resulted in:
3658.38 % Net Profit
316 Total Closed Trades
77.22 % Profitable
4.552 Profit Factor
24 % Max Drawdown
+11.58% Average Trade
20 15m candles in each trade on average.
Future Plans:
More robust stop loss system.
Factoring trend into trading signals.
EMA integration.
MULTI-TIMEFRAME SUPPORT
Availability
This indicator is currently in a testing stage of development with a full release planned for mid April. While the indicator is not completed, it currently is profitable for me to consider it ready for release. During this testing phase anyone can test it for free for three days, just comment below. Lifetime access currently costs .005 btc, and this price will increase once the full release occurs, if you are interested, DM me for further details.
Please comment with any ideas, suggestions, or criticisms.

MagickMynd RSI/Stoch: Credit to RSI Combo f1ks3rThis script is an updated version of the RSI Combo that was done by f1ks3r (well done and thank you for doing that. It helps a lot!). I have tweaked the individual values to better suite crypto currency trading and have removed a couple of features that I felt were a bit extraneous. The indicator is, I feel, smoother, simpler, more finely tuned and easy to edit to your own specifications if you so choose. Feel free to copy the script and edit as you feel necessary. Happy trading!

RSI Combo (RSI, StochRSI)RSI and StochRSI combination with color fill histogram if RSI is over 70 or below 30.

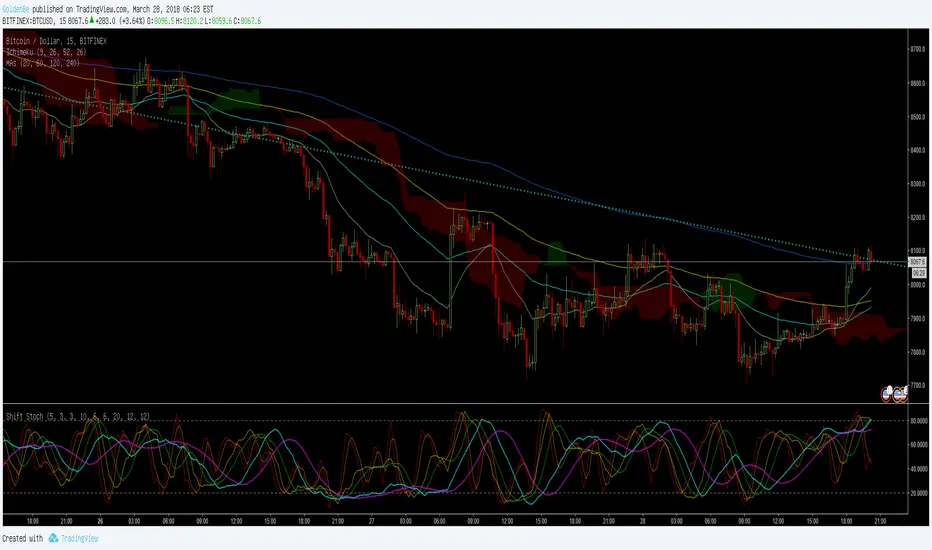
ShiftPower StochasticThis indicator is a combination of the following three slow stochastics commonly used.
ⓐ 5 - 3 - 3
ⓑ 10 - 6 - 6
ⓒ 20 - 12 - 12
( n - %k - %d )
I hope it helps. Thanks.
<한국어>
일반적으로 많이 사용하는 다음 3개의 슬로우 스토케스틱을 하나로 합친 지표입니다.
ⓐ 5 - 3 - 3
ⓑ 10 - 6 - 6
ⓒ 20 - 12 - 12
( n - %k - %d )
도움이 됐으면 좋겠습니다. 감사합니다.