Support/Resistance Strength [UAlgo]The Support/Resistance Strength indicator is a tool designed for traders seeking a precise understanding of key support and resistance levels in the market. This tool dynamically identifies and visualizes support and resistance zones based on pivot points and strength criteria, providing traders with actionable insights for better decision-making.
By incorporating features such as ATR-based or percentage-based channel calculations, customizable strength thresholds, and intuitive visualization of key levels, the indicator caters to traders of various skill levels and strategies. It also adapts dynamically to market conditions, allowing users to identify frequently tested zones with minimal manual input.
🔶 Key Features
Dynamic Support and Resistance Zones
Automatically detects significant support and resistance levels using pivot high and low calculations.
Offers ATR-based or percentage-based channel customization to cater to diverse trading styles.
Customizable Parameters
Lookback period for pivot calculations, strength threshold, and maximum stored pivots are fully adjustable.
Display options for showing specific numbers of recent support/resistance lines.
Intuitive Visualization
Highlights key support and resistance levels with color-coded lines and labels.
Includes percentage deviation from the current price for quick assessment.
Interactive Updates
Continuously updates support and resistance levels to reflect changing market dynamics.
Displays pivot points visually for enhanced clarity.
Can be used effectively on various timeframes, from intraday to daily and weekly charts.
🔶 Interpreting the Indicator
Identifying Key Levels
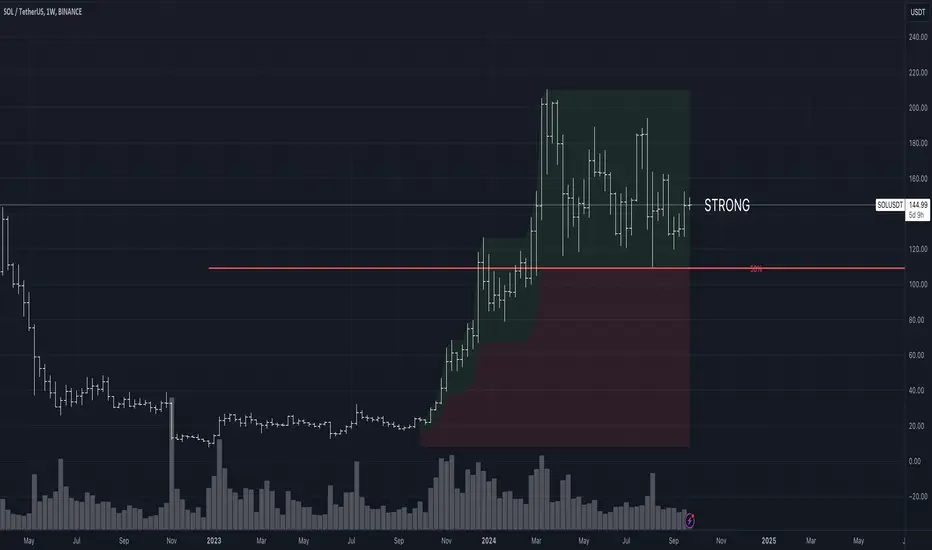
Support levels are indicated by green (lime) lines and resistance levels by red lines. The transparency of colors is adjustable for visual preference.
Labels display the exact price level and the percentage difference from the current price.
Strength Threshold
The "Minimum S/R Strength" parameter defines how frequently a level must be tested to be considered significant.
Higher strength values indicate zones that have been tested more frequently, suggesting stronger support or resistance.
Pivot Points
The indicator marks pivot high and low points on the chart to provide a visual representation of the calculated levels.
Dynamic Updates
The indicator adapts to the most recent price action. If the price moves above a resistance level or below a support level, the color of the lines and labels will dynamically change to reflect the current price positioning.
🔶 Disclaimer
Use with Caution: This indicator is provided for educational and informational purposes only and should not be considered as financial advice. Users should exercise caution and perform their own analysis before making trading decisions based on the indicator's signals.
Not Financial Advice: The information provided by this indicator does not constitute financial advice, and the creator (UAlgo) shall not be held responsible for any trading losses incurred as a result of using this indicator.
Backtesting Recommended: Traders are encouraged to backtest the indicator thoroughly on historical data before using it in live trading to assess its performance and suitability for their trading strategies.
Risk Management: Trading involves inherent risks, and users should implement proper risk management strategies, including but not limited to stop-loss orders and position sizing, to mitigate potential losses.
No Guarantees: The accuracy and reliability of the indicator's signals cannot be guaranteed, as they are based on historical price data and past performance may not be indicative of future results.
Chỉ báo Pine Script®