ICT 00:00, 08:30, 09:30 & 13:30 Opens (NY) — Prior-Day HistoryICT 00:00, 08:30, 09:30 & 13:30 Opens (NY)
This is a derivative of ALPHAICTRADER’s open-source script, republished under the MPL-2.0 with clear attribution and documented changes. It plots four New-York–anchored intraday reference levels—0000, 0830, 0930, 1330—as short, right-padded stubs with clean side labels. Use these time anchors (ICT-style midnight + key US windows) to frame bias, volatility pockets, and intraday trade locations.
What’s original in this version (changes)
Right-padded stubs instead of chart-wide rays — each level ends N bars past the latest candle (configurable).
Side labels at the line tip — text-only labels (0000, 0830, 0930, 1330) that sit at the right end of each stub and update every bar.
Optional prior-day history — show Today only or Today + Prior Day; older lines/labels auto-pruned.
Per-anchor controls — Display, Style, Color, Width, and Show Label for each time.
What it plots (and why)
0000 (NY Midnight): daily session anchor for bias/liquidity context.
0830 (NY): macro data window (CPI/NFP/claims) where volatility often concentrates.
0930 (NY): US cash equity market open; opening-drive structure/acceptance tests.
1330 (NY): early-afternoon anchor for continuation vs. fade.
How it works (under the hood)
Session detection: time("1", session, "America/New_York"); first bar flagged via not na(ts) and na(ts ).
Anchor price: open of that first bar per session/day.
Rendering: lines drawn with xloc=bar_index from start bar to bar_index + Right Pad; x2 updates every bar (no extend.right).
Labels: placed at line.get_x2(line) + Label Pad, soft color variant; updated per bar to stay on the tip.
History: arrays keep either today only or today + yesterday and delete anything older immediately.
How to use
Add to any intraday chart (futures/FX/indices). Anchors are always NY-time; TradingView handles DST.
Inputs
00:00 / 08:30 / 09:30 / 13:30 (NY): Display, Line Style, Color, Width, Show Label
Right Edge: Right Pad (bars) · Label Pad (bars)
History: Show Prior Day (History) — off = today only; on = today + yesterday
Suggested pads: Right Pad 2–5 bars; Label Pad 0–2.
These are context anchors, not signals. Combine with your execution model (market structure, liquidity, FVG/OBs, etc.).
Attribution & License (MPL-2.0)
Original work: “ICT NEW YORK MIDNIGHT OPEN AND 8.30 AM OPEN” by ALPHAICTRADER (MPL-2.0).
This derivative: modifications listed above; source published and kept under MPL-2.0 per license terms.
If you distribute a modified version of this Pine file, you must keep MPL-2.0, retain the copyright/licensing header, publish your modified source, and document your changes.
Notes: Pine v5. Minimalist (no day dividers). Educational tool; not financial advice.
Copyright: © ALPHAICTRADER 2022 · © Funk 2025
License: MPL-2.0
Hỗ trợ và kháng cự

Today's 5min HH/LL LinesOverview
This indicator identifies the highest high (HH) and lowest low (LL) formed by the first 5 one-minute candles of the current trading day. Once calculated, it plots continuous horizontal lines at those price levels for the remainder of the day.
How it works
The script internally requests 1-minute data for the current symbol, regardless of your chart’s timeframe.
At the start of each new trading day, it resets counters.
It captures the highest high and lowest low across the first five completed 1-minute candles.
After the 5th one-minute bar closes, it draws:
A green horizontal line at the highest high.
A red horizontal line at the lowest low.
These lines extend to the right, covering the entire trading session, and automatically scale with zoom/pan.
At the next session, the old lines are deleted and recalculated for the new day.
Use cases
Helps spot early intraday support and resistance zones.
Useful for breakout or reversal strategies that monitor when price breaches the first 5-minute range (derived from 5x1m bars).
Can be combined with volume, momentum, or candlestick signals for high-probability entries.
Key features
Works on any timeframe — always uses 1-minute data for precision.
Shows lines only for the current day (no clutter from prior sessions).
Lines are dynamic and adaptive — they remain fixed at the calculated price but extend continuously across the chart.

Weekly Fibonacci Pivot Levelsthis indicator in simple ways, draw the weekly fibo zones based on calculations
weekly zones are drawn automatically based on previous week, and are updated once a new week is opened
you can use it the way you like or adapt to your trading strategy
i really use it at extremes and when a divergence is occurring in these zones

[ClearEdege] Momentum Suites V3 Advanced contrarian momentum analysis with intelligent pivot point integration for precision market timing. Developed for ClearEdge members
*This indicator is not publicly available.
Key Features
Smart Signal System
- Buy Low/Sell High Logic: Identifies oversold conditions for long entries and overbought conditions for short entries
- Multi-Timeframe Confirmation: Incorporates higher timeframe bias for enhanced signal reliability
- Momentum Convergence: Combines RSI, StochRSI, and Bollinger Bands for comprehensive market analysis
Dynamic Pivot Integration
- Classic Pivot Points: Auto-calculated daily/weekly/monthly support and resistance levels
- Pivot Confluence Detection: Signals gain strength when price approaches key pivot levels
- Smart Warning System: Single-alert approach prevents label spam while highlighting critical S/R interactions
Table Dashboard
- Compact Signal Table: Real-time buy/sell signal strength with scoring system
- Market Context: Momentum status, nearest pivot level, volume and trend analysis
- Clean Visual Design: Minimal interface focused on actionable information
Intelligent Alerts
- Approach Warnings: Alerts when price nears resistance with overbought momentum or support with oversold momentum
- Confluence Signals: High-probability setups combining momentum extremes with pivot level proximity
- Single-Shot Logic: Prevents alert fatigue with smart reset mechanisms
Best Use Cases
- Swing Trading: Ideal for identifying major reversal points at key levels
- Risk Management: Clear warning system for potential turning points
- Multi-Asset Analysis: Works across forex, crypto, stocks, and commodities
- All Timeframes: Scalable from 5-minute charts to daily analysis
Designed for traders who value precision over noise - combining classical pivot analysis with modern momentum indicators for superior market timing.

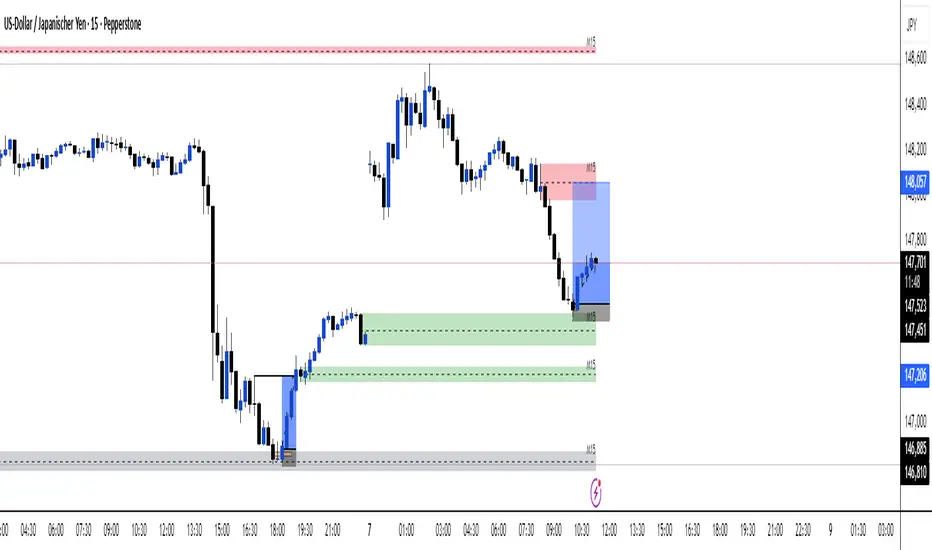
Multi TF - HTF→LTF OrderblocksMulti TF — HTF→LTF Orderblocks
Identify higher-timeframe (HTF) order blocks and project them onto your lower-timeframe (LTF) chart—clean, fast, and publication-ready.
The script automatically detects swing breaks on your chosen HTF, builds the originating order block, and renders that zone on your current chart so you can execute on lower timeframes with higher-timeframe context.
--------------------
How it works
HTF swing structure is tracked via pivot highs/lows and a user-selected break confirmation (Close or Wick).
On a valid break, the script backtracks to the last opposite candle and creates the HTF order block (wick-to-wick or body-only depending on your setting).
The OB is projected to the LTF and extended bar-by-bar until:
Mitigation: price penetrates at least 50% of the zone → the box is marked “old” (dimmed) or optionally auto-deleted.
Close-break: price closes beyond the far edge → zone is optionally removed immediately.
Each zone includes a centerline and an inside label showing the original HTF (e.g., “M15”, “H1”).
Key features
True HTF→LTF overlay: trade M1/M5 with M15/H1/H4 context.
Mitigation logic (≥50%): first meaningful touch turns the zone “old” or deletes it (your choice).
Close-break handling: auto-remove zones broken by close, to keep charts clean.
Overlap control: choose how to handle overlapping zones on the same side:
Keep Latest, Union (merge), or Intersection (refine).
Wicks vs. Bodies: build zones from full candle range or just the body.
Lightweight UI: only the relevant inputs in the panel; sensible defaults.
Alert included: fires on the first 50% mitigation of any fresh zone.
Performance-friendly limits: cap the number of active zones to fit Pine limits.
Inputs (quick overview)
HTF for Order Blocks: timeframe to scan (e.g., 15, 60, 240, D).
Swing Length (Pivot L/R): pivot sensitivity for structure.
Break Confirmation: Close (recommended) or Wick.
Zones use Wicks: on/off for wick-to-wick zones.
OB Lookback before Break: how far to search for the opposite candle.
Max Active Zones: hard cap for chart cleanliness & performance.
Delete on Close-Break: remove zones that are invalidated by a close.
Delete after Mitigation: remove once a 50% touch occurs.
Handle Overlap: None, Keep Latest, Union (merge), Intersection (refine).
Colors & Border: fresh/old zone colors (default ~35% opacity) and optional borders.
Default profile (as shipped):
Break by Close, zones use wicks, Union overlap handling, 250 lookback, 250 max zones, borders off, and HTF label printed inside each zone.
How to use (suggested workflow)
Pick an HTF (e.g., H1 for intraday) and drop to your execution TF (e.g., M5/M1).
Wait for price to tap ≥50% of a fresh OB → look for your LTF trigger (CHOCH, iFVG, PA).
Place SL beyond the zone (or beyond the LTF swing) and manage to your targets (e.g., 2R–3R or to the next HTF OB).
Keep charts clean by enabling Delete on Close-Break and (optionally) Delete after Mitigation.
Alerts
“OB: Zone berührt (Erstkontakt)” — triggers on the first ≥50% mitigation of any fresh zone.
Create additional TradingView alerts with this condition to get notified in real time.
Notes & limitations
Built with request.security(..., lookahead_off) to avoid future-bar peeking; zones only form after a confirmed HTF break.
As with all pattern-based tools, use alongside your risk management and a defined entry model.
Pine has strict limits on drawings; use Max Active Zones to balance coverage and performance.
Credits
Designed for traders who want HTF precision with LTF execution—a clean, opinionated OB overlay that focuses on what matters: fresh zones, first touch, and invalidation.
GOLD SCALPERGOLD SCALPER is an advanced trading indicator specifically designed for scalping on GOLD markets. It combines an ultra-fast prediction line with optimized Support & Resistance levels, providing a unique approach to GOLD trading.
Key Features
Ultra-Fast Prediction Line
The indicator contains the only directional indicator in the chart - an ultra-fast prediction line that reacts instantly to price changes. The line is drawn on every bar for maximum speed and provides clear BUY, SELL, and WAIT signals.
GOLD-Optimized Support & Resistance
The S/R system is specifically optimized for GOLD characteristics. It uses pivot period 10 for faster detection, sensitivity 1 for maximum sensitivity, and strength filter to display only strong levels with 3+ touches.
Anomaly Warning System
A unique early warning system for anomalies. When unusual market behavior is detected, S/R levels turn orange, alerting to potential risky situations.
Session Filter
An intelligent session filter optimized for GOLD trading. Automatically detects London and New York sessions (8-21 UTC) and adjusts signals based on market activity.
Technical Specifications
Prediction Line
- BUY signal: Vertical green line up
- SELL signal: Vertical red line down
- WAIT signal: Horizontal orange line
- Dotted style for scalping
- Instant reaction to price changes
Support & Resistance
- Pivot Period: optimized for 5M timeframe
- Sensitivity: maximum sensitivity
- Max Lines: 5 (better coverage)
- Strength Threshold: only strong levels
- Retest Tolerance: 0.1% (precision for GOLD)
Anomaly Detection
- Lookback: 20 bars
- Threshold: 2.0 ATR
- Detects: Range expansion, volume spikes, rapid price changes, RSI extremes
- Visual warning: Orange S/R lines
GOLD Optimizations
GOLD-Specific Settings
The indicator is optimized for GOLD trading with the following specific settings:
- Shorter pivot periods for faster reaction
- Maximum sensitivity for GOLD characteristics
- Volume confirmation for more reliable signals
- Session awareness for best trading times
Performance Optimizations
- Cache optimization for all calculations
- Memory management for proper line deletion
- Pine Script v6 for modern functionality
- No linter errors for stable performance
Usage
Recommended Settings
- Timeframe: 5-15M GOLD
- Sessions: London/NY (8-21 UTC)
- Prediction Style: Dotted
- S/R Style: Dotted
- Anomaly Warning: Enabled
Trading Approach
The indicator is designed for a scalping approach with emphasis on speed and accuracy. It combines a fast prediction line for directional signals with slower S/R levels for context and confirmation.
GOLD SCALPER represents a professional tool for GOLD scalping with a unique approach combining speed with precision. It is ideal for traders who need instant signals and reliable S/R levels for their trading decisions.

Riz Goldbach FrameworkRiz Goldbach Framework maps a dynamic dealing range and a set of Goldbach-derived price levels to structure intraday decision-making. It blends range math (PO3), level clustering, session weighting, volume/volatility context, and an explainable scoring engine that can issue BUY/SELL signals with risk levels (SL/TP). It is designed for discretionary traders who want rules-based context rather than a black box.
Core concepts (how it works)
1) PO3 Dealing-Range Engine
⦁ The script builds a tri-based PO3 range around current price (Auto or Manual).
⦁ It shifts the range when price “accepts” outside (close/wick—user selectable) and adapts width with ATR so the range expands in high volatility and tightens in low volatility.
⦁ From this range it computes mid, premium/discount halves, and sub-mids.
2) Goldbach Levels (structure map)
Within the active PO3 range, fixed percentages anchor recurring behaviors:
⦁ Rejection edges: 3%, 97%
⦁ Order-block tendency: 11%, 89%
⦁ FVG tendency: 17%, 83%
⦁ Liquidity void / expansion: 29%, 71%
⦁ Breaker band: 41%, 59%
⦁ Mitigation band: 47%, 53%
⦁ Equilibrium: 50%
⦁ Touch/near logic is tolerance-based (body-only optional). The script also counts confluence clusters (2=moderate, 3+=strong) near price.
3) Market elements the script tracks
⦁ Order Blocks (OB): detected after BOS behavior when price is sitting on OB-biased GB levels (11/89).
⦁ FVG: 3-bar gaps at FVG-biased levels (17/83) with optional “% fill” confirmation.
⦁ LV bars: wide-range, high-range bars around 29/71 for displacement/voids.
⦁ Equal Highs/Lows (EQH/EQL): tolerance with labeling for sweep risk.
⦁ Circuit Breaker (CB): zone seeded at 41/59. States: intact → broken → retest → revalidated/failed. A shaded band shows the active breaker zone.
⦁ Twin Towers (TT): equal-high/equal-low doublet with spacing/volume/RSI checks, then sweep-and-return into the breaker zone for confirmation.
4) Context & filters
⦁ Trend vs Range: DMI/ADX + EMA stack infer TREND/RANGE/TRANSITION and scale the required score.
⦁ MTF alignment: compares current PO3 halves vs HTF PO3 halves (user timeframe), rewarding alignment and flagging divergence.
⦁ Fib–Goldbach confluence: checks 61.8/38.2/78.6/127.2/161.8 against key GB levels for added weight.
⦁ Session weighting: Asia/London/NY bias different GB levels; weights are higher for London/NY.
⦁ Volume-weighted liquidity: tracks volume at EQH/EQL to flag “high-commitment” sweeps.
⦁ AMD cycle (smart): accumulation/manipulation/distribution estimated from ATR regimes, sweeps, BOS continuation, divergence and PO3 shifts.
⦁ Optional filters: HTF bias, SMT divergence via a second symbol, VSA volume emphasis, news blackout session.
5) Signal engine
⦁ Modes: MMxM, Trending, or Hybrid (auto switches depending on CB acceptance + ATR expansion).
⦁ A score (0–100) aggregates weighted conditions (GB touch/confluence, AMD alignment, CB state, TT, FVG/OB interaction, HTF bias, SMT, high-volume, RSI momentum).
⦁ Adaptive threshold raises/lowers requirements in TREND vs RANGE.
⦁ Outputs: BUY/SELL label with strength (WEAK/NORMAL/STRONG), a reasons string (e.g., GB+AMD+Breaker+TT+FVG+HTF+RSI), and risk levels:
⦁ SL: rejection/structure anchored (e.g., GB3/GB97 or recent swing ± ATR).
⦁ TP1: opposite breaker (41/59).
⦁ TP2: opposite FVG tendency (17/83).
⦁ Live RR displayed on label and plotted as dashed lines.
⦁ Cooldown, session/time, weekend, and volatility gates suppress poor-quality or clustered signals.
What you see on the chart
⦁ PO3 bands: High/Low/Mid lines plus background shading for Premium (bear tint), Discount (bull tint), Equilibrium (neutral).
⦁ Goldbach lines: Major structure (0/50/100) plus the functional GB set (11/17/29/41/47/53/59/71/83/89/3/97).
⦁ Blocks & gaps: OB lines, FVG boxes (extend right, fill progress), LV box, breaker zone band, and TT logic states.
⦁ CE/MT: Central equilibrium (~3.5%/96.5%) and mid-towers (25%/75%) trigger optional alerts.
⦁ Session overlays: Asia/London/NY (optional).
⦁ Opens: Daily/Weekly (optional).
⦁ Dashboard: PO3 value, Zone (Premium/Discount/Equilibrium), AMD phase, Session, Mode (MMxM/Trending/Hybrid), CB state, nearest GB tag, Market context (TREND/RANGE/TRANS), recent Events, and rolling win-rate tallies (signals/CB/TT) from the current chart session.
How to use it (workflow)
1. Pick a preset
⦁ Minimal: only core structure.
⦁ Standard: levels + dashboard.
⦁ Full: adds sessions + GBT window overlays.
2. Choose range logic
⦁ PO3 Auto is reactive and scales with ATR.
⦁ Manual PO3 is for precise range control.
3. Scope your bias
⦁ Confirm Zone (Premium/Discount), CB state, and AMD phase; check MTF row if enabled.
⦁ Strong setups usually appear when session-weighted GB levels + confluence ≥ 2 + CB revalidated + AMD = manipulation → distribution (short) or accumulation → manipulation (long).
4. Act on signals (optional)
⦁ When a label prints, read the factors string and score.
⦁ Use plotted SL/TP1/TP2 lines and RR.
⦁ Respect cooldown, news blackout, and volatility filter.
Inputs you might tweak
⦁ PO3: Auto/Manual, acceptance by Close vs Wick, adaptive widening/tightening.
⦁ Levels: Major-only vs All; tolerance %; wick vs body touches.
⦁ Signals: Mode, score threshold, cooldown, confirm on close.
⦁ CB/TT: breaker width %, spacing window & tolerance, suppress bars after TT.
⦁ Filters: HTF timeframe, SMT symbol, VSA on/off, news blackout session.
⦁ Visuals: colors, line opacity, label sizes, dashboard position/size.
⦁ FVG/LV/CE/MT: fill %, and per-event alerts.
Alerts available
⦁ BUY/SELL signal, PO3 shift, GB touch (with tag), CB broken/retest pass/fail, TT setup/confirmed, OB tagged, FVG formed/filled, LV expansion, CE/MT touches.
Limitations & notes
⦁ Signals are contextual—they depend on the active PO3, tolerance, filters, session weighting, and volatility regime.
⦁ HTF requests depend on broker/exchange data and the timeframe you assign; if HTF is empty or illiquid, features degrade gracefully but may be less informative.
⦁ Win-rate tallies are session-local (not a historical performance guarantee).
⦁ Parameter choices (e.g., tolerance, breaker width, thresholds) materially change behavior.
Disclaimer
This tool is for educational/informational purposes only. It does not constitute financial advice, an invitation to trade, or performance assurance. Markets involve risk—always test on replay/paper and manage risk independently.

Wyckoff Smart Money Pro [MTF]Wyckoff Smart Money Pro detects trading ranges, phases, and events from the Wyckoff method and confirms them with VSA (Volume Spread Analysis), divergence checks, and a composite “smart money” strength index. It generates optional buy/sell signals only when multiple conditions align (phase, VSA, CO strength, effort vs. result, time/volume filters). The dashboard, POC/Value Area, and MTF backdrop help you manage context and risk in real time.
What this indicator does
Wyckoff Smart Money Pro is a multi-timeframe Wyckoff tool that:
⦁ Finds accumulation/distribution ranges and tracks Phases A–E.
⦁ Labels Wyckoff events (PS, SC, AR, ST, Spring/Test, SOS, LPS, UTAD, SOW, LPSY, TS…) and VSA patterns (No Demand/Supply, Stopping Volume, Upthrust, etc.).
⦁ Computes a Composite Operator (CO) Strength score from price/volume behavior to approximate “smart money” bias.
⦁ Adds divergence, effort vs. result, and a volume profile (POC & 70% value area) inside the detected range.
⦁ Provides buy/sell signals only when a configurable confluence is present (events + VSA + CO + EVR + phase + filters).
⦁ Supports MTF context (with a safe HTF resolver and fallbacks) and an Info Dashboard to summarize the current state.
It is designed to make the Wyckoff workflow visual and rules-based without promising results or automating decisions.
How it works (methods & calculations)
1) Range & Phase model
⦁ A sliding lookback searches for a valid range (recent highest high/lowest low), requiring width within 2–10× ATR(14) and a minimum bar count inside the bounds.
⦁ Once a range is active, the script derives Creek/Ice/Mid/Quartiles and classifies bars into Wyckoff Phases A–E using event recency (barssince) and where price sits relative to the range.
⦁ The background color reflects the current Phase; optional MTF events (from the chosen HTF) tint the background lightly for higher-timeframe context.
2) Wyckoff & VSA event engine
⦁ Events include PS, SC, AR, ST, Spring, Test, SOS, LPS, PSY, BC, UTAD, SOW, LPSY, TS, plus minor/multiple variants and Creek/Ice jumps.
⦁ VSA patterns detect No Demand/No Supply, Stopping Volume, Buying/Selling Climax, Upthrust/Pseudo Upthrust, Bag Holding, Shake-Out, Volume Dry-Up, etc., from spread vs. average spread and volume vs. average volume with tunable thresholds.
3) Smart-money (CO) Strength
⦁ CO Strength (0–100) blends: relative volume on up/down bars, professional accumulation/distribution, no-supply/no-demand, stopping volume, Springs/UTADs and Tests, SOS/SOW, price’s position inside the range, and volume-delta vs. its MA.
⦁ Persistent accumCount / distCount counters smooth temporary noise.
4) Divergence & Effort-vs-Result
⦁ Price vs. cum volume-delta divergence highlights weakening pushes.
⦁ EVR flags “High effort / no result” and potential Bullish/Bearish reversals, or “Low effort / high result” moves that are often unsustainable.
5) Volume Profile (inside range)
⦁ A 50-bin profile accumulates volume across the detected range to derive POC, VAH/VAL (70% value area). Lines update as the active range evolves.
6) Multi-Timeframe (MTF) safety
⦁ getHTF() converts your multiplier to a valid Pine timeframe string (e.g., 60, 240, 2D, 1W), and the script falls back to current timeframe values if an HTF request returns na.
⦁ If you enter a Custom HTF, it must be strictly higher than the chart’s timeframe (validated at runtime).
7) Signals & risk model
⦁ Signals are not tied to any single pattern. A buy may require Spring/Test/Shake-out/Creek Jump or SOS plus confirmation (VSA, CO>60, Phase C/D, divergence/EVR context).
⦁ Sell is symmetrical (UTAD/Failed Spring/SOW/Ice Jump + VSA + CO<40 + Phase C/D).
⦁ Minimum confidence is configurable; SL/TP and R:R lines are drawn from range edges or recent bar extremes.
⦁ Filters: trading hours, weekend avoidance, and a minimum volume threshold (relative to average) are available to suppress low-quality contexts.
⦁ Alerts include all major events, divergences, structure/phase changes, and the gated Buy/Sell signals (with a cooldown to reduce alert spam).
Inputs (key ones you’ll actually use)
⦁ Display Settings: toggle ranges, phases, events, VSA, signals, dashboard.
⦁ MTF: Enable HTF, set Multiplier or a Custom HTF (must be higher than current).
⦁ Range Detection: period / min bars / pivot strength.
⦁ VSA: volume sensitivity & climax multiplier.
⦁ Signal Settings: minimum confidence, risk/reward labels.
⦁ Advanced Filters: trading hours, weekend avoidance, and Min Volume Filter (× avg).
⦁ Colors: phase backgrounds, structure colors, and line styling.
How to use (practical flow)
1. Choose a symbol & timeframe you normally analyze (e.g., 5–60m for entries, 4H/D for context).
2. If using MTF, pick a multiplier (e.g., 5×) or a Custom HTF (e.g., 240/4H).
3. Wait for a range to form; watch Phase and CO Strength on the Dashboard.
4. When events (e.g., Spring/Test in Phase C or UTAD in distribution) appear with favorable VSA, CO, EVR, and volume/time filters, consider the signal and review R:R lines.
5. Use POC/VA and Creek/Ice/Mid as structure references; manage risk around the range edge that generated the setup.
On-chart legend (what the letters mean)
Wyckoff events (labels)
⦁ PS Preliminary Support, SC Selling Climax, AR Automatic Rally, ST Secondary Test
⦁ Spring Spring; Test Test of Spring
⦁ SOS Sign of Strength; LPS Last Point of Support
⦁ PSY Preliminary Supply, BC Buying Climax
⦁ UTAD Upthrust After Distribution; SOW Sign of Weakness; LPSY Last Point of Supply
⦁ TS Terminal Shakeout; MS Multiple Spring
⦁ CJ Creek Jump; IJ Ice Jump
⦁ mSOS / mSOW Minor Sign of Strength/Weakness
VSA patterns (tiny labels)
⦁ ND No Demand, NS No Supply, SV Stopping Volume, BC/SC Buying/Selling Climax
⦁ PA/PD Professional Accumulation/Distribution, BH Bag Holding, DU Volume Dry-Up
⦁ SO Shake-Out, TS Test for Supply (VSA test), UT Upthrust, PUT Pseudo Upthrust
Other visuals
⦁ Range box with Creek (upper third), Ice (lower third), Mid, Quartiles
⦁ POC/VAH/VAL: yellow solid (POC), purple dotted (value area)
⦁ VWAP and Dynamic S/R (stepline)
⦁ Green/Red triangles: gated Buy/Sell signals (only if min confidence & filters are met)
⦁ Risk label near the triangle: confidence /10 and R:R
Alerts included
⦁ Core events (Spring/Test/UTAD/SOS/SOW/TS), secondary events (SC/AR/BC/LPS/LPSY), VSA patterns, EVR states, Hidden Accumulation/Distribution, HTF events, Divergences, Phase/Structure changes, and the constrained Buy/Sell signals with a cooldown.
Notes, limits & best practices
⦁ This is not a buy/sell system; it’s a context & confirmation tool. Combine with your plan, risk limits, and execution criteria.
⦁ Long, illiquid, or news-driven bars can distort volume/spread logic; filters help but cannot eliminate this.
⦁ For MTF, if an exchange doesn’t support a specific HTF, the script falls back safely to current TF values to avoid na-propagation.
⦁ Dashboard rows/size/position are user-configurable to keep charts uncluttered.
Changelog (what’s new in this version)
⦁ MTF safety & validation (Custom HTF must be above current; graceful fallbacks for request.security() na results).
⦁ Performance caching for close position & up/down bar flags; drawing cleanup to stay under label/line limits.
⦁ Volume Profile upgraded to 50 bins; VA algorithm adjusted accordingly.
⦁ Signal gating with time/day/volume filters and alert cooldown to reduce noise.
⦁ Bug guards for parameter conflicts (e.g., rangeMinBars cannot exceed rangePeriod).
Disclaimer
This script is for educational and research purposes only and does not constitute financial advice or a recommendation to buy or sell any asset. Market risk is real; always test on a demo and trade at your own discretion.

Hopiplaka Goldbach System with SignalsThis tool builds a dynamic price framework around the current market using a PO3 range and a set of mathematically derived Goldbach levels. It then scores nearby levels for quality (reliability) and produces Buy/Sell signals only when multiple, independent factors line up (price level quality, trend/“Tesla Vortex” state, ICT AMD phase, time confluence, volume bias, and momentum). The goal is to identify high-confluence inflection points rather than constant signals.
Core Concepts & Why They’re Combined
1. PO3 Range Framework
Price is segmented into a primary range (lower → upper) determined by a configurable size (3× ladder: 3, 9, 27, …, 2187).
⦁ If price sits near a boundary (configurable sensitivity), the range can auto-expand to the next 3× size to better fit current volatility.
⦁ This gives a stable “map” of the active trading area and its boundaries.
2. Goldbach Levels (Pure Hopiplaka implementation)
For each even number ≤ your precision limit, the script evaluates all prime-sum partitions (Goldbach partitions) and converts their prime ratios into price levels inside the PO3 range.
⦁ Levels are classified as Premium / Standard / Discount based on properties of the prime pair and a mathematical weighting.
⦁ Strict minimum spacing rules (exact %, OB %, liquidity-void %) prevent clutter and keep only the most meaningful levels.
3. Tesla Vortex (trend/phase strength)
A volatility/trend-aware state machine estimates whether market is in MMxM (accumulation/mean-revert like) or TREND conditions and maps price interaction with high-quality levels to phases (e.g., Order Block Formation, Distribution).
⦁ This helps filter signals: buys favored in MMxM near supportive levels; sells favored in TREND near premium/liquidity levels, etc.
4. ICT Integration (AMD, IPDA bias hooks)
A lightweight AMD phase detector classifies the recent window into Accumulation / Manipulation / Distribution and marks market structure bias. This is used as confluence with level quality and trend state.
5. Time Confluence (Goldbach time)
Swing highs/lows are checked against Goldbach-valid timestamps (based on hour+minute sums decomposable into prime pairs). Repeated alignment adds time-bias confidence. When price and time align, level reliability is boosted.
6. Volume & Liquidity Context
A rolling volume baseline marks High/Low Volume Bias; levels can be volume-weighted (raising or lowering their reliability). Proximity to PO3 extremes flags pending liquidity sweeps.
Why this mashup?
The system blends price geometry (PO3 + Goldbach), state/trend (Tesla Vortex), market-microstructure (ICT AMD), time confluence, and volume/liquidity into one numerically scored signal. Each component answers a different question; together they reduce false positives and favor high-quality trades near meaningful levels.
What You’ll See on the Chart
⦁ PO3 Range Boundaries: two dashed lines (“lower” and “upper”). Auto-expand darkens the boundary style slightly.
⦁ Goldbach Levels: horizontal lines colored by classification and context:
⦁ Premium (strong premium band), Standard, Discount
⦁ OB (Order-Block candidate), LV (Liquidity Void)
⦁ TESLA node (trend/phase aligned)
⦁ Heavier width = higher reliability; dashed/dotted styles encode class differences.
⦁ PO3 Liquidity Boxes: narrow yellow shaded bands above/below each level (configurable pip distance).
⦁ Markers
⦁ ▲ Buy arrow below bar when a Buy signal triggers
⦁ ▼ Sell arrow above bar when a Sell signal triggers
⦁ ● Small dot when price touches a Goldbach level
⦁ Data-window plots:
⦁ Tesla Vortex Strength (numeric)
⦁ Time Bias (positive = bullish, negative = bearish)
⦁ Volume Bias (+1 high / −1 low)
⦁ Signal Strength (+ for buy / − for sell, zero when no signal)
⦁ Label Legend (on level tags)
⦁ TESLA – Tesla-aligned level node
⦁ OB – Order-block-quality zone
⦁ LV – Liquidity-void zone
⦁ Premium / Standard / Discount – Level class
⦁ Gxx – Even number used to build the level (Goldbach reference)
⦁ Reliability – Final score after time/volume/tesla weighting
⦁ Optional extras: Vol (relative volume weight), Time (time-confluence strength)
How Signals Are Generated
A signal is proposed when price comes within a minimum distance of a high-reliability level. It is then accepted only if enough of these independent checks pass (you control the required count):
1. Tesla Vortex state matches direction (e.g., MMxM with buy; TREND with sell).
2. ICT AMD phase aligns (Accumulation → buy bias; Distribution → sell bias).
3. Goldbach time bias supports the direction.
4. Volume bias supportive (high-volume context boosts conviction).
5. Level quality (TESLA node or Premium class) is high.
6. Momentum alignment (recent 2–3 bars in the same direction).
Only when confluence ≥ your threshold and confidence ≥ 0.5 (scaled by sensitivity) will a Buy/Sell arrow print. Cooldown prevents rapid repeats.
Inputs (key ones)
⦁ PO3 Settings: range size, auto-expansion toggle, expansion sensitivity, liquidity band distance.
⦁ Goldbach Mathematics: precision limit, exact spacing rules, spacing for OB/LV classes.
⦁ Trading Signals: master toggle, sensitivity, min reliability, confluence required, cooldown, min distance to level, markers on/off.
⦁ Tesla Vortex / ICT: enable Vortex, sensitivity; enable AMD/IPDA analysis and lookback.
⦁ Time & Volume: enable Goldbach time and weighting; volume lookback; liquidity-pool detection.
⦁ Display: show historical/future projections, number of future bars, labels, path/phase overlays.
⦁ Colors: full palette per class/context (premium/discount/OB/LV/Tesla/time/volume, buy/sell/goldbach hit).
Alerts Included
⦁ Signals: “BUY Signal Generated”, “SELL Signal Generated”
⦁ Level Interactions: “Goldbach Level Hit”; “Near Goldbach Level”; “Tesla Vortex Node”; “Premium Level Alert”
⦁ PO3: “PO3 Upper Break”, “PO3 Lower Break”, “PO3 Range Expansion”
⦁ State Changes: “Tesla Vortex Phase Change”
⦁ Context: “Liquidity Sweep Imminent”, “Strong Time Confluence”
You can wire these to webhooks or notifications.
Suggested Workflow
1. Choose PO3 size that matches your instrument’s volatility; keep Auto-Expansion ON initially.
2. Set confluence threshold (start at 3–4) and cooldown (e.g., 10 bars).
3. Keep Time and Volume modules ON for additional reliability weighting.
4. Use arrows as filters, not blind entries—confirm with your execution plan and risk rules.
5. Prefer signals near Premium/Discount TESLA nodes that also show time confluence and supportive volume.
Practical Notes & Limitations
⦁ The mathematical framework is deterministic, but market execution is not—always manage risk.
⦁ Future projections and heavy labeling can be resource-intensive; tune visibility if performance drops.
⦁ If a market is extremely illiquid or gap-prone, spacing/filters may hide many levels (by design).
Disclaimer
This script is for educational and research purposes only and is not financial advice. Trading involves risk. You are responsible for your own decisions.

TRAPPER TRENDLINES — PRICEDraws dynamic trendlines on price by connecting the two most recent confirmed swing points (highs to highs for resistance, lows to lows for support). Swings are defined with a symmetric left/right pivot window. Old anchors are ignored so lines stay attached to current structure. Optional break alerts are included.
How it works (plain language)
Pivots: A bar is a swing high (or low) only if it’s the most extreme point compared with a set number of bars on the left and the right.
Lines:
Support connects the last two confirmed swing lows.
Resistance connects the last two confirmed swing highs.
Lines can be extended right only or both left & right (toggle).
Recency filter: Only swings within the last N bars are kept. This avoids anchoring to very old pivots far from current price.
Alerts: Optional alerts fire when price closes above resistance or below support.
Inputs
Auto Settings
Auto pivot size by chart timeframe: When ON, the script picks a pivot size suitable for the current timeframe (you can scale it with Auto pivot multiplier). When OFF, the manual left/right inputs are used.
Auto pivot multiplier: Scales the auto pivot size (e.g., 1.5 makes pivots stricter).
Manual Pivots
Pivot Left / Pivot Right: Bars to the left/right required to confirm a swing. Example: Left=50 & Right=50 keeps only major swings.
Recency Filter
Use last N bars for pivots: Swings older than this window are discarded so trendlines stay relevant to current price.
Style
Support/Resistance color: Line colors.
Extend Left & Right: When ON, both endpoints extend; when OFF, lines extend to the right only.
Alerts
Enable Break Alerts: When ON, alert conditions are exposed:
Price: Break Up — close above resistance.
Price: Break Down — close below support.
Suggested settings
Higher timeframes (4H / 1D / 1W):
Manual: Pivot Left = 50, Pivot Right = 50, Use last N bars = 400–800.
Or enable Auto with Auto pivot multiplier = 1.0–1.5.
Intraday (15m / 30m / 1H):
Manual: Pivot Left = 30, Pivot Right = 30, Use last N bars = 300–500.
Or enable Auto with multiplier ≈ 1.0–1.2.
Pairing with RSI for confluence/divergence
This tool is designed to pair with a companion TRAPPER TRENDLINES — RSI (or any RSI trendline script):
To mirror swings, set RSI Pivot Lookback equal to the price Pivot Left/Right you use here.
Example: Price = 50/50 → RSI Pivot Lookback = 50.
Keep RSI at Length 14 with 70/30 channel for clarity.
Confluence: Price holds/rejects at a trendline while RSI trendline agrees.
Divergence: Price prints a higher high (resistance line rising) while RSI prints a lower high (RSI resistance line falling), or vice-versa for lows. Matching pivot windows makes these relationships clear and reduces false signals.
Reading the signals
Trendline touch/hold: Potential reaction area; wait for follow-through.
Break Up / Break Down (alerts): Close beyond the line. Consider retest behavior, higher-timeframe context, and volume/RSI confirmation.
Notes & limitations
Pivots require future bars to confirm (by design). Lines update as pivots confirm.
“Use last N bars” purposely ignores very old swings. Increase this value if you need legacy structure.
Lines are based on two most recent confirmed pivots per side; rapidly changing markets can replace anchors as new swings confirm.
This is a visual/analytical tool. No strategy entries/exits or performance claims are provided.
Compliance
This script is for educational purposes only and does not constitute financial advice. Trading involves risk. Past results do not guarantee future outcomes. No promises of profit, accuracy, or performance are made.
Alerts (titles/messages)
Price: Break Up — “Price broke above resistance trendline.”
Price: Break Down — “Price broke below support trendline.”
Quick start
Add the indicator to your chart.
Choose Auto or set Pivot Left/Right manually.
Set Use last N bars for how far back to consider swings.
Toggle Extend Left & Right to your preference.
(Optional) Add your RSI trendline indicator and match Pivot Lookback with your price pivot size for clean confluence/divergence.
Enable alerts if you want notifications on breaks.

Pivot Points Strategy🟢 It enters long trades near support zones (S1–S3)
🔴 It enters short trades near resistance zones (R1–R3)
🎯 All positions aim to exit at the central pivot (P).
🚫 It avoids trading when price crosses the pivot during the bar.
🔄 Strategy resets when a new pivot is calculated.
📊 Supports pyramiding up to 5 positions for scaling in.

Keylevels [KAWS]Overview
The Keylevels Indicator is designed to provide traders with a clear and structured view of important market reference points. It automatically detects and plots session highs and lows, weekly and monthly levels, as well as the previous day’s range. These levels are presented directly on the chart as dynamic lines with optional text labels, offering a consistent framework for understanding price action across multiple time horizons.
Understanding the Concepts
What are Key Levels?
Key levels are significant price points that often serve as reference markers in market activity. They represent areas where the market has previously established boundaries (highs and lows) within sessions, days, weeks, or months. Such levels can highlight where price has repeatedly reacted, providing insight into areas of potential importance.
Why Sessions Matter
Financial markets operate globally, and trading sessions (Asia, London, New York) reflect the activity of different regions. Each session produces distinct highs and lows that can serve as key markers for subsequent price behavior. By capturing these levels automatically, the indicator helps visualize how markets transition from one trading phase to another.
Higher Timeframe Levels
Weekly and monthly highs and lows, as well as the previous day’s range, provide broader structural reference points. These levels are often used to assess whether the market is respecting or breaking significant boundaries over time.
How the Indicator Works
The indicator automatically tracks and plots:
Session Levels: Highs and lows of the Asia, London, and New York sessions.
Session Open Price: A clear reference line marking the opening price of a chosen session.
Daily Levels: Previous day’s high and low, updated at the start of each new day.
Weekly Levels: High and low of the current week, with automatic reset each new week.
Monthly Levels: High and low of the current month, updated dynamically.
Each level is displayed with customizable line styles, colors, and labels. Labels can include text only or also display the exact price, depending on user preference. The indicator further supports the option to extend lines into the future, allowing for ongoing visibility of these reference points.
Customization Options
Display Control: Enable or disable specific sessions, daily, weekly, or monthly levels.
Visual Styling: Adjust line colors, thickness, and style (solid, dashed, dotted).
Labels: Choose whether to display text, include price information, and set text size.
Session Settings: Define your preferred timezone and session open times for accuracy across global markets.
Line Extension: Decide whether levels should extend into the future or stop when broken.
Important Considerations
This indicator is a technical reference tool. It does not generate buy or sell signals but instead provides structural context by highlighting where the market has established significant levels. As with any technical tool, it is most effective when integrated into a broader trading framework that includes market structure, trend analysis, and risk management.

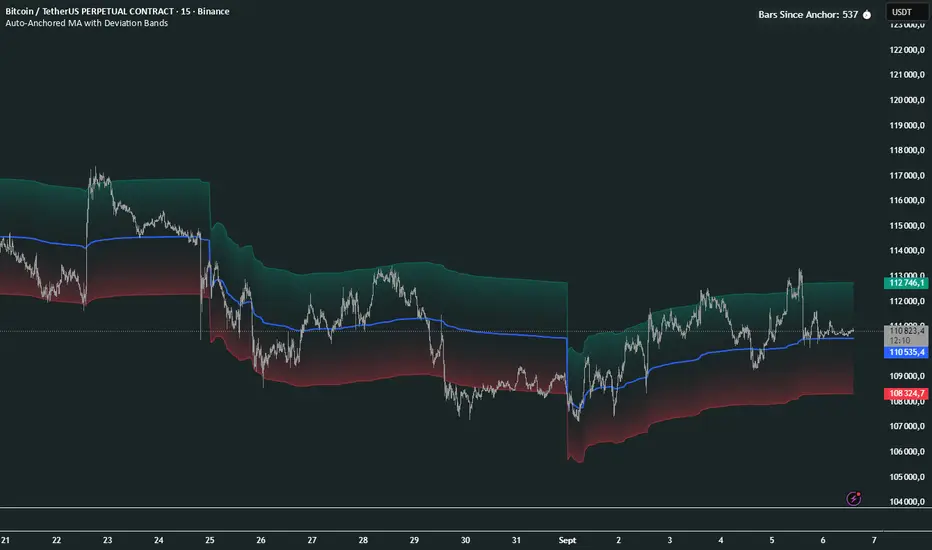
Auto-Anchored MA with Deviation BandsAuto-Anchored MA with Deviation Bands
✨ Features
📈 Auto-Anchored MA: Calculates moving averages (EMA, SMA, EWMA, WMA, VWAP, TEMA) anchored to user-defined periods (Hour, Day, Week, etc.).📏 Deviation Bands: Plots upper/lower bands using Percentage or Standard Deviation modes for volatility analysis.⚙️ Customizable Timeframes: Choose anchor periods from Hour to Year for flexible trend analysis.🎨 Visuals: Displays MA and bands with gradient fills, customizable colors, and adjustable display bars.⏱️ Countdown Table: Shows bars since the last anchor for easy tracking.🛠️ Smoothing: Applies smoothing to bands for cleaner visuals.
🛠️ How to Use
Add to Chart: Apply the indicator on TradingView.
Configure Inputs:
Anchor Settings: Select anchor period (e.g., Day, Week).
MA Settings: Choose MA type (e.g., VWAP, TEMA).
Deviation Settings: Set deviation mode (Percentage/Std Dev) and multipliers.
Display Settings: Adjust bars to display, colors, and gradient fill.
Analyze: View MA, deviation bands, and countdown table on the chart.
Track Trends: Use bands as dynamic support/resistance and monitor anchor resets.
🎯 Why Use It?
Dynamic Analysis: Auto-anchors MA to key timeframes for adaptive trend tracking.
Volatility Insight: Deviation bands highlight potential breakouts or reversals.
Customizable: Tailor MA type, timeframe, and visuals to your trading style.
User-Friendly: Clear visuals and countdown table simplify analysis.
📝 Notes
Ensure sufficient bars for accurate MA and deviation calculations.
Gradient fill enhances readability but can be disabled for simplicity.
Best used with complementary indicators like RSI or Bollinger Bands for robust strategies.
Happy trading! 🚀📈
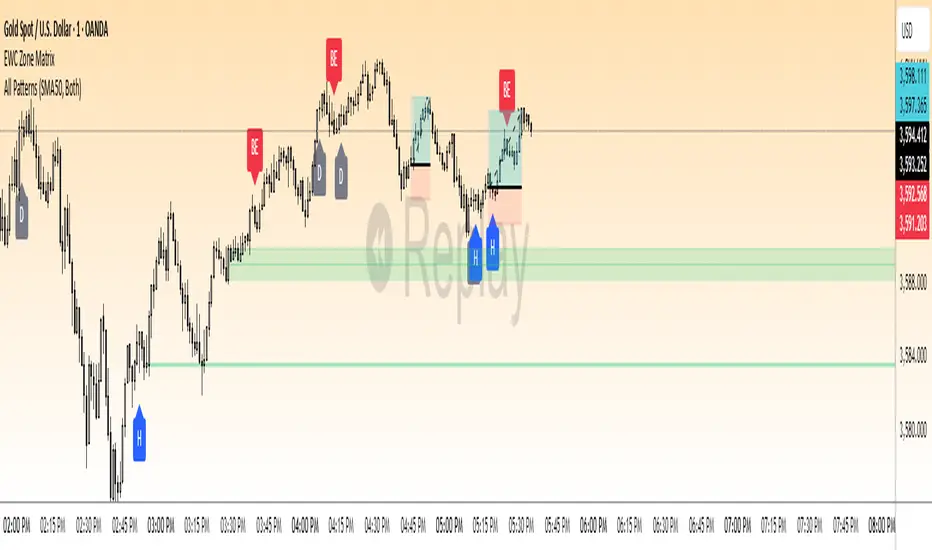
EWC Zone Matrix📌 EWC Precision Blocks
🔎 Overview
EWC Precision Blocks is a professional market analysis tool designed to highlight high-probability trading zones on the chart. Instead of relying on lagging signals, this indicator maps out Alpha Zones (bullish) and Beta Zones (bearish), allowing traders to identify potential market reaction areas with clarity.
The algorithm is built to adapt across Scalp, Swing, and Position trading modes, making it flexible for short-term intraday traders as well as long-term investors.
⚡ Key Features
Multi-Mode Detection – Switch between Scalp, Swing, or Position modes depending on your trading style.
EWC Alpha Zone (Bullish Detection) – Highlights areas where the market may find strong upward momentum.
EWC Beta Zone (Bearish Detection) – Highlights areas where the market may face downward pressure.
Zone Break Tracking – Visualizes when a zone has been invalidated or broken.
Body-Based Detection – Option to base calculations on candle bodies instead of wicks for precision.
Zone Flips – Displays polarity shifts when zones transition from supportive to resistive behavior (and vice versa).
Custom Styling – Full control of zone and break colors for clear chart visualization.
🎯 How to Use
Select Your Mode
Scalp → Designed for fast intraday moves.
Swing → Medium-term setups, ideal for session trading.
Position → Long-term outlook, suitable for investors.
Watch the Alpha Zones
Highlighted bullish areas can serve as potential support or accumulation zones.
Watch the Beta Zones
Highlighted bearish areas may act as resistance or distribution zones.
Monitor Breaks & Flips
Alpha Breaks → Bullish zones failing.
Beta Breaks → Bearish zones failing.
Zone Flips → Polarity changes, often powerful signals.
🛠 Inputs & Customization
EWC Mode → Choose Scalp, Swing, or Position.
Show Last Alpha Zone → Set how many bullish zones to display.
Show Last Beta Zone → Set how many bearish zones to display.
Body-Based Detection → Toggle candle body vs. wick calculation.
EWC Alpha Zone / Beta Zone Styling → Customize zone colors.
Alpha Break / Beta Break Colors → Adjust break visuals.
Show Zone Flips → Enable/disable historical polarity labels.
Status Bar → Display inputs directly in the chart status line.
📈 Best Practices
Works across all timeframes and markets (forex, crypto, indices, stocks).
Combine with your existing strategy for confirmation.
Use in alignment with higher timeframe structure for maximum accuracy.
⚠ Disclaimer
EWC Precision Blocks is a market visualization tool provided for educational purposes only. It does not provide financial advice, signals, or guaranteed results. Always do your own research and manage risk responsibly.
🔹 About EWC
EWC (EastWave Capital) is dedicated to developing professional-grade trading tools and strategies for traders across forex, crypto, commodities, and indices. With over a decade of combined market experience, our mission is to empower traders with precision, clarity, and confidence in their decision-making.
EWC Precision Blocks is one of our flagship tools, reflecting our commitment to innovation, transparency, and trader-focused solutions.
📌 Published by Usama Manzoor — Founder of EastWave Capital (EWC)
1 minute ago
Release Notes
EWC Precision Blocks
The EWC Alpha-Beta Zone Detector is designed for traders who value clarity, precision, and flexibility in their chart analysis.
By mapping out Alpha (strength) and Beta (weakness) zones, this script provides a structured way to understand how price reacts to key levels in the market.
This indicator is built on price action principles and market structure analysis, avoiding clutter and focusing on the essentials traders need. Whether you are scalping on lower timeframes or analyzing swing opportunities, the Alpha-Beta Zone Detector adapts to your style.
🔹 Core Features
Alpha & Beta Zones → Detects bullish and bearish strength zones in real time.
Highlight Last Zone → Focus on the most recent Alpha/Beta zone for clarity.
Zone Flip Detection → Identifies polarity changes when zones shift from support to resistance or vice versa.
Body-Based Detection → Option to base calculations on candle bodies instead of wicks for more accuracy.
Flexible Timeframe Sensitivity → Switch between short, intermediate, and long-term detection modes.
Custom Zone Styling → Adjust colors, opacity, and line thickness for both Alpha and Beta zones.
Break Visualization → Display breaks of Alpha and Beta zones for additional confirmation.
Market Versatility → Works seamlessly on Forex, Crypto, Indices, Commodities, and Stocks.
🔹 Why Traders Use It
Provides a clear visual guide to market decision zones.
Helps traders refine entries, stop-loss placement, and take-profit levels.
Adapts to multiple trading styles → scalpers, intraday traders, and swing traders.
Keeps charts clean and professional without overloading with unnecessary signals.
⚠️ Disclaimer:
This script is created for educational and informational purposes only. It does not provide financial advice. Trading involves risk; always manage your risk responsibly and conduct your own analysis before entering any position.
EWC Precision Blocks📌 EWC Precision Blocks
🔎 Overview
EWC Precision Blocks is a professional market analysis tool designed to highlight high-probability trading zones on the chart. Instead of relying on lagging signals, this indicator maps out Alpha Zones (bullish) and Beta Zones (bearish), allowing traders to identify potential market reaction areas with clarity.
The algorithm is built to adapt across Scalp, Swing, and Position trading modes, making it flexible for short-term intraday traders as well as long-term investors.
⚡ Key Features
Multi-Mode Detection – Switch between Scalp, Swing, or Position modes depending on your trading style.
EWC Alpha Zone (Bullish Detection) – Highlights areas where the market may find strong upward momentum.
EWC Beta Zone (Bearish Detection) – Highlights areas where the market may face downward pressure.
Zone Break Tracking – Visualizes when a zone has been invalidated or broken.
Body-Based Detection – Option to base calculations on candle bodies instead of wicks for precision.
Zone Flips – Displays polarity shifts when zones transition from supportive to resistive behavior (and vice versa).
Custom Styling – Full control of zone and break colors for clear chart visualization.
🎯 How to Use
Select Your Mode
Scalp → Designed for fast intraday moves.
Swing → Medium-term setups, ideal for session trading.
Position → Long-term outlook, suitable for investors.
Watch the Alpha Zones
Highlighted bullish areas can serve as potential support or accumulation zones.
Watch the Beta Zones
Highlighted bearish areas may act as resistance or distribution zones.
Monitor Breaks & Flips
Alpha Breaks → Bullish zones failing.
Beta Breaks → Bearish zones failing.
Zone Flips → Polarity changes, often powerful signals.
🛠 Inputs & Customization
EWC Mode → Choose Scalp, Swing, or Position.
Show Last Alpha Zone → Set how many bullish zones to display.
Show Last Beta Zone → Set how many bearish zones to display.
Body-Based Detection → Toggle candle body vs. wick calculation.
EWC Alpha Zone / Beta Zone Styling → Customize zone colors.
Alpha Break / Beta Break Colors → Adjust break visuals.
Show Zone Flips → Enable/disable historical polarity labels.
Status Bar → Display inputs directly in the chart status line.
📈 Best Practices
Works across all timeframes and markets (forex, crypto, indices, stocks).
Combine with your existing strategy for confirmation.
Use in alignment with higher timeframe structure for maximum accuracy.
⚠ Disclaimer
EWC Precision Blocks is a market visualization tool provided for educational purposes only. It does not provide financial advice, signals, or guaranteed results. Always do your own research and manage risk responsibly.
🔹 About EWC
EWC (EastWave Capital) is dedicated to developing professional-grade trading tools and strategies for traders across forex, crypto, commodities, and indices. With over a decade of combined market experience, our mission is to empower traders with precision, clarity, and confidence in their decision-making.
EWC Precision Blocks is one of our flagship tools, reflecting our commitment to innovation, transparency, and trader-focused solutions.
📌 Published by Usama Manzoor — Founder of EastWave Capital (EWC)
Valid Monthly LevelsValid Monthly Levels (No Sweeps) + Smart Labels
This tool automatically plots the highs and lows of each completed monthly candle and tracks their validity in real time. A level is considered valid until it has been swept (price trades strictly beyond that high or low). Once swept, the line and label can either be removed or dimmed depending on your settings.
Key features:
Monthly highs and lows: Each month’s range is marked with horizontal levels that extend forward.
Valid vs. swept logic: Levels are only valid until breached; swept levels can be hidden or kept as dotted/grey lines.
Smart labels: Each level is labeled with the month and year (e.g., Sep ’25 H/L). On higher timeframes, labels sit at the candle; on lower timeframes, labels automatically shift to the right edge so they don’t disappear off-screen.
Customizable appearance: Choose colors for highs, lows, and swept levels; adjust line styles; and limit how many past months are shown.
Clutter control: Cap the maximum number of labels, so your chart stays readable even on small intraday timeframes.
This indicator is useful for traders who track monthly supply/demand extremes, liquidity sweeps, and higher-timeframe context when executing on lower timeframes.

ZoneRadar by Chaitu50cZoneRadar
ZoneRadar is a tool designed to detect and visualize hidden buy or sell pressures in the market. Using a Z-Score based imbalance model, it identifies areas where buyers or sellers step in with strong momentum and highlights them as dynamic supply and demand zones.
How It Works
Z-Score Imbalance : Calculates statistical deviations in order flow (bull vs. bear pressure).
Buy & Sell Triggers: Detects when imbalances cross predefined thresholds.
Smart Zones: Marks potential buy (green) or sell (red) zones directly on your chart.
Auto-Merge & Clean: Overlapping or noisy zones are automatically merged to keep the chart clean.
History Control: Keeps only the most recent and strongest zones for focus.
Key Features
Customizable Z-Score level and lookback period
Cooldown filter to avoid over-signaling
Smart zone merging to prevent clutter
Adjustable price tolerance for merging overlapping zones (ticks)
Extend zones into the future with right extensions
Fully customizable colors and display settings
Alert conditions for Buy Pressure and Sell Pressure
Why ZoneRadar?
Simplifies complex order flow into clear, tradable zones
Helps identify high-probability reversal or continuation levels
Avoids noise by keeping only the cleanest zones
Works across any timeframe or market (stocks, futures, forex, crypto)
Disclaimer
This tool is designed for educational and informational purposes only. It does not provide financial advice. Always test on demo and combine with your own trading strategy.


Intraday Auto Support/Resistance LevelsIntraday Auto Support / Resistance Levels
Welcome to a powerful, automated tool designed for intraday traders. This indicator dynamically identifies and plots key Support and Resistance (S/R) levels directly onto your chart at the start of each new trading session. By leveraging historical pivot points, it eliminates the guesswork and manual drawing, providing you with clear, actionable price levels to enhance your trading strategy. Focus on your execution while the indicator handles the analysis.
________________________________________
How It Works
The indicator operates through a sophisticated, multi-step process:
Pivot Identification: Using Tradingview’s built- in ta.pivothigh() and ta.pivotlow() functions, the script scans a user-defined number of bars back (the "Swing Level") to identify significant price swing highs and lows.
Data Collection: All identified pivot points are collected into a central array, creating a pool of potential S/R levels.
Session Start: At the opening of each new trading day (determined by the daily timestamp), the indicator processes this pool of prices.
Filtering & Sorting: The pivot points are split into two groups: those above the day's open price (potential Resistance) and those below (potential Support). A smart filtering algorithm then selects the most relevant levels based on your "Min Distance" setting, ensuring levels are not too close to each other and are statistically significant.
Dynamic Plotting: The strongest Support (S1, S2, S3...) and Resistance (R1, R2, R3...) levels are drawn as dotted lines extending throughout the trading session.
Adaptive Management: The script intelligently manages the lines. If price convincingly breaks through a key level (e.g., breaking above R1), the indicator may plot the next higher level (R2, R3) while removing a less relevant level on the opposite side of the market, keeping the chart clean and focused on the most pertinent zones.
________________________________________
Key Features & Benefits
• Saves Time: Get professional-level analysis instantly, eliminating the need for manual
line drawing.
• Removes Emotion: All levels are determined objectively by the algorithm, not by
subjective trader bias.
• Enhances Strategy: Provides clear visual cues for potential entry, exit, stop-loss, and
take-profit points.
• Fully Customizable: Tailor the indicator's behavior to match your specific trading style and
instrument volatility.
• Clean Visuals: Plots clear, labeled lines with customizable colors and width for an
uncluttered chart.
• Data Window Output: Displays the exact price value for each level in the Data Window,
enabling precise planning and alert setting.
________________________________________
Input Settings: Fine-Tune Your Levels
The indicator offers a comprehensive set of options for fine-tuning its behavior.
• Adjust Distance Between Lines (%): Controls the minimum percentage distance required
between consecutive S/R levels. A lower value plots more lines, while a higher value plots
fewer, more significant levels.
• Adjust Swing Level: This is the core sensitivity setting. A lower value finds more frequent,
minor pivots, while a higher value identifies major, more significant swings.
• Set Line Width: Adjust the visual thickness of the Support/Resistance lines.
• Show Label Side: Choose to place the level labels (e.g., "R1", "S2") on the "Left" or "Right"
side of the chart.
• Set Up Line Color: Customize the color for all Resistance (R) lines.
• Set Down Line Color: Customize the color for all Support (S) lines.
________________________________________
Limitations
• Repainting: While historical levels are fixed, the most recent pivots can change until a
new swing point is confirmed. This can cause the most recent plotted level to "repaint"
slightly.
• Timeframe Dependency: This indicator is optimized for intraday timeframes. Using it on
timeframes longer than 1D may not yield the intended results as the daily session break
logic is a core part of its function.
• No Predictive Power: The algorithm is based on past price action. It does not account for
future fundamentals, news events, or market-moving announcements.

Smart Structure Breaks & Order BlocksOverview (What it does)
The indicator “Smart Structure Breaks & Order Blocks” detects market structure using swing highs and lows, identifies Break of Structure (BOS) events, and automatically draws order blocks (OBs) from the origin candle. These zones extend to the right and change color/outline when mitigated or invalidated. By formalizing and automating part of discretionary analysis, it provides consistent zone recognition.
Main Components
Swing Detection: ta.pivothigh/ta.pivotlow identify confirmed swing points.
BOS Detection: Determines if the recent swing high/low is broken by close (strict mode) or crossover.
OB Creation: After a BOS, the opposite candle (bearish for bullish BOS, bullish for bearish BOS) is used to generate an order block zone.
Zone Management: Limits the number of zones, extends them to the right, and tracks tagged (mitigated) or invalidated states.
Input Parameters
Left/Right Pivot (default 6/6): Number of bars required on each side to confirm a swing. Higher values = smoother swings.
Max Zones (default 4): Maximum zones stored per direction (bull/bear). Oldest zones are overwritten.
Zone Confirmation Lookback (default 3): Ensures OB origin candle validity by checking recent highs/lows.
Show Swing Points (default ON): Displays triangles on swing highs/lows.
Require close for BOS? (default ON): Strict BOS (close required) vs loose BOS (line crossover).
Use candle body for zones (default OFF): Zones drawn from candle body (ON) or wick (OFF).
Signal Definition & Logic
Swing Updates: Latest confirmed pivots update lastHighLevel / lastLowLevel.
BOS (Break of Structure):
Bullish – close breaks last swing high.
Bearish – close breaks last swing low.
Only one valid BOS per swing (avoids duplicates).
OB Detection:
Bullish BOS → previous bearish candle with lowest low forms the OB.
Bearish BOS → previous bullish candle with highest high forms the OB.
Zones: Bull = green, Bear = red, semi-transparent, extended to the right.
Zone States:
Mitigated: Price touches the zone → border highlighted.
Invalidated:
Bull zone → close below → turns red.
Bear zone → close above → turns green.
Chart Appearance
Swing High: red triangle above bar
Swing Low: green triangle below bar
Bull OB: green zone (border highlighted on touch)
Bear OB: red zone (border highlighted on touch)
Invalid Zones: Bull zones turn reddish, Bear zones turn greenish
Practical Use (Trading Assistance)
Trend Following Entries: Buy pullbacks into green OBs in uptrends, sell rallies into red OBs in downtrends.
Focus on First Touch: First mitigation after BOS often has higher reaction probability.
Confluence: Combine with higher timeframe trend, volume, session levels, key price levels (previous highs/lows, VWAP, etc.).
Stops/Targets:
Bull – stop below zone, partial take profit at swing high or resistance.
Bear – stop above zone, partial take profit at swing low or support.
Parameter Tuning (per market/timeframe)
Pivot (6/6 → 4/4/8/8): Lower for scalping (3–5), medium for day trading (5–8), higher for swing trading (8–14). Increase to reduce noise.
Strict Break: ON to reduce false breaks in ranging markets; OFF for earlier signals.
Body Zones: ON for assets with long wicks, OFF for cleaner OBs in liquid instruments.
Zone Confirmation (default 3): Increase for stricter OB origin, fewer zones.
Max Zones (default 4 → 6–10): Increase for higher volatility, decrease to avoid clutter.
Strengths
Standardizes BOS and OB detection that is usually subjective.
Tracks mitigation and invalidation automatically.
Adaptable: allows body/wick zone switching for different instruments.
Limitations
Pivot-based: Signals appear only after pivots confirm (slight lag).
Zones reflect past balance: Can fail after new events (news, earnings, macro data).
Range-heavy markets: More false BOS; consider stricter settings.
Backtesting: This script is for drawing/visual aid; trading rules must be defined separately.
Workflow Example
Identify higher timeframe trend (4H/Daily).
On lower TF (15–60m), wait for BOS and new OB.
Enter on first mitigation with confirmation candle.
Stop beyond zone; targets based on R multiples and swing points.
FAQ
Q: Why are zones invalidated quickly?
A: Flow reversal after BOS. Adjust pivots higher, enable Strict mode, or switch to Body zones to reduce noise.
Q: What does “tagged” mean?
A: Price touched the zone once = mitigated. Implies some orders in that zone may have been filled.
Q: Body or Wick zones?
A: Wick zones are fine in clean markets. For volatile pairs with long wicks, body zones provide more realistic areas.
Customization Tips (Code perspective)
Zone storage: Currently ring buffer ((idx+1) % zoneLimit). Could prioritize keeping unmitigated zones.
Automated testing: Add strategy.entry/exit for rule-based backtests.
Multi-timeframe: Use request.security() for higher timeframe swings/BOS.
Visualization: Add labels for BOS bars, tag zones with IDs, count touches.
Summary
This indicator formalizes the cycle Swing → BOS → OB creation → Mitigation/Invalidation, providing consistent structure analysis and zone tracking. By tuning sensitivity and strictness, and combining with higher timeframe context, it enhances pullback/continuation trading setups. Always combine with proper risk management.

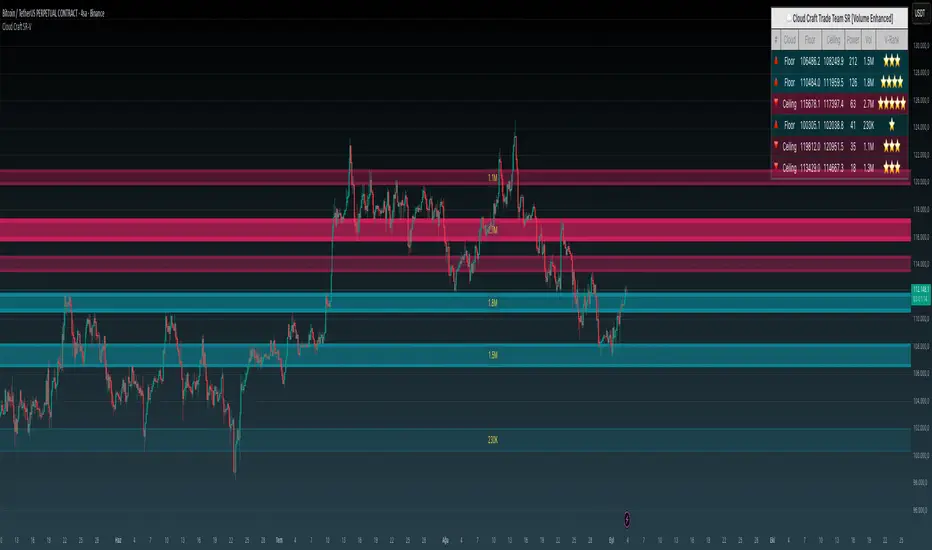
Cloud Craft SR [Volume Enhanced Edition]Cloud Craft SR - Advanced Support & Resistance System
Short Description:
Advanced cloud-based support & resistance indicator with volume analysis. Features dynamic zones, multi-timeframe analysis, and adaptive visual themes for different chart backgrounds.
Full Description:
Cloud Craft SR is an advanced support and resistance detection system that combines price action analysis with volume dynamics to identify high-probability trading zones.
🎯 Key Features:
Smart Zone Detection: Automatically identifies and ranks support/resistance zones based on historical price action
Volume Integration: Enhanced zone strength calculation using volume-weighted analysis
Multi-Timeframe Analysis: Configurable timeframe selection for deeper market structure analysis
Adaptive Visual Themes: Three color schemes optimized for white, black, and gray chart backgrounds
Dynamic Cloud Visualization: Visual representation of zone strength through opacity and border width
Real-Time Information Panel: Live zone data with volume rankings and strength metrics
Breakout Detection: Volume-confirmed breakout signals for enhanced reliability
📊 How Power & Volume Are Calculated:
Power Calculation:
Power represents the strength of each support/resistance zone based on:
Pivot Points: Number of price reversals at the zone (each pivot = 20 base points)
Touch Count: How many times price has tested the zone
Volume Weight: If volume analysis is enabled, zones with higher volume get multiplied strength
Example:
Zone has 3 pivot points = 60 base points
Price touched the zone 5 times = +5 points
Total base strength = 65
If volume at this zone is 1.5x average = 65 × 1.5 = 97.5 Power
Display Power = 97.5 ÷ 10 = 9.8 (shown as 10 in panel)
Volume Integration:
Collects volume data at each pivot point
Compares zone volume to average volume
Applies multiplier (default 1.5x) to strengthen high-volume zones
Volume Rank shows relative volume importance (⭐ to ⭐⭐⭐⭐⭐)
Visual Representation:
Higher Power = Thicker borders
Higher Volume = Less transparency (more solid appearance)
Top zones are displayed with strongest at top of panel
⚙️ Customization Options:
Cloud Timeframe (3min to Monthly)
Analysis Depth (100-500 bars)
Zone Sensitivity Control (2-12%)
Strength Filter Settings (min touches required)
Visual Style Selection
Volume Analysis Toggle
Panel Position & Theme
📈 How It Works:
The indicator analyzes historical price pivots to identify areas where price has repeatedly found support or resistance. These zones are then weighted by volume activity to determine their relative strength. Stronger zones appear more prominent visually, helping traders quickly identify key levels.
💡 Best Use Cases:
Identifying key support/resistance levels for entry/exit points
Confirming breakouts with volume analysis
Setting stop-loss and take-profit levels
Multi-timeframe confluence analysis
Risk management and position sizing
Default Settings Optimized For: 4H timeframe analysis with 250-bar lookback period
Why Protected Source?
This indicator uses proprietary algorithms for:
- Advanced pivot detection with volume weighting
- Dynamic zone strength calculation combining multiple factors
- Adaptive visual rendering based on volume and strength metrics
Machine Learning-Inspired Supply & Demand Zones [AlgoPoint]This indicator is a Smart Supply & Demand Zone tool, developed with principles inspired by Machine Learning (ML). It intelligently filters out market noise, allowing you to focus only on the most significant zones where institutional order flow is likely present.
💡 How It Works: Why Is This Indicator "Smart"?
Unlike traditional indicators that only measure simple price movements, this script uses an algorithm that asks the same critical questions an experienced market analyst would to qualify a zone:
- 1. Price Imbalance: How fast and aggressively did the price leave the zone? Our algorithm measures the body size of the "departure candle" relative to the current market volatility (ATR). A zone is only considered if it was formed by an explosive move that is statistically significant, indicating a major imbalance between buyers and sellers.
- 2. Volume Confirmation: Did the "smart money" participate in this move? The script checks if the volume on the departure candle was significantly higher than the recent average volume. A spike in volume confirms that the move was backed by institutional interest, adding strength and validity to the zone.
- 3. Valid Pivot Structure: Did the zone originate from a meaningful swing high or low? The algorithm first identifies a valid pivot structure, ensuring that zones are not drawn from insignificant or random price fluctuations.
Only when a potential zone passes these three critical tests—our "quality filter"—is it drawn on your chart.
🚀 Features & How to Use
Using the indicator is straightforward. You will see two primary types of boxes on your chart:
* 🟥 Red Box (Supply Zone): An area of potential resistance where selling pressure is likely to be strong. Look for potential shorting opportunities as the price approaches this zone.
* 🟩 Green Box (Demand Zone): An area of potential support where buying pressure is likely to be strong. Look for potential long opportunities as the price pulls back into this zone.
Dynamic Zone Management
This indicator is not static; it lives and breathes with the market:
- Fresh Zone: A newly formed zone appears in its full, vibrant color. These are the highest-probability zones as they have not yet been re-tested.
- Broken / Flipped Zone: You have full control over what happens when a zone is broken! In the settings, you can choose:
- Delete Zone: The zone will be removed completely when the price closes through it.
- Show as Broken (Flip): When broken, the zone will turn gray, stop extending, and remain on your chart. This is extremely useful for identifying Support/Resistance Flips, where a broken demand zone becomes new resistance, or a broken supply zone becomes new support.
⚙️ Settings & Customization
Fine-tune the indicator to match your personal trading style via the settings menu:
- Breakout Behavior: The most powerful feature. Choose between Delete Zone and Show as Broken (Flip) to customize your chart.
- Zone Finding Logic: Control the indicator's sensitivity.
- Selective: Requires both strong imbalance and high volume. Finds fewer, but higher-quality, zones.
- Moderate: Requires either strong imbalance or high volume. Finds more potential zones.
- Sensitivity Settings: Adjust the ATR Multiplier and Volume Multiplier to make the criteria for a "strong" zone stricter or looser.

Unfilled ImbalancesUNFILLED IMBALANCES TRACKER - IDENTIFY HIGH-PROBABILITY REVERSAL ZONES
This advanced indicator automatically detects and tracks unfilled price imbalances (Fair Value Gaps/FVGs) between candle bodies, providing traders with crucial levels where price is likely to return.
METHODOLOGY
This indicator employs an approach to imbalance detection that differs from standard FVG indicators:
1. Body-to-Body Gap Detection: Unlike typical FVG indicators that use wicks, this system exclusively tracks gaps between candle bodies, filtering out noise and focusing on the most significant price inefficiencies.
2. Dynamic Partial Fill Tracking: Our unique algorithm continuously monitors and adjusts imbalance zones as they're partially filled, showing exactly how much of each gap remains unfilled in real-time. This feature helps traders identify the strongest remaining levels.
3. Dual Fill Detection Logic: Proprietary fill detection offers two distinct modes - Distal (gap filled when touched) and Through (requires complete price movement through the entire gap), allowing adaptation to different market behaviors.
KEY FEATURES
Real-Time Imbalance Detection
Identifies body-to-body gaps between consecutive candles
Tracks both bullish and bearish imbalances
Automatically removes filled imbalances from the chart
Advanced Fill Detection Modes
Distal Mode: Imbalance considered filled when price touches the near edge
Through Mode: Requires price to completely trade through the gap
Body Fill Option: Requires candle body (not just wick) to enter the gap zone
Partial Fill Visualization
Watch imbalances shrink in real-time as price partially fills them
Visual representation shows exact percentage of gap remaining
Critical for position sizing and risk management
Flexible Display Options
Full Box Mode: Shows complete imbalance zones
Line Mode: Displays only critical edge levels for cleaner charts
Customizable visual parameters (colors, transparency, line thickness)
Smart Extension Features
Auto-extends visual elements to current price bar
Optional extension into future (0-500 bars)
Statistics table showing active imbalances count and fill rates
TRADING METHODOLOGY
Unfilled imbalances represent areas where price moved too quickly, leaving behind inefficiencies that markets tend to revisit. This indicator helps identify:
High-probability entry zones for trend continuation trades
Logical take profit targets at unfilled gaps
Stop loss placement beyond strong imbalance zones
Market structure breaks when key imbalances are filled
Supply and demand zone identification
HOW TO USE
Apply the indicator to any timeframe (works best on 15m and above)
Configure fill detection mode based on your trading style
Watch for price approaching unfilled imbalance zones
Use partial fill information to gauge zone strength
Combine with your existing strategy for confirmation
TARGET AUDIENCE & BEST PRACTICES
This tool is designed for traders who understand price action and market structure. It works best on:
Liquid instruments with consistent volume
Trending markets where imbalances are more likely to be revisited
Higher timeframes for more reliable signals
LIMITATIONS & CONSIDERATIONS
Imbalances may not always be filled, especially in strong trending markets
Performance varies across different market conditions and instruments
Should be used in conjunction with other analysis methods, not as a standalone system
Gap detection is based on candle closes and may miss intrabar movements
Historical imbalances from many bars ago may lose relevance
SETTINGS EXPLANATION
The indicator includes multiple customization options:
Require Body Fill: Controls whether wicks or bodies must enter gaps
Fill Detection Mode: Choose between Distal or Through modes
Visual Display: Select between boxes or lines
Alert Configuration: Set minimum age before fill alerts trigger
Debug Mode: Learn how the algorithm works with visual feedback
This indicator represents months of research into price inefficiency patterns and provides a systematic approach to identifying and tracking these critical market levels.
Note: Works on all timeframes and markets. Best results on liquid instruments with consistent volume patterns.
