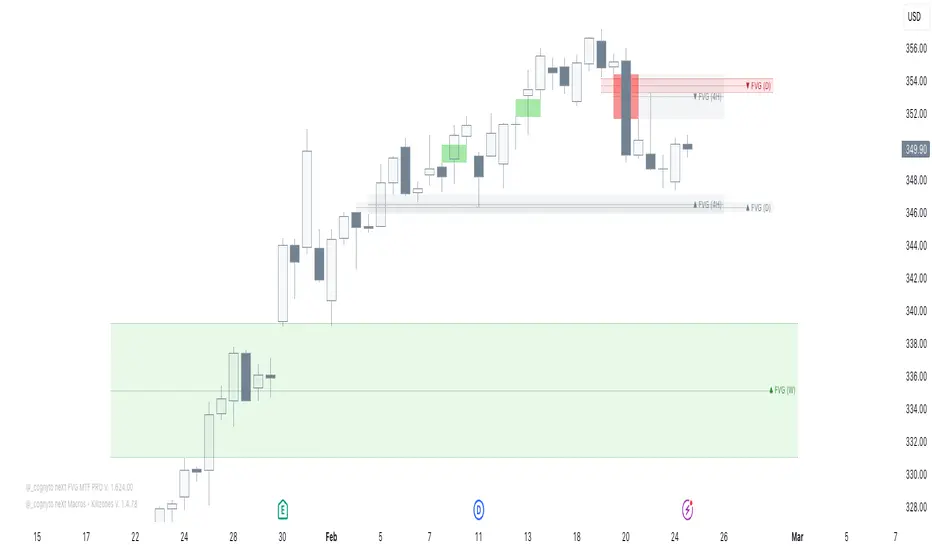
neXt FVG MTF PRO [cognyto]The neXt FVG Multi-Timeframe Indicator represents a remarkable edge in Fair Value Gap analysis. It offers traders a comprehensive and simplified interface to simultaneously monitor Fair Value Gaps across up to 9 different configurable timeframes . This feature shows traders exclusively the closest and most relevant gaps, enabling more precise top-down price action analysis. This makes it particularly valuable for strategies focused on market liquidity and inefficiencies.
Here are the 10 fundamental features that distinguish this indicator
1. Intelligent Visualisation of Next Gaps
An advanced filtering system is implemented to prioritise the visualisation of the nearest FVGs, hence its name -next-, offering a clean FVGs layout on the screen and improving analysis precision. The visualisation system continuously updates according to market price evolution, and as FVGs appear, are mitigated, or eliminated across different timeframes, it updates to ensure a structured and efficient interface.
2. Top-Down Multi-Timeframe Analysis
An efficient visualisation system is implemented to simultaneously manage up to 9 different timeframes. The differentiation between FVGs and their timeframes is established through proportional length in their visual presentation, where higher timeframes extend further to the right, establishing a clear visual hierarchy. The further right the gap extends, the stronger its significance. This structure allows visualization of both current timeframe gaps and those of higher timeframes, facilitating comprehensive market analysis.
3. Alerts
The indicator incorporates a complete notification system that allows users to stay informed in real-time about a wide range of critical events related to Gaps. This system includes customisable alerts for new Fair Value Gaps formation, mitigation notifications, and precise identification of significant gap breakout patterns, technically known as Breakaway gaps.
4. Mitigation
Mitigations represent a fundamental element in technical analysis, identifying zones where price has reached equilibrium. Considering the analytical importance of mitigated gaps, the indicator maintains their visualisation with a specific different color distinction. Additionally, it includes optional functionality for removing mitigated gaps, which can be activated according to user preferences.
5. BISI and SIBI
In addition to the FVGs present in all timeframes, the indicator facilitates precise configuration of BISI and SIBI gaps in the current timeframe, maintaining dynamic visualisation during the additional analysis process alongside other timeframes. This feature optimises the evaluation of historical market imbalances and inefficiencies, offering significant analytical perspectives in the current timeframe, and even refining market entry or exit strategies.
6. Breakaway-Gaps
The indicator provides advanced functionality for identifying and analysing Breakaway-Gaps, presenting in a structured manner the corresponding candle formations that create the Gap. This feature allows precise evaluation of strong market movements, including the assessment of potential retracements and directional patterns in high volatility conditions.
7. Consequent-Encroachment (C.E.)
The indicator implements advanced functionality that visualizes the midpoint of the displacement candle that generates the gap, using precise calculation based on the opening and closing levels of that candle.
8. FVG Fulfilment
The indicator offers advanced configuration options for FVG fullfilmet conditions through two main criteria: confirmation through candle closure that exceeds the established FVG limits, or validation through the intersection of extreme candle levels (maximum/minimum) with the FVG threshold.
9. FVG-Visualisations
Gaps are visualised on the platform once the third candle formation is complete. The system provides optional visualisation functionality during the formation process, although this feature is specifically recommended for predictive analysis, being most effective during daily or weekly market closing intervals. This feature maintains its consistency exclusively in the active timeframe.
10. Customisation
The indicator presents a wide range of advanced customisation options, facilitating comprehensive modification of visual elements. This includes professional adaptation of color palettes, typographic dimensions, line configurations, and design attributes, allowing precise optimisation according to specific user analytical requirements.
This indicator is available exclusively on TradingView. To access it, please see the ‘Author's Instructions’ above and visit our website.
DISCLAIMER
This indicator is provided for informational and educational purposes only. It does not constitute financial advice, trading advice, or any other type of advice, and should not be interpreted as a recommendation to buy, sell, or hold any investment or security of any kind. The information provided by this indicator is not intended as a substitute for professional financial advice. Users of this indicator bear sole responsibility for their trading and investment decisions, including the interpretation of market data and signals generated by this indicator. Past performance is not indicative of future results. Trading financial markets carries substantial risk of loss. Users should conduct their own research, seek professional advice when needed, and exercise due diligence before making any trading or investment decisions.
Timeframe
Automate Multi-Timeframe Period Separators - By KaVeHVersion 1.0
Overview
The Automate Multi-Timeframe Period Separators indicator automatically plots vertical separators on your chart to visually distinguish different time intervals. It helps traders quickly identify key session changes, daily transitions, and custom time references without manually drawing lines.
Unlike standard period separators, this script offers enhanced customization options, supports multiple timeframes, and adapts dynamically to different chart resolutions.
Key Features
✅ Multi-Timeframe Support – Works across all timeframes, from seconds to months.
✅ Customizable Time References – Choose between session start time or midnight (00:00) as the reference point.
✅ Time Zone Flexibility – Supports multiple exchange-based and user-defined time zones.
✅ Multiple Line Styles – Customize separator lines with solid, dashed, or dotted styles.
✅ Performance Optimized – Efficiently manages up to 500 separators without cluttering the chart.
How It Works
🔹 This script automatically detects session changes or day boundaries based on user preferences.
🔹 It dynamically adjusts separators based on the current chart timeframe to ensure clarity and relevance.
🔹 Users can modify separator colors, line styles, widths, and display preferences from the settings panel.
What Makes This Indicator Unique?
🔹 More Flexible than Built-in TradingView Separators – Allows custom time references, multiple time zones, and improved styling options.
🔹 Not a Simple Clone – Unlike existing open-source scripts, this indicator introduces dynamic MTF logic, optimized visibility conditions, and smarter separator management.
🔹 Continuously Updated – This is the first official release, and future updates will refine the logic further.
Timeframe Alignment:
M1 timeframe -> M15 separator
M3 timeframe -> M30 separator
M5 timeframe -> H1 separator
M15 timeframe -> H4 separator
H1 timeframe -> D1 separator
H4 timeframe -> W1 separator
How to Use
1️⃣ Add the indicator to your chart.
2️⃣ Configure your preferred time reference (Session Start / Midnight).
3️⃣ Choose a custom time zone if necessary.
4️⃣ Adjust separator styles, colors, and line width to fit your trading strategy.
5️⃣ Enjoy a clearer, more structured chart layout!
🔹 Important Note:
This is not a duplicate of any existing open-source indicator. It introduces unique logic for better time-based chart structuring, ensuring a clutter-free trading experience.
💡 If you have any suggestions or feature requests, feel free to share them!
🚀 Enhance Your Trading with Smarter Time Separators!

Multi-Timeframe ATR Levels by Hitesh2603Description:
"Multi-Timeframe ATR Levels by Hitesh2603" is a versatile and adaptive indicator designed to help traders identify key price levels based on the Average True Range (ATR) from a higher timeframe. The script automatically adapts to the current chart’s timeframe and allows you to customize the higher timeframe for ATR calculations, making it ideal for intraday and swing trading strategies.
The indicator plots upper and lower price levels based on the ATR multiplier, providing clear visual cues for potential profit-taking or exit points. It also includes features like editable timeframe presets , historical level plotting , labels , and alerts , making it a powerful tool for traders of all experience levels.
---
Key Features:
1. Automatic Timeframe Adaptation : - The script automatically detects the current chart’s timeframe and selects the appropriate higher timeframe for ATR calculations.
2. Editable Preset Timeframe Pairs : - Customize the higher timeframe for each chart timeframe directly in the indicator settings.
3. Dynamic ATR-Based Levels :- Plots upper and lower price levels using the formula:
- Upper Level = Current Candle Open + (Previous Candle ATR * Multiplier)
- Lower Level = Current Candle Open - (Previous Candle ATR * Multiplier)
4. Customizable Inputs :
- Adjust ATR length, multiplier, line length, colors, and more.
5. Labels :
- Displays the exact values of the upper and lower levels for easy reference.
6. Historical Levels :
- Optionally plots historical levels for all candles.
7. Alerts :
- Get notified when the price crosses the upper or lower levels.
---
Use Cases:
1. Intraday Trading :
- Use the script on a 5-minute or 15-minute chart with a 1-hour higher timeframe to identify intraday profit-taking or exit points.
2. Swing Trading :
- Use the script on a 1-hour or 4-hour chart with a daily higher timeframe to identify swing trading opportunities.
3. Position Trading :
- Use the script on a daily chart with a weekly higher timeframe to identify key levels for position trading.
4. Breakout Confirmation :
- Use the upper and lower levels as confirmation points for breakouts or reversals.
5. Risk Management :
- Use the levels to set stop-loss or take-profit targets based on market volatility.
---
How to Use:
1. Add the Script to Your Chart :
- Search for "Multi-Timeframe ATR Levels by Hitesh2603" in the TradingView indicator library and add it to your chart.
2. Customize the Settings :
- Adjust the inputs (e.g., ATR length, multiplier, line length, colors, etc.) to suit your trading strategy.
3. Set the Higher Timeframe :
- The script will automatically display an input for the higher timeframe based on the current chart’s timeframe. Customize it as needed.
4. Interpret the Levels :
- The script will plot two horizontal lines (upper and lower levels) on the chart. Use these levels for profit-taking, exits, or breakout confirmation.
5. Enable Alerts :
- Set up alerts to get notified when the price crosses the upper or lower levels.
---
Input Parameters:
1. ATR Length :
- The period used to calculate the ATR (default: 14).
2. ATR Multiplier :
- The multiplier applied to the ATR to calculate the levels (default: 0.65).
3. Line Length :
- The number of candles to extend the lines (default: 10).
4. Show Labels :
- Toggle to display the exact values of the levels (default: true).
5. Show Historical Levels :
- Toggle to plot historical levels for all candles (default: false).
6. Line Colors :
- Customize the colors of the upper and lower levels.
7. Line Width :
- Adjust the thickness of the lines (default: 2).
---
Example:
- Current Chart : 5-minute
- Higher Timeframe : 1-hour
- Previous Hour’s ATR : 4.6
- Current Hour’s Open : 102
- Multiplier : 0.65
Levels :
- Upper Level = 102 + (4.6 * 0.65) = 105.0
- Lower Level = 102 - (4.6 * 0.65) = 99.0
The script will plot horizontal lines at 105.0 and 99.0 on the 5-minute chart.
---
Alerts:
- Price Crosses Upper Level :
- Triggered when the price crosses above the upper level.
- Price Crosses Lower Level :
- Triggered when the price crosses below the lower level.
---
Notes:
- The script is designed to be flexible and adaptable to various trading styles and timeframes.
- Always backtest and validate the indicator with your trading strategy before using it in live trading.
---
Credits:
- Developed by Hitesh2603 .
- Special thanks to the TradingView community for inspiration and support.

Multi-Asset & TF RSI
Multi-Asset & TF RSI
This indicator allows you to compare the Relative Strength Index (RSI) values of two different assets across multiple timeframes in a single pane. It’s ideal for traders who wish to monitor momentum across different markets or instruments simultaneously.
Key Features:
Primary Asset RSI:
The indicator automatically calculates the RSI for the chart’s asset. You can adjust the timeframe for this asset using a dropdown that offers standard TradingView timeframes, a "Chart" option (which syncs with your current chart timeframe), or a "Custom" option where you can enter any timeframe.
Optional Second Asset RSI:
Enable the “Display Second Asset” option to compare another asset’s RSI. Simply select the symbol (default is “DXY”) and choose its timeframe from an identical dropdown. When enabled, the second asset’s RSI is computed and plotted for easy comparison.
RSI Settings:
Customize the RSI length and choose the data source (e.g., close price) to suit your trading strategy.
Visual Aids:
Overbought (70) and oversold (30) levels are clearly marked, along with a midline at 50. These visual cues help you quickly assess market conditions.
Asset Information Table:
A dynamic table at the top of the pane displays the symbols being analysed – the chart’s asset as the “1st” asset and, if enabled, the second asset as the “2nd.”
How to Use:
Apply the Indicator:
Add the indicator to your chart. By default, it will calculate the RSI for the chart’s current asset using your chart’s timeframe.
Adjust Primary Asset Settings:
Use the “Main Asset Timeframe” dropdown to choose the timeframe for the RSI calculation on the chart asset. Select “Chart” to automatically match your current chart’s timeframe or choose a preset/custom timeframe.
Enable and Configure the Second Asset:
Toggle the “Display Second Asset” option to enable the second asset’s RSI. Select the asset symbol and its desired timeframe using the provided dropdown. The RSI for the second asset will be plotted if enabled.
Monitor the RSI Values:
Observe the plotted RSI lines along with the overbought/oversold levels. Use the table at the top-centre of the pane to verify which asset symbols are being displayed.
This versatile tool is designed to support multi-asset analysis and can be a valuable addition to your technical analysis toolkit. Enjoy enhanced RSI comparison across markets and timeframes!
Happy Trading!

Multi Asset & TF Stochastic
Multi Asset & TF Stochastic
This indicator allows you to compare the stochastic oscillator values of two different assets across multiple timeframes in a single pane. It’s designed for traders who want to analyse the momentum of one asset (by default, the chart’s asset) alongside a second asset of your choice (e.g., comparing EURUSD to the USD Index).
How It Works:
Main Asset:
The indicator automatically uses the chart’s asset for the primary stochastic calculation. You have the option to adjust the timeframe for this asset using a dropdown that includes TradingView’s standard timeframes, a "Chart" option (which automatically uses your chart’s timeframe), or a "Custom" option where you can type in any timeframe.
Second Asset:
You can enable the display of a second asset by toggling the “Display Second Asset” option. Choose the asset symbol (default is “DXY”) and select its timeframe from an identical dropdown. When enabled, the script calculates the stochastic oscillator for the second asset, allowing you to compare its momentum (%K and %D lines) with that of the main asset.
Stochastic Oscillator Settings:
Customize the %K length, the smoothing period for %K, and the smoothing period for %D. Both assets’ stochastic values are calculated using these parameters.
Visual Display:
The indicator plots the %K and %D lines for the main asset in prominent colours. If the second asset is enabled, its %K and %D lines are also plotted in different colours. Additionally, overbought (80) and oversold (20) levels are marked, with a midline at 50, making it easier to gauge market conditions at a glance.
%D line can be toggled off for a cleaner view if required:
Asset Information Table:
A table at the top-centre of the pane displays the active asset symbols—ensuring you always know which assets are being analysed.
How to Use:
Apply the Indicator:
Add the script to your chart. By default, it will use the chart’s current asset and timeframe for the primary stochastic oscillator.
Adjust the Main Asset Settings:
Use the “Main Asset Timeframe” dropdown to select a specific timeframe for the main asset or stick with the “Chart” option for automatic syncing with your current chart.
Enable and Configure the Second Asset (Optional):
Toggle on “Display Second Asset” if you wish to compare another asset. Select the desired symbol and adjust its timeframe using the provided dropdown. Choose “Custom” if you need a timeframe not listed by default.
Review the Plots and Table:
Observe the stochastic %K and %D lines for each asset. The overbought/oversold levels help indicate potential market turning points. Check the table at the top-centre to confirm the asset symbols being displayed.
This versatile tool is ideal for traders who rely on momentum analysis and need to quickly compare the stochastic signals of different markets or instruments. Enjoy seamless multi-asset analysis with complete control over your timeframe settings!

Higher Time Frame Fair Value Gap [ZeroHeroTrading]A fair value gap (FVG) highlights an imbalance area between market participants, and has become popular for technical analysis among price action traders.
A bullish (respectively bearish) fair value gap appears in a triple-candle pattern when there is a large candle whose previous candle’s high (respectively low) and subsequent candle’s low (respectively high) do not fully overlap the large candle. The space between these wicks is known as the fair value gap.
The following script aims at identifying higher timeframe FVG's within a lower timeframe chart. As such, it offers a unique perspective on the formation of FVG's by combining the multiple timeframe data points in the same context.
You can change the indicator settings as you see fit to achieve the best results for your use case.
Features
It draws higher timeframe bullish and bearish FVG's on the chart.
For bullish (respectively bearish) higher timeframe FVG's, it adds the buying (respectively selling) pressure as a percentage ratio of the up (respectively down) volume of the second higher timeframe bar out of the total up (respectively down) volume of the first two higher timeframe bars.
It adds a right extended trendline from the most recent lowest low (respectively highest high) to the top (respectively bottom) of the higher timeframe bullish (respectively bearish) FVG.
It detects and displays higher timeframe FVG's as early as one starts forming.
It detects and displays lower timeframe (i.e. chart's timeframe) FVG's upon confirmation.
It allows for skipping inside first bars when evaluating FVG's.
It allows for dismissing higher timeframe FVG's if there is no update for any period of the chart's timeframe. For instance, this can occur at lower timeframes during low trading activity periods such as extended hours.
Settings
Higher Time Frame FVG dropdown: Selects the higher timeframe to run the FVG detection on. Default is 15 minutes. It must be higher than, and a multiple of, the chart's timeframe.
Higher Time Frame FVG color select: Selects the color of the text to display for higher timeframe FVG's. Default is black.
Show Trend Line checkbox: Turns on/off trendline display. Default is on.
Show Lower Time Frame FVG checkbox: Turns on/off lower timeframe (i.e. chart's timeframe) FVG detection. Default is on.
Show Lower Time Frame FVG color select: Selects the color of the border for lower timeframe (i.e. chart's timeframe) FVG's. Default is white.
Include Inside Bars checkbox: Turns on/off the inclusion of inside first bars when evaluating FVG's. Default is on.
With Consistent Updates checkbox: Turns on/off consistent updates requirement. Default is on.

Multi-Timeframe Open LinesThe Multi-Timeframe Open Lines indicator is designed to help traders visualize key price levels at the open of specific time intervals. It draws horizontal lines at the open of 5-minute, 15-minute, 30-minute, and hourly candles, extending these lines to the start of the next respective interval. Traders can now control which timeframes are displayed and how many past opening lines are shown, ensuring a clean and organized chart.
Key Features:
Customizable Lines:
5-Minute Lines: Highlight the open of every 5-minute candle, ending at the start of the next 5-minute candle.
15-Minute Lines: Highlight the open of every 15-minute candle, ending at the start of the next 15-minute candle.
30-Minute Lines: Highlight the open of every 30-minute candle, ending at the start of the next 30-minute candle.
Hourly Lines: Highlight the open of every hourly candle, ending at the start of the next hourly candle.
Each timeframe's lines can be customized in terms of color, line style, and thickness.
Toggle Options:
Easily turn on or off the display of lines for each timeframe (5m, 15m, 30m, 1h) using checkboxes in the settings.
User-Defined Limits:
Control the number of past opening lines displayed for each timeframe (5m, 15m, 30m, 1h).
Prevents chart clutter by limiting the number of visible lines.
Multi-Timeframe Analysis:
Enables traders to analyze price action across multiple timeframes simultaneously, providing a clearer picture of market structure and key levels.
User-Friendly Inputs:
Easy-to-use settings for customizing line appearance and behavior, ensuring the indicator fits seamlessly into any trading strategy.
How to Use:
Apply the indicator to your chart to visualize the open price levels for 5-minute, 15-minute, 30-minute, and hourly candles.
Use the lines as dynamic support/resistance levels or to identify potential breakout/breakdown points.
Customize the colors, styles, and the number of visible lines to match your chart theme or trading preferences.
Toggle specific timeframes on or off to focus on the most relevant price levels.
Ideal For:
Traders who use multi-timeframe analysis.
Those who rely on key price levels for decision-making.
Anyone looking to enhance their chart with clear, customizable reference lines while avoiding clutter.

MTF Signal XpertMTF Signal Xpert – Detailed Description
Overview:
MTF Signal Xpert is a proprietary, open‑source trading signal indicator that fuses multiple technical analysis methods into one cohesive strategy. Developed after rigorous backtesting and extensive research, this advanced tool is designed to deliver clear BUY and SELL signals by analyzing trend, momentum, and volatility across various timeframes. Its integrated approach not only enhances signal reliability but also incorporates dynamic risk management, helping traders protect their capital while navigating complex market conditions.
Detailed Explanation of How It Works:
Trend Detection via Moving Averages
Dual Moving Averages:
MTF Signal Xpert computes two moving averages—a fast MA and a slow MA—with the flexibility to choose from Simple (SMA), Exponential (EMA), or Hull (HMA) methods. This dual-MA system helps identify the prevailing market trend by contrasting short-term momentum with longer-term trends.
Crossover Logic:
A BUY signal is initiated when the fast MA crosses above the slow MA, coupled with the condition that the current price is above the lower Bollinger Band. This suggests that the market may be emerging from a lower price region. Conversely, a SELL signal is generated when the fast MA crosses below the slow MA and the price is below the upper Bollinger Band, indicating potential bearish pressure.
Recent Crossover Confirmation:
To ensure that signals reflect current market dynamics, the script tracks the number of bars since the moving average crossover event. Only crossovers that occur within a user-defined “candle confirmation” period are considered, which helps filter out outdated signals and improves overall signal accuracy.
Volatility and Price Extremes with Bollinger Bands
Calculation of Bands:
Bollinger Bands are calculated using a 20‑period simple moving average as the central basis, with the upper and lower bands derived from a standard deviation multiplier. This creates dynamic boundaries that adjust according to recent market volatility.
Signal Reinforcement:
For BUY signals, the condition that the price is above the lower Bollinger Band suggests an undervalued market condition, while for SELL signals, the price falling below the upper Bollinger Band reinforces the bearish bias. This volatility context adds depth to the moving average crossover signals.
Momentum Confirmation Using Multiple Oscillators
RSI (Relative Strength Index):
The RSI is computed over 14 periods to determine if the market is in an overbought or oversold state. Only readings within an optimal range (defined by user inputs) validate the signal, ensuring that entries are made during balanced conditions.
MACD (Moving Average Convergence Divergence):
The MACD line is compared with its signal line to assess momentum. A bullish scenario is confirmed when the MACD line is above the signal line, while a bearish scenario is indicated when it is below, thus adding another layer of confirmation.
Awesome Oscillator (AO):
The AO measures the difference between short-term and long-term simple moving averages of the median price. Positive AO values support BUY signals, while negative values back SELL signals, offering additional momentum insight.
ADX (Average Directional Index):
The ADX quantifies trend strength. MTF Signal Xpert only considers signals when the ADX value exceeds a specified threshold, ensuring that trades are taken in strongly trending markets.
Optional Stochastic Oscillator:
An optional stochastic oscillator filter can be enabled to further refine signals. It checks for overbought conditions (supporting SELL signals) or oversold conditions (supporting BUY signals), thus reducing ambiguity.
Multi-Timeframe Verification
Higher Timeframe Filter:
To align short-term signals with broader market trends, the script calculates an EMA on a higher timeframe as specified by the user. This multi-timeframe approach helps ensure that signals on the primary chart are consistent with the overall trend, thereby reducing false signals.
Dynamic Risk Management with ATR
ATR-Based Calculations:
The Average True Range (ATR) is used to measure current market volatility. This value is multiplied by a user-defined factor to dynamically determine stop loss (SL) and take profit (TP) levels, adapting to changing market conditions.
Visual SL/TP Markers:
The calculated SL and TP levels are plotted on the chart as distinct colored dots, enabling traders to quickly identify recommended exit points.
Optional Trailing Stop:
An optional trailing stop feature is available, which adjusts the stop loss as the trade moves favorably, helping to lock in profits while protecting against sudden reversals.
Risk/Reward Ratio Calculation:
MTF Signal Xpert computes a risk/reward ratio based on the dynamic SL and TP levels. This quantitative measure allows traders to assess whether the potential reward justifies the risk associated with a trade.
Condition Weighting and Signal Scoring
Binary Condition Checks:
Each technical condition—ranging from moving average crossovers, Bollinger Band positioning, and RSI range to MACD, AO, ADX, and volume filters—is assigned a binary score (1 if met, 0 if not).
Cumulative Scoring:
These individual scores are summed to generate cumulative bullish and bearish scores, quantifying the overall strength of the signal and providing traders with an objective measure of its viability.
Detailed Signal Explanation:
A comprehensive explanation string is generated, outlining which conditions contributed to the current BUY or SELL signal. This explanation is displayed on an on‑chart dashboard, offering transparency and clarity into the signal generation process.
On-Chart Visualizations and Debug Information
Chart Elements:
The indicator plots all key components—moving averages, Bollinger Bands, SL and TP markers—directly on the chart, providing a clear visual framework for understanding market conditions.
Combined Dashboard:
A dedicated dashboard displays key metrics such as RSI, ADX, and the bullish/bearish scores, alongside a detailed explanation of the current signal. This consolidated view allows traders to quickly grasp the underlying logic.
Debug Table (Optional):
For advanced users, an optional debug table is available. This table breaks down each individual condition, indicating which criteria were met or not met, thus aiding in further analysis and strategy refinement.
Mashup Justification and Originality
MTF Signal Xpert is more than just an aggregation of existing indicators—it is an original synthesis designed to address real-world trading complexities. Here’s how its components work together:
Integrated Trend, Volatility, and Momentum Analysis:
By combining moving averages, Bollinger Bands, and multiple oscillators (RSI, MACD, AO, ADX, and an optional stochastic), the indicator captures diverse market dynamics. Each component reinforces the others, reducing noise and filtering out false signals.
Multi-Timeframe Analysis:
The inclusion of a higher timeframe filter aligns short-term signals with longer-term trends, enhancing overall reliability and reducing the potential for contradictory signals.
Adaptive Risk Management:
Dynamic stop loss and take profit levels, determined using ATR, ensure that the risk management strategy adapts to current market conditions. The optional trailing stop further refines this approach, protecting profits as the market evolves.
Quantitative Signal Scoring:
The condition weighting system provides an objective measure of signal strength, giving traders clear insight into how each technical component contributes to the final decision.
How to Use MTF Signal Xpert:
Input Customization:
Adjust the moving average type and period settings, ATR multipliers, and oscillator thresholds to align with your trading style and the specific market conditions.
Enable or disable the optional stochastic oscillator and trailing stop based on your preference.
Interpreting the Signals:
When a BUY or SELL signal appears, refer to the on‑chart dashboard, which displays key metrics (e.g., RSI, ADX, bullish/bearish scores) along with a detailed breakdown of the conditions that triggered the signal.
Review the SL and TP markers on the chart to understand the associated risk/reward setup.
Risk Management:
Use the dynamically calculated stop loss and take profit levels as guidelines for setting your exit points.
Evaluate the provided risk/reward ratio to ensure that the potential reward justifies the risk before entering a trade.
Debugging and Verification:
Advanced users can enable the debug table to see a condition-by-condition breakdown of the signal generation process, helping refine the strategy and deepen understanding of market dynamics.
Disclaimer:
MTF Signal Xpert is intended for educational and analytical purposes only. Although it is based on robust technical analysis methods and has undergone extensive backtesting, past performance is not indicative of future results. Traders should employ proper risk management and adjust the settings to suit their financial circumstances and risk tolerance.
MTF Signal Xpert represents a comprehensive, original approach to trading signal generation. By blending trend detection, volatility assessment, momentum analysis, multi-timeframe alignment, and adaptive risk management into one integrated system, it provides traders with actionable signals and the transparency needed to understand the logic behind them.

EMA/SMA Ribbon Pro (AUTO HTF + Labels)This indicator is a multi-timeframe (MTF) moving average ribbon that dynamically adjusts to the next highest timeframe. It provides a visual representation of market trends by stacking multiple EMAs and SMAs with customizable color fills and labels.
Features
✅ Multi-Timeframe (MTF) Support: Automatically detects the next highest time frame or allows for manual selection
✅ Customizable Moving Averages: Supports EMA and SMA with different lengths for flexible configuration
✅ Ribbon Visualization: Smooth color transitions between different moving averages for better trend identification
✅ Crossover Labels: Detects bullish and bearish EMA/SMA crossovers and marks them on the chart
✅ Price Labels & Timeframe Display: Displays moving average values to the right of the price axis with customizable label padding and colors
How It Works
Select the HTF mode: Manual or automatic
Choose EMA/SMA lengths to create different ribbons
Enable/disable price labels for each moving average
Customize colors and transparency for ribbons and labels
Crossover labels appear when faster moving averages cross slower ones and vice versa
Use Cases
📌 Trend Identification: Identify bullish and bearish trends using multiple EMAs and SMAs
📌 Support & Resistance Zones: MAs can act as dynamic support and resistance levels
📌 Reversal & Confirmation Signals: Watch for MTF crossovers to confirm trend changes
Customization
🔹 Standard EMA Lengths: 6, 8, 13, 21, 34, 48, 100, 200, 300, 400
🔹 SMA Lengths: 48, 100, 200
🔹 Color Adjustments: Set custom colors for bullish/bearish ribbons
🔹 Crossovers: Enable/disable custom crossover pairs (e.g., 100/200 EMA, 200 EMA/SMA).
This indicator is perfect for traders who rely on multi-timeframe confluence while seeking to enhance their market analysis and decision-making process.
As always, by combining EMA/SMA Ribbon with other tools, traders ensure that they are not relying on a single indicator. This layered approach can reduce the likelihood of false signals and improve overall trading accuracy.
As always, be sure to use any indicator with price action and volume indicators for better trade confirmation!

Price Level Multi Timeframe [Snowdex]Price Level Multi-Timeframe Indicator
This indicator visualizes important price levels from multiple timeframes (e.g., daily, weekly, monthly) directly on the chart. It helps traders identify significant support and resistance levels for better decision-making.
Features:
Displays price levels for multiple timeframes: daily (1D), weekly (1W), monthly (1M), quarterly (3M), semi-annual (6M), and yearly (12M).
Customizable options to show or hide levels and adjust their colors.
Highlights high, low, and close levels of each timeframe with labels and dotted lines.
Includes options to extend levels visually for better clarity.
Benefits:
Easily compare price levels across timeframes.
Enhance technical analysis with multi-timeframe insights.
Identify key areas of support and resistance dynamically.

Multi Timeframe 8x MA Support Resistance Zones [SiDec]Multi-Timeframe Moving Average Support/Resistance Zones: The Ultimate Trading Power Tool
Indicator Overview
Get ready to elevate your trading game with the Multi-Timeframe Moving Average Support/Resistance Zones indicator. This advanced tool is engineered for traders who want to maximize efficiency without constantly switching between timeframes. By dynamically plotting support and resistance zones using the 21 SMA and 21 EMA, it reveals crucial price levels where trends may pause, reverse, or accelerate—giving you actionable insights in a fraction of the time.
Imagine seeing all the relevant timeframe zones on one chart, without ever needing to flip between timeframes—saving you time and allowing you to focus on what really matters.
Core Features
Dynamic Zones That Adjust in Real-Time:
The area between the 21 EMA and 21 SMA is shaded, forming a "zone" on your chart. This dynamic zone adjusts live as price moves, keeping you in sync with current market behavior across multiple timeframes.
By showing these zones across all your selected timeframes, you can view everything you need at a glance—no time wasted jumping between charts.
All Timeframes, One View:
With the ability to view multiple timeframe zones simultaneously (from 5-minute to Monthly), this tool helps you spot key levels quickly without switching between timeframes. You’ll see how price interacts with these levels across different timeframes without ever having to change charts.
Higher timeframes show broader, more significant zones—giving you the market's big picture—while intraday zones help you fine-tune your entries.
Customisable Like Never Before:
Toggle Timeframes: Only activate the timeframes you care about—no distractions, just pure focus.
Color Your World: Assign different colors to each timeframe for instant visual cues (e.g., blue for Daily, gold for Weekly). This makes it easy to identify key zones across all timeframes at a glance.
Why You Need This Tool
Instant Trend Confirmation: Track how price interacts with multiple timeframe zones to confirm bullish or bearish momentum in real-time.
Confluence = High Confidence: When zones from multiple timeframes overlap, you’ve found a high-probability reversal area. This is where the market is likely to turn, and where your edge lies.
Efficiency at Its Best: No more switching between timeframes—everything you need is in one place, giving you more time to trade and less time spent on analysis.
Configuration Instructions
1.) Timeframe Selection:
Choose which timeframes to display using the Timeframe Selection panel.
Intraday Focus: 5m, 15m, 1H.
Swing/Long-Term Focus: 4H, 12H, Daily, Weekly, Monthly.
Color Coding: Assign a distinct color to each timeframe for instant identification—like having a personal color-coded trading roadmap.
2.) MA Settings:
MA Types:
21 EMA: Perfect for capturing short-term trends and fast price action.
21 SMA: The smooth operator for spotting longer-term trends with more consistency.
Recommended Periods: The 21-period MA works wonders for trend detection across various timeframes. You can also integrate Fibonacci-based MAs (e.g., 55, 233) for enhanced confluence.
3.) Visual Tweaks:
Opacity: Adjust the zone transparency (80-90% opacity keeps it visible yet non-intrusive).
Zone Extensions: Customize how far zones extend backward and forward, capturing the full impact of support/resistance levels.
Labels: Show real-time MA values and timeframe-specific details for further clarity.
Trading Strategies That Pack a Punch
1.) Trend Confirmation:
Uptrend: Price staying above the 21 EMA and 21 SMA suggests a bullish trend.
Downtrend: Price holding below these MAs signals a bearish market.
2.) Zone-Based Reversals:
Entry: Look for price to retrace to a higher timeframe support zone (e.g., Daily 21 SMA) with confirmation from oversold/overbought indicators like RSI.
Exit: Time to sell when price breaks through a critical zone, like the 4H 21 EMA.
3.) Confluence Trading:
Combine the zones with other indicators to amplify your trade setups:
Fibonacci Levels: When a 61.8% retracement lines up with an MA zone, you’ve found a high-confluence area.
Volume Profile: High-volume nodes near key zones strengthen their significance.
Best Practices for Maximum Profit
Focus on Higher Timeframes: Weekly and Monthly zones carry more weight, making them more significant in decision-making.
Avoid Clutter: If you’re trading higher timeframes, disable intraday timeframes like 5m and 15m to keep your chart clear and focused.
Risk Management: Zones are probabilities, not guarantees. Always use stop-loss orders to protect your trades.
Example of a Winning Setup
Scenario:
Price retraces to the 1H 21 EMA zone.
The Daily 21 SMA zone is nearby—talk about confluence!
RSI shows oversold conditions, indicating a potential reversal.
Action:
Enter long on a bullish candlestick pattern (e.g., bullish engulfing).
Set your stop-loss just below the Daily 21 SMA zone.
Target the next higher timeframe resistance.
Performance Considerations
Repainting Risk: Zones might slightly adjust with the formation of new bars, but the changes will typically be minimal.
Enhance with Oscillators: Use momentum indicators like MACD or Stochastic and volume analysis for even more confirmation.
Conclusion
The Multi-Timeframe Moving Average Support/Resistance Zones indicator isn’t just a tool—it’s a game-changer. With the ability to view all relevant timeframe zones on one chart, you can make decisions faster, spot high-confluence areas, and trade with greater precision. The time you save by not switching between timeframes can make all the difference in your trading success.
Maximise your trading edge—harness the power of multi-timeframe analysis, gain more time to trade, and dominate the market like never before. 📊🔍

Power Trend [MacAlgo]Description:
The Power Trend Indicator is a sophisticated technical analysis tool that overlays on your trading charts to identify prevailing market trends. It utilizes a combination of ATR-based trend calculations, moving averages, volume analysis, and momentum indicators to generate reliable buy and sell signals. Additionally, it offers customizable settings to adapt to various trading styles and timeframes.
Key Features:
Adaptive ATR Calculation: Automatically adjusts the ATR (Average True Range) period and multiplier based on the selected timeframe for more accurate trend detection.
Dynamic Trend Lines: Plots continuous trend lines with color-coded bars to visually represent bullish and bearish trends.
Buy/Sell Signals: Generates standard and power buy/sell signals to help you make informed trading decisions.
Volume Analysis: Incorporates average buy and sell volumes to identify strong market movements.
Multiple Timeframe Support: Automatically adjusts the indicator's timeframe or allows for manual selection to suit your trading preferences.
Highlighting: Highlights trending bars for easy visualization of market conditions.
Alerts: Customizable alert conditions to notify you of potential trading opportunities in real-time.
How it Works:
1. ATR-Based Trend Calculation:
ATR Period & Multiplier: Calculates ATR based on user-defined periods and multipliers, dynamically adjusting according to the chart's timeframe.
Trend Determination: Identifies trends as bullish (1) or bearish (-1) based on price movements relative to ATR-based upper (up) and lower (dn) trend lines.
2. Moving Averages:
EMA & SMA: Calculates exponential and simple moving averages to smooth price data and identify underlying trends.
AlphaTrend Line: Combines a 50-period EMA and a 30-period SMA on a 4-hour timeframe to create the AlphaTrend line, providing a robust trend reference.
3. Volume Analysis:
Buy/Sell Volume: Differentiates between buy and sell volumes to gauge market strength.
Average Volume: Compares current volume against average buy/sell volumes to detect significant market movements.
4. Momentum Indicators:
RSI, MACD, OBV: Incorporates Relative Strength Index (RSI), Moving Average Convergence Divergence (MACD), and On-Balance Volume (OBV) to assess momentum and confirm trend strength.
5. Signal Generation:
Standard Signals: Basic buy and sell signals based on trend crossovers.
Power Signals: Enhanced signals requiring multiple conditions (e.g., increased volume, momentum confirmation) for higher confidence trades.
Customization Options:
Tailor the Power Trend Indicator to your specific trading needs with the following settings:
ATR Period: Set the period for ATR calculation (default: 8).
ATR Multiplier: Adjust the ATR multiplier to fine-tune trend sensitivity (default: 3.0).
Source: Choose the price source (e.g., HL2, Close) for calculations.
Change ATR Calculation Method: Toggle between different ATR calculation methods.
Show Buy/Sell Signals: Enable or disable the display of buy and sell signals on the chart.
Highlighting: Turn on or off the bar highlighting feature.
Timeframe Adjustment: Choose between automatic timeframe adjustment or manually set
the indicator's timeframe.
Manual Indicator Timeframe: If manual adjustment is selected, specify the desired timeframe (default: 60 minutes).
Visual Components:
Trend Lines: Continuous lines representing the current trend, color-coded for easy identification (green for bullish, red for bearish, orange for neutral).
Bar Coloring: Bars are colored based on the current trend and its relationship to the AlphaTrend line.
Buy/Sell Triangles: Triangular markers appear on the chart to indicate buy and sell signals.
Power Signals: Larger triangles highlight strong buy and sell opportunities based on multiple confirming factors.
Highlighting: Transparent overlays highlight trending areas to enhance visual clarity.
Alerts:
Stay informed with customizable alerts that notify you of important market movements:
SuperTrend Buy/Sell: Alerts when standard buy or sell signals are generated.
Power Buy/Sell Alerts: Notifications for strong buy or sell signals based on comprehensive conditions.
Trend Direction Change: Alerts when the trend changes from bullish to bearish or vice versa.
How to Use:
Add to Chart: Apply the Power Trend Indicator to your preferred trading chart on TradingView.
Configure Settings: Adjust the input parameters to match your trading style and the timeframe you are analyzing.
Analyze Trends: Observe the trend lines, bar colors, and AlphaTrend line to understand the current market trend.
Follow Signals: Look for buy and sell signals or power signals to identify potential entry and exit points.
Set Alerts: Enable alerts to receive real-time notifications of significant trading opportunities.
Adjust as Needed: Fine-tune the settings based on market conditions and your trading experience.
Important Notes:
Backtesting: While the Power Trend Indicator is built using robust technical analysis principles, it's essential to backtest and validate its performance within your trading strategy.
Market Conditions: The indicator performs best in trending markets. In sideways or highly volatile markets, signal reliability may vary.
Risk Management: Always employ proper risk management techniques when trading based on indicator signals to protect your capital.
Disclaimer:
This indicator is intended for educational purposes only and does not provide financial advice or guarantee future performance. Trading involves risk, and past results are not indicative of future outcomes. Always conduct your own analysis and risk management.

Percent Change HistogramThis indicator shows you percent changes in a super visual way using a color-coded histogram.
Here's how the colors work:
🟩 Dark green = percent change is growing stronger
🟢 Light green = still positive but losing steam
🟥 Dark red = getting more negative
🔴 Light red = negative but improving
The cool part? You can set any lookback period you want. For example:
24 periods on 1H chart = last 24 hours
30 periods on daily = last month
7 periods on daily = last week
Pro tip: You're not locked to your chart's timeframe! Want to see monthly changes while trading on 5min?
No problem.
You can even stack multiple indicators to watch different intervals simultaneously (daily, weekly, monthly) - super helpful for multi-timeframe analysis.
Perfect for spotting momentum shifts across different timeframes without switching between charts.

TVMC - Composite Indicator with Technical RatingsDescription:
The TVMC (Trend, Volume, Momentum, Composite) indicator is a powerful multi-component tool designed to provide traders with a comprehensive understanding of market conditions. By combining four essential technical analysis components—trend, momentum, volume, and volatility—this indicator offers clear and actionable insights to assist in decision-making.
Key Features:
1. Trend Component (TC):
* Based on MACD (Moving Average Convergence Divergence), this component analyzes the relationship between two exponential moving averages (fast and slow) to determine the prevailing market trend.
* The MACD signal is normalized to a range of -1 to +1 for consistency and clarity.
2. Momentum Component (MC):
* Utilizes RSI (Relative Strength Index) to measure the strength and speed of price movements.
* This component highlights overbought or oversold conditions, which may indicate potential market reversals.
3. Volume Confirmation (VC):
* Compares the current trading volume to its moving average over a specified period.
* High volume relative to the average confirms the validity of the current trend.
4. Volatility Filter (VF):
* Uses ATR (Average True Range) to gauge market volatility.
* Adjusts and smooths signals to reduce noise during periods of high volatility.
5. Technical Ratings Integration:
* Incorporates TradingView’s Technical Ratings, allowing users to validate signals using moving averages, oscillators, or a combination of both.
* Users can choose their preferred source of ratings for enhanced signal confirmation.
How It Works:
The TVMC indicator combines the weighted contributions of the Trend, Momentum, and Volume components, further refined by the Volatility Filter. Each component plays a specific role:
* Trend: Identifies whether the market is bullish, bearish, or neutral.
* Momentum: Highlights the strength of price action.
* Volume: Confirms whether the current price action is supported by sufficient trading activity.
* Volatility: Filters out excessive noise in volatile market conditions, providing a smoother and more reliable output.
Visualization:
1. Bullish Signals:
* The indicator line turns green and remains above the zero line, indicating upward momentum.
2. Bearish Signals:
* The indicator line turns red and falls below the zero line, signaling downward momentum.
3. Neutral Signals:
* The line is orange and stays near zero, indicating a lack of strong trend or momentum.
4. Zones:
* Horizontal lines at +30 and -30 mark strong bullish and bearish zones, respectively.
* A zero line is included for clear separation between bullish and bearish signals.
Recommended Usage:
* Best Timeframes: The indicator is optimized for higher timeframes such as 4-hour (H4) and daily (D1) charts.
* Trading Style: Suitable for swing and positional trading.
* Customization: The indicator allows users to adjust all major parameters (e.g., MACD, RSI, volume, and ATR settings) to fit their trading preferences.
Customization Options:
* Adjustable weights for Trend, Momentum, and Volume components.
* Fully configurable settings for MACD, RSI, Volume SMA, and ATR periods.
* Timeframe selection for multi-timeframe analysis.
Important Notes:
1. Originality: The TVMC indicator combines multiple analysis methods into a unique framework. It does not replicate or minimally modify existing indicators.
2. Transparency: The description is detailed enough for users to understand the methodology without requiring access to the code.
3. Clarity: The indicator is explained in a way that is accessible even to users unfamiliar with complex technical analysis tools.
Compliance with TradingView Rules:
* The indicator is written in Pine Script version 5, adhering to TradingView’s language standards.
* The description is written in English to ensure accessibility to the global community, with a clear explanation of all components and functionality.
* No promotional content, links, or unrelated references are included.
* The chart accompanying the indicator is clean and demonstrates its intended use clearly, with no additional indicators unless explicitly explained.

Enhanced Cumulative Volume Delta + MAThe Enhanced Cumulative Volume Delta (CVD) indicator is designed to help traders analyze the cumulative buying and selling pressure in the market by examining the delta between the up and down volume. By tracking this metric, traders can gain insights into the strength of a trend and potential reversals. This indicator uses advanced volume analysis combined with customizable moving averages to provide a more detailed view of market dynamics.
How to Use This Indicator:
Volume Delta Visualization:
The indicator plots the cumulative volume delta (CVD) using color-coded candles, where teal represents positive delta (buying pressure) and soft red represents negative delta (selling pressure).
Moving Averages:
Use the moving averages to smooth the CVD data and identify long-term trends. You can choose between SMA and EMA for each of the three available moving averages. The first and third moving averages are typically used for short-term and long-term trend analysis, respectively, while the second moving average can serve as a medium-term filter.
Arrow Markers:
The indicator will display arrows (green triangle up for crossing above, red triangle down for crossing below) when the CVD volume crosses the 3rd moving average. You can control the visibility of these arrows through the input parameters.
Volume Data:
The indicator provides error handling in case no volume data is available for the selected symbol, ensuring that you're not misled by incomplete data.
Practical Applications:
Trend Confirmation: Use the CVD and moving averages to confirm the overall trend direction and strength. Positive delta and a rising CVD can confirm an uptrend, while negative delta and a falling CVD indicate a downtrend.
Volume Breakouts: The arrows marking when the CVD crosses the 3rd moving average can help you spot potential volume breakouts or reversals, making them useful for entry or exit signals.
Volume Divergence: Pay attention to divergences between price and CVD, as these can often signal potential trend reversals or weakening momentum.

MultiTime Stochastics ProMultiTime Stochastics Pro
This indicator is an enhanced version of the stochastic indicator, featuring two separate stochastics. This functionality allows you to adjust the settings and time frame for each stochastic individually, enabling a more precise analysis of market fluctuations.
The Double Stochastic indicator enables you to simultaneously analyze the market in different time frames with two separate stochastics. One of the standout features of this indicator is that when the chart's time frame changes, each stochastic is displayed according to the time set for it and does not change in other time frames. This feature provides greater flexibility and accuracy in market analysis.
How the Indicator Works
This indicator calculates two separate stochastics:
The first stochastic (K1 and D1) with its own specific time frame and settings.
The second stochastic (K2 and D2) with a different time frame and settings.
These two stochastics are displayed simultaneously on one chart, and overbought and oversold lines are also included.
How to Use
Parameter Adjustment : Adjust the parameters K1 Length, D1 Smoothing, and K1 Time Frame as desired. Do the same for the second stochastic.
Signal Analysis : Analyze buy and sell signals based on the stochastic values and the overbought and oversold lines.
Advantages
Greater Precision : With two separate stochastics, you can follow market fluctuations with greater accuracy.
Flexibility : The ability to individually set the time frame and parameters for each stochastic makes this indicator highly flexible.
Stronger Signals : The simultaneous display of two stochastics allows you to receive stronger buy and sell signals.
Multi-time frame Analysis : The ability to analyze the market in different time frames simultaneously.
This indicator is suitable for traders seeking more precise and flexible market analysis tools. I hope these explanations help you publish your indicator in the best possible way!

MTF Fractal Bias Confluence DetectorMTF Fractal Bias Confluence Detector
This indicator, the MTF Fractal Bias Confluence Detector, is based on the idea that the market exhibits fractal behaviour. The origin of the idea traces back to 1963, when Benoit Mandelbrot analyzed the fluctuations in cotton prices over a time series starting in 1900, discovering that price changes exhibited scale-invariant patterns. This means that the curve representing daily price changes mirrored the shape of monthly price changes, highlighting the fractal nature of market behaviour. When applied to swing points across multiple timeframes (MTF), this concept suggests that swing points demonstrate similar patterns regardless of the timeframe being analyzed. These self-similar fractal structures provide traders with insights into market reversals and trends, making them a powerful tool for multi-timeframe analysis.
A Swing Point is made up of three main parts: a move away from the last Break level; forming a peak (pivot point) with a Fakeout of the peak (explained through an example later); and a subsequent move away from it. These swing points recur across all timeframes as part of cyclical momentum patterns, meaning each swing point gives rise to a new cycle of market movement. Due to the fractal nature of the market, larger cycles encompass multiple smaller ones.
The theory behind the Fractal Bias Confluence Detector utilizes the idea that the market movements are fractal in nature and illustrates how such swing points can be identified across MTFs. To do so, we examine the Peak Fakeouts within these cycles, as they form. It is not possible to know in advance how long each of these moves will last, but a Swing Point will often occur with a Peak Fakeout. Therefore, the most critical element is to identify the Peak Fakeout.
The snapshot below captures a Peak Fakeout, as discussed earlier.
Similarly, the following snapshot shows various possible breakdowns of Higher Time Frame (HTF) cycles into smaller Lower Time Frame (LTF) movements. The chart contains a white table(not part of the indicator and shown for illustration purposes only).
To further illustrate. Consider the combination of Time Frames (TF) from the 2nd row (from the above snapshot). Cycle TF (1M), Setup TF (1W), Momentum TF (1D) etc.
Price movements in the 1M TF highlight the direction in which HTF traders are pushing the market. Often, when markets have broken out of a level, they tend to form a peak and can then pull back towards the prior breakout level. Once the pullback is beyond the last breakout level, in the opposite direction, we may say the peak formation is created, and directional bias has changed. This is also called Peak Fakeout. Due to the fractal nature of the market, Swing Points on the HTF will often constitute multiple Swing Points on the LTF, though they are not always in sync. However, after such peak formation, there is a high probability that the price might move away from the peak for at least 1 candle (in the cycle TF). This theory illustrates that once a new cycle is in play, we can then look at 1W (Setup TF) to look for possible in-sync movements, at least within that 1 candle of the HTF. Repeating the same for further lower TFs, we may arrive at a confluence of Fractal Bias and see how the movements in LTF are driven by the HTF momentum.
Another example within the chart:
Note: The above examples are just for illustration purposes, and other permutations and combinations of movements across multiple TFs are also possible.
This indicator aims to help users identify such fractal-bias-confluences, so that they can leverage the fractal nature of the market to get a holistic view. To do so, the indicator displays how the market has moved across multiple time frames, with respect to different historical levels.
Features:
1. The bias summary table
The following snapshot depicts the bias summary table at the bottom right of the chart.
1.1. Workings: The table will display, for various TFs, in the first four (starting from "current" to Prev ) rows, one of the following.
"F/H" , " Acronym for the failed break of the previous high",
"F/L" , " Acronym for the failed break of the previous low",
"B/H" , " Acronym for the break of the previous high",
"B/L" , " Acronym for the break of the previous low",
"IN" , " Acronym for an inside candle (never broke high or low of perv candle)",
"OT" , " Acronym for an outside candle (broke both high and low of previous candle and closing price is in between previous high and low)".
Note: these acronyms are customizable according to the user's choice of terminology in any language, as shown in the snapshot below.
1.1.1 In the above snapshot, the 1st row, called "Current", shows how the current candle is evolving with respect to the previous one. The "previous" row shows how the previous candle closed with respect to the pre-previous one. The next two rows represent the bias of the pre-previous and pre-pre-previous in a similar manner. By default, the bias is updated in real-time, even for the already closed historical candles. For example, if the previous 4H candle closed as a B/H and the current price then comes below the pre-previous 4H candle high, then the bias of the previous candle will get updated to F/H. This informs the user that the break above the pre-previous high has failed. However, the user has the option to turn this off. The information in these four rows shows the user how the market is moving currently and how it evolved before reaching the current price levels.
Note: The calculation done by the indicator is to keep track of how the price is moving with respect to the last candle levels in real-time. This means if the price first goes above the previous high and then goes below the previous low, the indicator is equipped to display what happened in the most recent time. The snapshot below shows the option to turn on/off such updates in the bias summary table.
Note: While the bias summary table is turned on, the user also has the option to turn off Prev and Prev rows, as shown in the snapshot below.
1.1.2 The 2nd to last row, called CL/CS(Consecutive Long/Short), shows whether consecutive (2+) breaks of high/low happened or not in one direction without taking out the previous candle's range in the opposite direction. When conditions are met, it will show the number of times the price has been pushed in one direction (in the above manner), followed by "L" for long and "S" for short, for each TF, for example, "4L". It gets updated in real-time for each push in the same direction. Furthermore, a good analogy of "4L" on an HTF is 4 consecutive Break of Structure (BOS) (in the same direction) on LTF, without a Change of Character (CHoCH). Another example would be Stacey Burke's 3 consecutive rises that can be mapped in the indicator, if the conditions are met for "3L" for a given TF.
1.1.3 The last row, FRC/FGC, stands for the first red/green candle. It shows whether the last candle of a TF has closed as green (i.e., close>open) after posting two red candles (i.e., close

ADVDEC.US OSCILLATORThis Pine Script implements an ADVDEC.US Oscillator, which is an indicator designed to analyze the Advance-Decline index (ADVDEC.US) with multiple smoothing techniques and timeframes. Here's what the script does:
Symbol and Inputs:
- The script is based on the ADVDEC.US index, which measures the difference between advancing and declining stocks.
Users can adjust several settings:
- Lookback Period: Defines the number of periods over which the highest and lowest values of the ADVDEC.US index are calculated.
- Smoothing Period: Smooths the oscillator with a simple moving average (SMA) to reduce market noise.
- EMA Period: Applies an Exponential Moving Average (EMA) to the smoothed oscillator for further trend analysis.
- MTF Period: Allows for fetching data from a specified timeframe (default is 5 minutes).
Calculation:
- It calculates the highest and lowest values of the ADVDEC index over the defined lookback period.
- It normalizes the ADVDEC value into a percentage between 0 and 100, representing the position of the current value relative to the range over the lookback period.
- This raw oscillator is then smoothed with an SMA to reduce choppiness.
- Finally, an EMA is calculated on the smoothed oscillator to emphasize the trend direction.
Thresholds:
- Horizontal lines are plotted at key levels (70, 30, and 50) for visual reference, offering an "RSI-style" interpretation of the oscillator.
- The upper and lower thresholds can indicate overbought/oversold conditions, while the midline helps identify neutral levels.
Visualization:
- The smoothed oscillator is plotted in blue.
- The EMA of the smoothed oscillator is plotted in orange.
In summary, this indicator aims to visualize the relationship between advancing and declining stocks with added smoothing and trend-following elements, providing an easy-to-interpret oscillator that can be used for market analysis or decision-making.

QuantFrame | FractalystWhat’s the purpose of this indicator?
The purpose of QuantFrame is to provide traders with a systematic approach to analyzing market structure, eliminating subjectivity, and enhancing decision-making. By clearly identifying and labeling structural breaks, QuantFrame helps traders:
1. Refine Market Analysis: Transition from discretionary market observation to a structured framework.
2. Identify Key Levels: Highlight important liquidity and invalidation zones for potential entries, exits, and risk management.
3. Streamline Multi-Timeframe Analysis: Track market trends and structural changes across different timeframes seamlessly.
4. Enhance Consistency: Reduce guesswork by following a rule-based methodology for identifying structural breaks.
How Does This Indicator Identify Market Structure?
1. Swing Detection
• The indicator identifies key swing points on the chart. These are local highs or lows where the price reverses direction, forming the foundation of market structure.
2. Structural Break Validation
• A structural break is flagged when a candle closes above a previous swing high (bullish) or below a previous swing low (bearish).
• Break Confirmation Process:
To confirm the break, the indicator applies the following rules:
• Valid Swing Preceding the Break: There must be at least one valid swing point before the break.
3. Numeric Labeling
• Each confirmed structural break is assigned a unique numeric ID starting from 1.
• This helps traders track breaks sequentially and analyze how the market structure evolves over time.
4. Liquidity and Invalidation Zones
• For every confirmed structural break, the indicator highlights two critical zones:
1. Liquidity Zone (LIQ): Represents the structural liquidity level.
2. Invalidation Zone (INV): Acts as Invalidation point if the structure fails to hold.
What do the extremities show us on the charts?
When using QuantFrame for market structure analysis, the extremities—Liquidity Level (LIQ) and Invalidation Level (INV)—serve as critical reference points for understanding price behavior and making informed trading decisions.
Here's a detailed explanation of what these extremities represent and how they function:
Liquidity Level (LIQ)
Definition: The Liquidity Level is a key price zone where the market is likely to retest, consolidate, or seek liquidity. It represents areas where orders are concentrated, making it a high-probability reaction zone.
Purpose: Traders use this level to anticipate potential pullbacks or continuation patterns. It helps in identifying areas where price may pause or reverse temporarily due to the presence of significant liquidity.
Key Insight: If a candle closes above or below the LIQ, it results in another break of structure (BOS) in the same direction. This indicates that price is continuing its trend and has successfully absorbed liquidity at that level.
Invalidation Level (INV)
Definition: The Invalidation Level marks the threshold that, if breached, signifies a structural shift in the market. It acts as a critical point where the current market bias becomes invalid.
Purpose: This level is often used as a stop-loss or re-evaluation point for trading strategies. It ensures that traders have a clear boundary for risk management.
Key Insight: If a candle closes above or below the INV, it signals a shift in market structure:
A closure above the INV in a bearish trend indicates a shift from bearish to bullish bias.
A closure below the INV in a bullish trend indicates a shift from bullish to bearish bias.
What does the top table display?
The top table in QuantFrame serves as a multi-timeframe trend overview. Here’s what it provides:
1. Numeric Break IDs Across Multiple Timeframes:
• Each numeric break corresponds to a confirmed structural break on a specific timeframe, helping traders track the most recent breaks systematically.
2. Trend Direction via Text Color:
• The color of the text reflects the current trend direction:
• Blue indicates a bullish structure.
• Red signifies a bearish structure.
3. Higher Timeframe Insights Without Manual Switching:
• The table eliminates the need to switch between timeframes by presenting a consolidated view of the market trend across multiple timeframes, saving time and improving decision-making.
What is the Multi-Timeframe Trend Score (MTTS)?
MTTS is a score that quantifies trend strength and direction across multiple timeframes.
How does MTTS work?
1. Break Detection:
• Analyzes bullish and bearish structural breaks on each timeframe.
2. Trend Scoring:
• Scores each timeframe based on the frequency and quality of bullish/bearish breaks.
3. MTTS Calculation:
• Averages the scores across all timeframes to produce a unified trend strength value.
How is MTTS interpreted?
• ⬆ (Above 50): Indicates an overall bullish trend.
• ⬇ (Below 50): Suggests an overall bearish trend.
• ⇅ (Exactly 50): Represents a neutral or balanced market structure.
How to Use QuantFrame?
1. Implement a Systematic Market Structure Framework:
• Use QuantFrame to analyze market structure objectively by identifying key structural breaks and marking liquidity (LIQ) and invalidation (INV) zones.
• This eliminates guesswork and provides a clear framework for understanding market movements.
2. Leverage MTTS for Directional Bias:
• Refer to the MTTS table to identify the multi-timeframe directional bias, giving you the broader market context.
• Align your trading decisions with the overall trend or structure to improve accuracy and consistency.
3. Apply Your Preferred Entry Model:
• Once the market context is clear, use your preferred entry model to capitalize on the identified structure and trend.
• Manage trades dynamically as price delivers, using the provided liquidity and invalidation zones for risk management.
What Makes QuantFrame Original?
1. Objective Market Structure Analysis:
• Unlike subjective methods, QuantFrame uses a rule-based approach to identify structural breaks, ensuring consistency and reducing emotional decision-making.
2. Multi-Timeframe Integration:
• The MTTS table consolidates trend data across multiple timeframes, offering a bird’s-eye view of market trends without the need to switch charts manually.
• This unique feature allows traders to align strategies with higher-timeframe trends for more informed decision-making.
3. Liquidity and Invalidation Zones:
• Automatically marks Liquidity (LIQ) and Invalidation (INV) zones for every structural break, providing actionable levels for entries, exits, and risk management.
• These zones help traders define their risk-reward setups with precision.
4. Dynamic Trend Scoring (MTTS):
• The Multi-Timeframe Trend Score (MTTS) quantifies trend strength and direction across selected timeframes, offering a single, consolidated metric for market sentiment.
• This score is visualized with intuitive symbols (⬆, ⬇, ⇅) for quick decision-making.
5. Numeric Labeling of Breaks:
• Each structural break is assigned a unique numeric ID, making it easy to track, analyze, and backtest specific market scenarios.
6. Systematic Yet Flexible:
• While it provides a structured framework for market analysis, QuantFrame seamlessly integrates with any trading style. Traders can use it alongside their preferred entry models, adapting it to their unique strategies.
7. Enhanced Market Context:
• By combining structural insights with directional bias (via MTTS), the indicator equips traders with a complete market context, enabling them to make better-informed decisions.
Terms and Conditions | Disclaimer
Our charting tools are provided for informational and educational purposes only and should not be construed as financial, investment, or trading advice. They are not intended to forecast market movements or offer specific recommendations. Users should understand that past performance does not guarantee future results and should not base financial decisions solely on historical data.
Built-in components, features, and functionalities of our charting tools are the intellectual property of @Fractalyst use, reproduction, or distribution of these proprietary elements is prohibited.
By continuing to use our charting tools, the user acknowledges and accepts the Terms and Conditions outlined in this legal disclaimer and agrees to respect our intellectual property rights and comply with all applicable laws and regulations.
HTF CandlesHTF Candles, Plot of a Higher/Lower Timeframe Candles on any chart.
This HTF / LTF candle plot displays the previous 3 daily candles with the current update of the price with reference to a lower time frame.
Candles includes 3 Candles of HTF
last HTF candle includes 4 previous candles from LTF
Candle High Low Open Close are plotted.
these OHLC values act as Support and Resistance With reference to current Price.
very useful in making HTF and LTF analysis with reference to current timeframe.

goose's session + killzone indicatorA powerful, multi-functional TradingView script designed for forex traders. It visually delineates major market sessions—Asia, London, and New York—on the chart, provides customizable session ranges, pip range counters, and configurable “killzone” markers. The indicator allows users to switch between a traditional line-and-fill style and a historical box style for session visualization, offering both real-time and historical context of market ranges.
Key Features:
1. Session Visualization Options:
• Lines & Fill Style:
• Highlights active sessions using dynamic lines and filled areas that update in real-time.
• Displays session high, low, and mid-range boundaries with customizable colors, border widths, and line styles.
• Historical Boxes Style:
• Creates and retains boxes for each past session, enabling users to review historical session ranges over extended periods.
• Each session box is drawn with user-defined fill and border colors, opacity, and line styles, anchored to the session’s high, low, and timeframe.
• Supports viewing multiple historical sessions at once, up to a configurable limit.
2. Pip Range Counters:
• Displays the range of pips for each active session, anchored to a fixed position near the bottom-right corner of the session.
• Uses arrow-style labels (label.style_label_up/down) to maintain a stable visual offset relative to the session, minimizing movement during vertical zoom.
• Customizable text size, color, and vertical offset, ensuring the pip counter remains legible and unobtrusive.
3. Killzone Lines:
• Allows users to define up to 15 custom “killzone” times with specific line colors, styles, and optional labels.
• Each killzone is drawn precisely when the price crosses the user-specified time, marking important market events or transitions.
4. User Configurations:
• Session Times: Fully adjustable start and end times for Asian, London, and New York sessions.
• Color & Style Settings:
• Customizable fill and border colors (with adjustable opacity) for each session style.
• User-friendly dropdowns and checkboxes for setting line styles, widths, and text sizes.
• Display Mode Selector:
• A dropdown (sessionStyle) lets users toggle between “Lines & Fill” and “Historical Boxes” for session visualization.
• Pip Counter and Killzone Settings:
• Options to show or hide pip counters, match label colors to session fills, and configure killzone appearance individually.
5. Robust Utility Functions:
• Functions to parse user-input times, determine if the current time falls within a session, and calculate session ranges.
• Historical session logic that detects session transitions and creates/upgrades boxes accordingly.
How It Works:
• Session Style Selection:
• Users choose their preferred visualization style via the sessionStyle dropdown.
• If “Lines & Fill” is selected, the indicator plots dynamic lines and fills during active sessions.
• If “Boxes” is selected, the indicator creates historical boxes that outline the range of each past session, persisting on the chart until session boundaries change.
• Pip Counter Labeling:
• During an active session, the pip counter calculates the range between the session’s high and low and displays it as text positioned just below the bottom-right corner of the session.
• The use of arrow-style labels ensures the text remains at a stable visual distance from the session’s outline, even when zooming vertically.
• Killzones:
• Users can define specific times (“killzones”) where important market events occur.
• When the price crosses these times, the script draws lines and optional labels with user-defined appearance settings.
Ideal Use Cases:
• Real-Time Trading: Quickly identify current session ranges, pip sizes, and crucial killzone markers during live trading.
• Historical Analysis: Switch to Historical Boxes to review past session ranges over days, weeks, or months, aiding in pattern recognition and strategy refinement.
• Customization: Tailor the appearance to match personal preferences or chart themes, including colors, styles, line widths, and label sizes.
This comprehensive indicator combines real-time session tracking with historical range visualization and customizable killzones. Its dual display modes, extensive settings, and stable pip counter labels make it a versatile tool for forex traders seeking to analyze market sessions both in the moment and retrospectively.

TradeShields Strategy Builder🛡 WHAT IS TRADESHIELDS?
This no-code strategy builder is designed for traders on TradingView, offering an intuitive platform to create, backtest, and automate trading strategies. While identifying signals is often straightforward, the real challenge in trading lies in managing risk and knowing when not to trade. It equips users with advanced tools to address this challenge, promoting disciplined decision-making and structured trading practices.
This is not just a collection of indicators but a comprehensive toolkit that helps identify high-quality opportunities while placing risk management at the core of every strategy. By integrating customizable filters, robust controls, and automation capabilities, it empowers traders to align their strategies with their unique objectives and risk tolerance.
_____________________________________
🛡 THE GOAL: SHIELD YOUR STRATEGY
The mission is simple: to shield your strategy from bad trades . Whether you're a seasoned trader or just starting, the hardest part of trading isn’t finding signals—it’s avoiding trades that can harm your account. This framework prioritizes quality over quantity , helping filter out suboptimal setups and encouraging disciplined execution.
With tools to manage risk, avoid overtrading, and adapt to changing market conditions, it protects your strategy against impulsive decisions and market volatility.
_____________________________________
🛡 HOW TO USE IT
1. Apply Higher Timeframe Filters
Begin by analyzing broader market trends using tools like the 200 EMA, Ichimoku Cloud, or Supertrend on higher timeframes (e.g., daily or 4-hour charts).
- Example: Ensure the price is above the 200 EMA on the daily chart for long trades or below it for short trades.
2. Identify the Appropriate Entry Signal
Choose an entry signal that aligns with your model and the asset you're trading. Options include:
Supertrend changes for trend reversals.
Bollinger Band touches for mean-reversion trades.
RSI strength/weakness for overbought or oversold conditions.
Breakouts of key levels (e.g., daily or weekly highs/lows) for momentum trades.
MACD and TSI flips.
3. Determine Take-Profit and Stop-Loss Levels
Set clear exit strategies to protect your capital and lock in profits:
Use single, dual, or triple take-profit levels based on percentages or price levels.
Choose a stop-loss type, such as fixed percentage, ATR-based, or trailing stops.
Optionally, set breakeven adjustments after hitting your first take-profit target.
4. Apply Risk Management Filters
Incorporate risk controls to ensure disciplined execution:
Limit the number of trades per day, week, or month to avoid overtrading.
Use time-based filters to trade during specific sessions or custom windows.
Avoid trading around high-impact news events with region-specific filters.
5. Automate and Execute
Leverage the advanced automation features to streamline execution. Alerts are tailored specifically for each supported platform, ensuring seamless integration with tools like PineConnector, 3Commas, Zapier, and more.
_____________________________________
🛡 CORE FOCUS: RISK MANAGEMENT, AUTOMATION, AND DISCIPLINED TRADING
This builder emphasizes quality over quantity, encouraging traders to approach markets with structure and control. Its innovative tools for risk management and automation help optimize performance while reducing effort, fostering consistency and long-term success.
_____________________________________
🛡 KEY FEATURES
General Settings
Theme Customization : Light and dark themes for a tailored interface.
Timezone Adjustment : Align session times and news schedules with your local timezone.
Position Sizing : Define lot sizes to manage risk effectively.
Directional Control : Choose between long-only, short-only, or both directions for trading.
Time Filters
Day-of-Week Selection : Enable or disable trading on specific days.
Session-Based Trading : Restrict trades to major market sessions (Asia, London, New York) or custom windows.
Custom Time Windows : Precisely control the timeframes for trade execution.
Risk Management Tools
Trade Limits : Maximum trades per day, week, or month to avoid overtrading.
Automatic Trade Closures : End-of-session, end-of-day, or end-of-week options.
Duration-Based Filters : Close trades if take-profit isn’t reached within a set timeframe or if they remain unprofitable beyond a specific duration.
Stop-Loss and Take-Profit Options : Fixed percentage or ATR-based stop-losses, single/dual/triple take-profit levels, and breakeven stop adjustments.
Economic News Filters
Region-Specific Filters : Exclude trades around major news events in regions like the USA, UK, Europe, Asia, or Oceania.
News Avoidance Windows : Pause trades before and after high-impact events or automatically close trades ahead of scheduled news releases.
Higher Timeframe Filters
Multi-Timeframe Tools : Leverage EMAs, Supertrend, or Ichimoku Cloud on higher timeframes (Daily, 4-hour, etc.) for trend alignment.
Chart Timeframe Filters
Precision Filtering : Apply EMA or ADX-based conditions to refine trade setups on current chart timeframes.
Entry Signals
Customizable Options : Choose from signals like Supertrend, Bollinger Bands, RSI, MACD, Ichimoku Cloud, or EMA pullbacks.
Indicator Parameter Overrides : Fine-tune default settings for specific signals.
Exit Settings
Flexible Take-Profit Targets : Single, dual, or triple targets. Exit at significant levels like daily/weekly highs or lows.
Stop-Loss Variability : Fixed, ATR-based, or trailing stop-loss options.
Alerts and Automation
Third-Party Integrations : Seamlessly connect with platforms like PineConnector, 3Commas, Zapier, and Capitalise.ai.
Precision-Formatted Alerts : Alerts are tailored specifically for each platform, ensuring seamless execution. For example:
- PineConnector alerts include risk-per-trade parameters.
- 3Commas alerts contain bot-specific configurations.
_____________________________________
🛡 PUBLISHED CHART SETTINGS: 15m COMEX:GC1!
Time Filters : Trades are enabled from Tuesday to Friday, as Mondays often lack sufficient data coming off the weekend, and weekends are excluded due to market closures. Custom time sessions are turned off by default, allowing trades throughout the day.
Risk Filters : Risk is tightly controlled by limiting trades to a maximum of 2 per day and enabling a mechanism to close trades if they remain open too long and are unprofitable. Weekly trade closures ensure that no positions are carried over unnecessarily.
Economic News Filters : By default, trades are allowed during economic news periods, giving traders flexibility to decide how to handle volatility manually. It is recommended to enable these filters if you are creating strategies on lower timeframes.
Higher Timeframe Filters : The setup incorporates confluence from higher timeframe indicators. For example, the 200 EMA on the daily timeframe is used to establish trend direction, while the Ichimoku cloud on the 30-minute timeframe adds additional confirmation.
Entry Signals : The strategy triggers trades based on changes in the Supertrend indicator.
Exit Settings : Trades are configured to take partial profits at three levels (1%, 2%, and 3%) and use a fixed stop loss of 2%. Stops are moved to breakeven after reaching the first take profit level.
_____________________________________
🛡 WHY CHOOSE THIS STRATEGY BUILDER?
This tool transforms trading from reactive to proactive, focusing on risk management and automation as the foundation of every strategy. By helping users avoid unnecessary trades, implement robust controls, and automate execution, it fosters disciplined trading.

Intelligent Support & Resistance Lines (MTF)This script automatically detects and updates key Support & Resistance (S/R) levels using a higher timeframe (MTF) approach. By leveraging volume confirmation, levels are only identified when significant volume (relative to the SMA of volume) appears. Each level is drawn horizontally in real time, and whenever the market breaks above a resistance level (and retests it), the script automatically converts that resistance into support. The opposite occurs if the market breaks below a support level.
Key Features:
Multi-Timeframe (MTF) Data
Select a higher timeframe for more robust S/R calculations.
The script fetches High, Low, Volume, and SMA of Volume from the chosen timeframe.
Automatic Role Reversal
Resistance becomes Support if a breakout retest occurs.
Support becomes Resistance if a breakdown retest occurs.
Dynamic Line Width & Labeling
Each S/R line’s thickness increases with additional touches, making frequently tested levels easier to spot.
Labels automatically display the number of touches (e.g., “R 3” or “S 2”) and can have adjustable text size.
Volume Threshold
Only significant pivots (where volume exceeds a specified multiplier of average volume) are plotted, reducing noise.
Horizontal Offset for Clarity
Lines are drawn with timestamps instead of bar_index, ensuring that old levels remain visible without chart limitations.
Adjustable Maximum Levels
Maintain a clean chart by limiting how many S/R lines remain at once.
How It Works:
Pivot Detection: The script identifies swing highs and lows from the higher timeframe (timeframeSR).
Volume Check: Only pivots with volume ≥ (SMA Volume * volumeThreshold) qualify.
Line Creation & Updates: New lines are drawn at these pivots, labeled “R #” or “S #,” indicating how many times they’ve been touched.
Role Reversal: If price breaks above a resistance and retests it from above, that line is removed from the resistance array and re-created in the support array (and vice versa).
Inputs:
Timeframe for S/R: Choose the higher timeframe for S/R calculations.
Swing Length: Number of bars to consider in a pivot calculation.
Minimum Touches: Minimum required touches before drawing or updating a level.
Volume Threshold (Multiplier): Determines how much volume (relative to SMA) is needed to confirm a pivot.
Maximum Number of Levels: Caps how many S/R lines can be shown at once.
Color for Resistance & Color for Support: Customize your preferred colors for lines and labels.
Label Size: Select from "tiny", "small", "normal", "large", or "huge" to resize the labels.
Disclaimer:
This script is intended for educational purposes and should not be interpreted as financial or investment advice. Always conduct your own research or consult a qualified professional before making trading decisions.
