Stellar/USD Total VolumesHello traders!
This tool shows you Stellar/USD total trade volumes from the all (well, almost) cryptocurrency exchanges on different timeframes.
Alerts included.
Supported timeframes
"1"
"3"
"5"
"10"
"15"
"30"
"45"
"60" - 1 hour
"120" - 2 hours
"180" - 3 hours
"240" - 4 hours
"300" - 5 hours
"360" - 6 hours
"420" - 7 hours
"480" - 8 hours
"540" - 9 hours
"600" - 10 hours
"660" - 11 hours
"720" - 12 hours
"780" - 13 hours
"840" - 14 hours
"900" - 15 hours
"960" - 16 hours
"1020" - 17 hours
"1080" - 18 hours
"1140" - 19 hours
"1200" - 20 hours
"1260" - 21 hours
"1320" - 22 hours
"1380" - 23 hours
"D"
"2D"
"3D"
"W"
"M"
How to get access
Buy for only 20$ to get lifetime access to this indicator
Like and follow for more cool indicators!
Happy Trading!
Timeframes

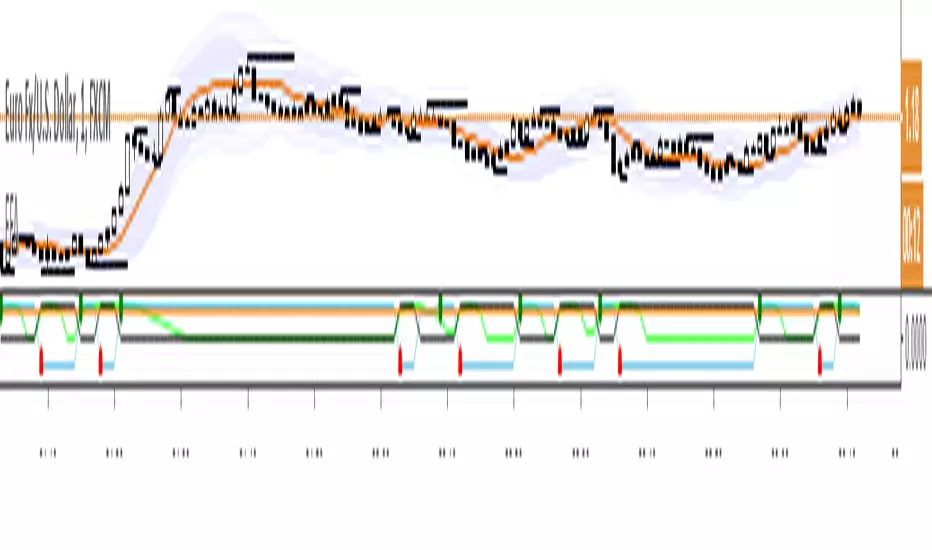
Rebrush of Rafael Zioni's Inverse Fisher RSI-MTF2See the original:
This is indeed a cute idea of the author, but some times this wonderful indicator raises false flags.
In order to see what is going on, put the code into indicator section of the chart.
My solution is to add variance line (in lime color) and use variance as a filter.
Power Moving Average PRO by Nico Muselle
Did you ever want to apply the Daily Moving Averages to an hourly chart ?
Are you tired of switching between time frames for seeing where that moving average is on the higher time frame ?
Do you want to display these moving averages on your current time frame ?
NOW YOU CAN !
In comes the Power Moving Average which offers you the opportunity to :
Display moving averages of any (higher) time frame you wish
Select which type of Moving Average you want to display
Select up to 3 different types, lengths and time frames to display
Power Moving Average offers the following types of averages :
SMA - Simple Moving Average
Read more: Simple Moving Average (SMA) www.investopedia.com
EMA - Exponential Moving Average
Read more: Exponential Moving Average (EMA) www.investopedia.com
WMA - Weighted Moving Average
Read more: Linearly Weighted Moving Average www.investopedia.com
VWMA - Volume Weighted Moving Average
Read more : www.tradingsetupsreview.com
RMA
Read more : partners.futuresource.com
See the configuration options here :
i.imgur.com
Q : Why are the Power Moving Averages not smooth historically ?
A : As the moving average is calculated on the close of the higher time frame and this close does not change for X- candles, the moving value does not change
Q : Can I add more than one Power Moving Average ?
A : Yes you can, just apply the Power Moving Average multiple times to your chart (free TradingView accounts are limited to 3 indicators)
Q : Can I apply lower time frame Moving Averages ?
A : While this is possible, the value will change during your current time frame candle, this might however be something scalpers want ?
Q : I have a free TradingView account and reached my indicator limit, what can I do ?
A : There are 2 possible solutions, first one is to get a TradingView Pro account (www.tradingview.com), second option is to get our Triple Power Moving Average for a one time price. Please PM for more information.
If you like this script, DM me for access ! Also check out my other indicators here : www.tradingview.com
FYI : A free version with 1 Moving average is available for everyone here :
Thank you !

CCI_three_timeframesThis script shows three CCIs in one frame, three different frames (20,140,3360) on the same chart.
Purely for for visual purposes values multiplied with e.
CCI is using simple moving average and mean deviation, a basic versatile momentum oscillator-indicator.
Useful for 2h charts.

KTS 0.1a [BETA]VERY early release of KTS for those who have contributed to the early efforts of the upcoming Kawaii Trading Suite package.
When you first add this to a chart- nothing will happen. You need to enable the features you want in the indicator's settings menu. Many of these are based off of indicators i've already published (and are linked for in-depth description). The following features available:
Daily Support/Resistance levels
Hourly Support/Resistance levels
General Support/Resistance levels
The three above use the same algorithm but are designed for different timeframes.
Renko Bar Overlay (overlays a Renko chart on any timeframe you want)
Renko Signal Overlay (for those who want to know when renkos go green/red without the giant overlay)
The two above indicators use 1D renkos by default (since that's the shortest TV lets free accounts use) but you can use any timeframe you wish in settings.
Alt Sentiment Signal overlay (Simple up/down arrow when altcoin sentiment changes)
Witchcraft support/resistance clouds (can be toggled individually)
Planned but not-yet-finished features include:
Ichimokou Clouds
Golden Cross signal
Plus many more things I haven't posted anywhere else yet. Be aware that beyond this point, anyone wishing to try this product will have to pay a reasonable fee. Please do not message me asking for access to private indicators if you have no intention of paying for them.

4 Time Frame Two EMAs Ribbon Comparison - Tom1traderI had seen something like this on metatrader but not here. Since I use TradingView and not metatrader had some fun with this. Indicates up or down for 4 chosen time Frames and as such helps to see the historical trend. Works best on daily or shorter charts because of load time.
User can choose the length of the two exponential moving averages used on each time frame or use defaults 9 and 15.
User can choose the 4 time frames defaults are (display from top to bottom) 5, 15, 60 and D.
Displays a column of 4 dots or circles for each bar of current chart the top being the shortest time frame.
If the faster exponential moving average is above the slower (uptrend) the dot is green else red.
This is similar (actually what I was originally shooting for but took extra time to figure out time frames on here) to another script of mine that has the same display method but uses a spaced set of Hull Moving Averages on one time frame, you choose the shortest length and the space increment between the averages. One may work better than the other for different markets or trading styles. The other one is here: Have fun trading and keep smiling!

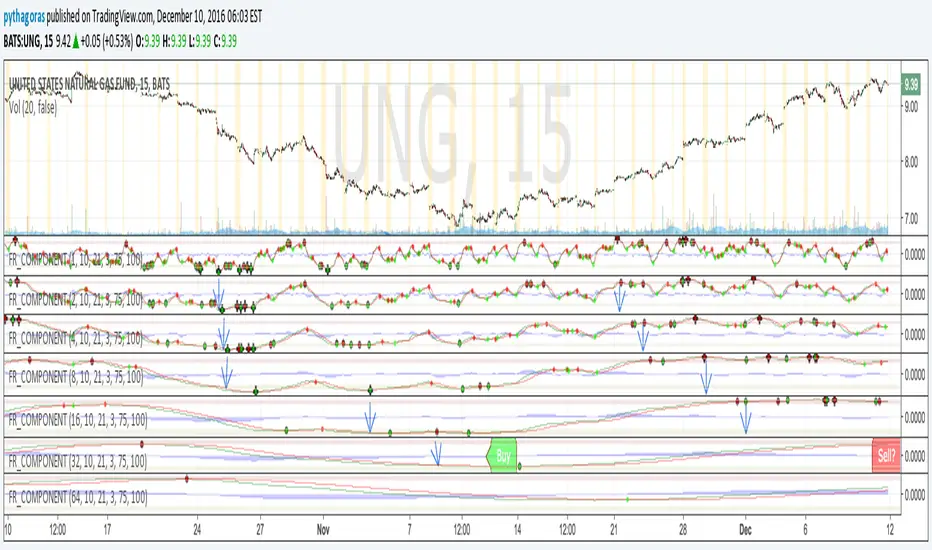
Fractal Resonance ComponentLazyBear's WaveTrend port has been praised for highlighting trend reversals with precision and punctuality (minimal lag). But strong "3rd Wave" trends can "embed" or saturate any oscillator flashing several premature crosses while stuck overbought/oversold. This happens when the trend stretches over a longer timescale than the oscillator's averaging window or filter time constant. Our solution: simultaneously monitor many oscillator timescales. Watch for fresh crossovers in "dominant" timescales alternating most smoothly between the overbought (red shade) and oversold (green shade) range.
Fractal Resonance Component facilitates simultaneous viewing of eight timescales that are power of 2 multiples of the chart timescale. Each timescale shows lead line, lag line, lead-lag difference, and crossover marks. Add 4 to 8 copies to your chart for a good multi-fractal read. Format * the "Timescale Multiplier" attribute of each row to be twice that of the row above for a sequence like 1, 2, 4, 8, 16, 32, 64, 128...
Fractal Resonance Component shifts its timescales along with your choice of main chart timescale:
1 minute chart: 1 minute through 128 minute (~2 hour) oscillators.
1 hour chart: 1 hour through 128 hour (~2 week) oscillators.
Daily chart: 1 day through 128 day (~4 month) oscillators.
Crossovers in different oscillator ranges tend to have different meanings:
Minor (< 75%) crossovers: small green/red dot
usually noise
Overbought/Sold crossovers (shaded 75 to 100%): black outlined dot (o)
reliable reversal indicators (when they appear alone)
Extreme Overbought (> 100%) crossovers: black outlined plus (+).
Can be a major reversal in fast markets, but usually portend the end of Elliot 3rd waves with just a small corrective (4th wave) retrace before the larger impulsive (5-wave) sequence resumes in original direction.
The final 5th-wave terminus should appear later as a lone non-extreme (black outlined circle) crossover on a slower timescale coincident with weaker (non-extreme) dot crosses on this timescale.
Careful examination of historical charts leads to many useful observations such as:
Dominant crossovers punctuating true reversals are usually in the green/red shaded ranges with black outlined dots (o) rather than minor or Extreme (+) ranges.
Due to market's fractal nature, two well-separated timescales like 1 minute and 1 hour can show dominant crosses simultaneously in opposite directions, e.g. the 1 minute showing a very short term high and the 1 hour a medium term low nearby.
Staying Nimble
Watch out for embedding on your supposedly dominant timescale -- a second cross while stuck in the overbought/oversold region suggests a stronger, longer trend than expected. Drop your eyes to a slower timescale below for the real dominant whose crossover will validate main trend reversal.
Embedding can often be predicted even at the first cross mark by checking whether the green lead line of the next slower timescale (one row below) has already hit the Overbought or especially the Extreme Overbought range but isn't close to rolling over. Fractal Resonance Bar (to be published) uses this principle to mark embedded timescales with white stripes, warning of a powerful trend wave on longer timescales you shouldn't fight until the white stripes subside.
Overnight gaps surge all timescales in ways that obscure the dominant timescale, so for shorter than daily charts, these methods work best on Futures contracts that only suffer weekend gaps.