Volatility Weighted Moving Average + Session Average linesHi Traders !
Just finished my Y2 university finals exams, and thought I would cook up a quick and hopefully useful script.
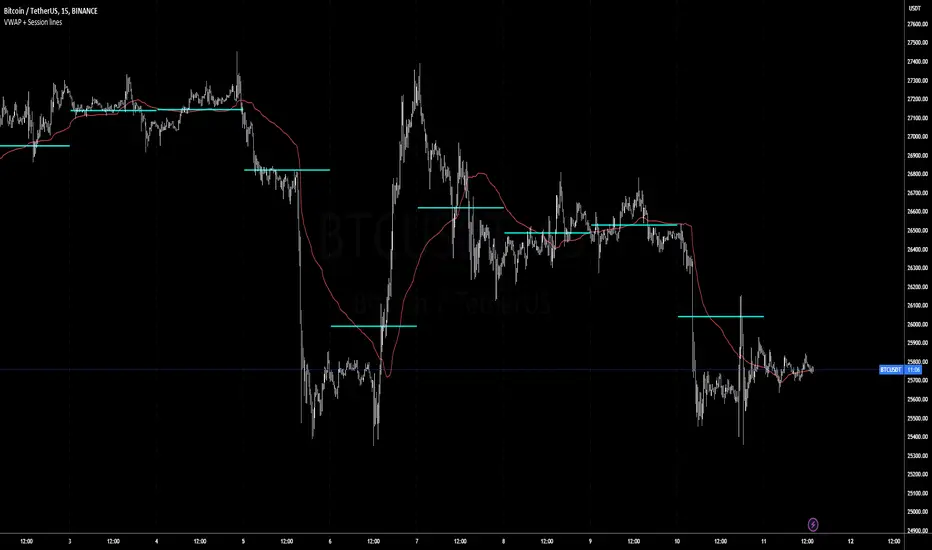
VWAP + Session Average Lines :
Volatility Weighted Average Price in the standard case is a trading indicator that measures the average trading price for the user defined period, usually a standard session (D timeframe), & is used by traders as a trend confirmation tool.
This VWAP script allows for altering of the session to higher dimensions (D, W, M) or those of lower dimension (H4, or even H1 timeframes), furthermore this script allows the lookback of data to be switched from the standard session to a user defined amount of bars (e.g. the VWAP of 200 bars as opposed to the VWAP of a standard session which contains 95 bars in M15 timeframe for 24/7 traded assets e.g. BTCUSD), lastly this script plots Session VWAP Average Lines (if true in settings) so tradaes can gauge the area of highest liquidity within a session, this can be interpreted as the fair price within a session. If Average lines are increasing and decreasing consistently like a monotonic function this singles traders interest is at higher / lower prices respectively (Bullish / Bearish bias respectively ?), However if Average lines are centered around the same zones without any major fluctuations this signals a ranging market.
VWAP calculation :
VWAP is derived from the ratio of the assets value to total volume of transactions where value is the product of typical price (Average of high, low and close bars / candles) and corresponding bar volume, value can be thought of as the dollar value traded per bar.
How is VWAP used by Institutions / Market movers :
For some context and general information, VWAP is typically used by Market movers (e.g. Hedge funds, Mutual funds ,..., ...) in their trade execution, as trading at the VWAP equals the area of highest market volume, trading in line with the volume of the market reduces transaction costs by minimizing market impact (extra liquidity lowers spreads and lag time between order fills), this overall improves market efficiency.
In my opinion the script is best used with its standard settings on the M15 timeframe, note as of now the script is not functional on certain timeframes, however this script is not intended to be used in these timeframes, i will try fix this code bug as soon as possible.
Tradingview
Crypto Index Percentage GainThis script calculates the percentage gain from the left-most visible candle for multiple cryptocurrency symbols and plots all of them on the chart.
Description:
The "Crypto Index Percentage Gain" indicator calculates the percentage gain from the left-most visible candle for a selection of cryptocurrency symbols. It utilizes the PineCoders VisibleChart library to access the high, low, close, and open prices of the visible chart range.
The user can customize the symbols to include in the calculation by enabling or disabling the corresponding input options. `_open` represents the open price, `_close` represents the close price, and `_gain` represents the calculated percentage gain. The formula used is (close - open) / open * 100 to calculate the percentage change between the open and close prices.
The calculated percentage gains for each symbol are plotted on the chart using different colors and line widths, providing an overview of the relative performance of the symbols.
Usage:
Add the "Crypto Index Percentage Gain" indicator to your trading view chart by searching it in indicator search bar or star it , it will show on your favourite indicators .
Configure the symbols and visibility options using the input parameters.
The indicator will calculate and display the percentage gain for each selected symbol based on the left-most visible candle on the chart.
Code Explanation:
The script imports the PineCoders VisibleChart library for accessing the visible chart range.
It defines a function `f_pcr()` to calculate the percentage gain for a given symbol.
Input options are provided to enable or disable symbols and set their visibility.
Symbols are defined using `input.symbol()` and the percentage gains are calculated using `request.security()`.
The calculated percentage gains for each symbol are plotted on the chart using different colors and line widths.
thanks to @PineCoders for VisibleChart library.

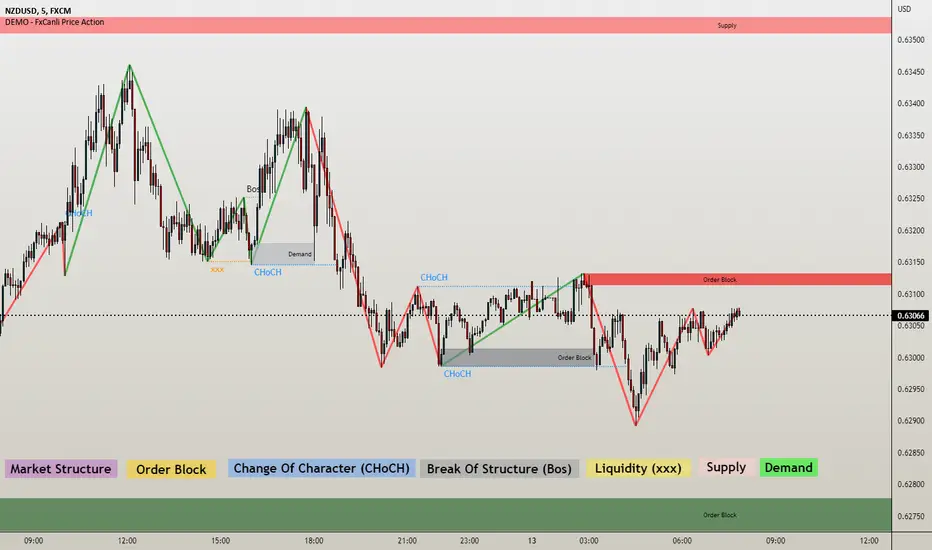
DEMO - FxCanli Price ActionEN - FxCanli TradingView Price Action indicator can draw and alert at everything about PRICE ACTION.
DEMO VERSION of FXCANLI PRICE ACTION Indicator work with any NZD or any DOGE symbols
TR - FxCanli TradingView Price Action indikatörü grafiklerinizde PRICE ACTION ile ilgili tüm çizimleri yapar ve alarm verir.
FXCANLI PRICE ACTION indikatörünün DEMO VERSİYONUNU herhangi bir NZD veya DOGE sembolü ile kullanabilirsiniz.
EN - For Example | TR - Örnek
NZD|...
NZD|USD
NZD|CAD
NZD|CHF
NZD|JPY
DOGE|...
DOGE|USD
DOGE|USDT
DOGE|USDTPERP
DOGE|BTC
EN - FxCanli TradingView Price Action indicator can draw and alert at;
Break of Structure (BOS),
Change of Character (CHoCH),
Liquidity,
Order Block,
Supply & Deman
TR - FxCanli TradingView Price Action indikatörü grafiklerinizde;
Break of Structure (BOS)
Change of Characte (CHoCH)
Liquidity
Order Block
Arz & Talep bölgelerini otomatik olarak çizer ve alarm verir.
Market Structure;
EN - You can easly follow market structure, Up Trend with green waves, Down trend with Red waves
TR - Market yapısını kolayca takip edebilirsiniz. Yukarı trendi yeşil dalgalar ile, Aşağı trendi kırmızı dalgalar ile.
Change of Character (CHoCH)
*************************************
EN - Shows trend reversals
TR - Trend dönüşümlerini gösterir
Break of Structure (BOS)
******************************
EN - Shows trend continuations
TR - Devam eden trendleri gösterir
Liquidity
***********
EN - Shows Liquidity levels
TR - Likidite seviyelerini gösterir
Order Block and Supply&Demend
***************
EN - Shows Order Block and Supply&Demend levels which is a technical analysis technique that tracks the accumulation of orders (when bullish ) and distribution of orders (when bearish ) of banks and institutional traders.
TR - Bankaların ve kurumsalların emir birikimini (yükseliş olduğunda) ve emir dağılımını (düşüş olduğunda) Order Block ve Arz & Talep olarak gösterir.
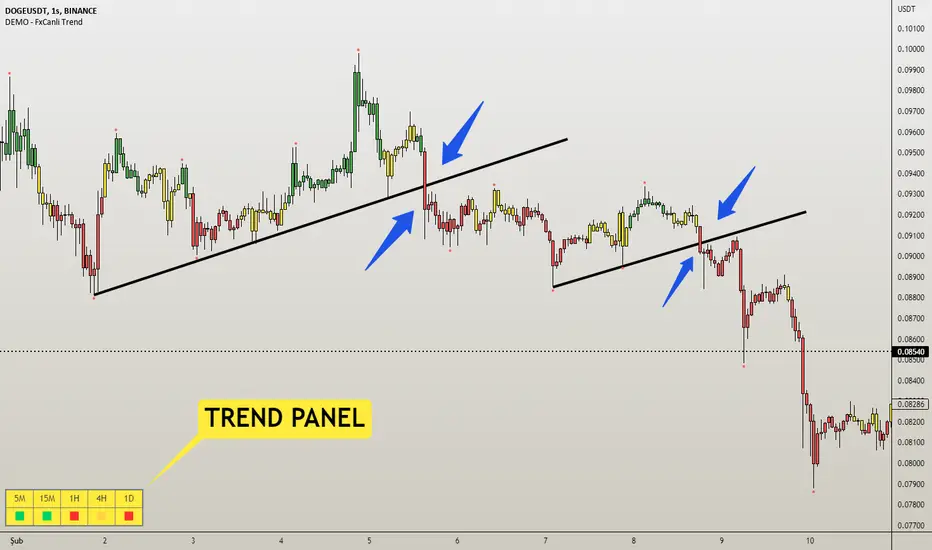
DEMO - FxCanli TrendEN - FxCanli Trend indicator will help you to show the way of the trend and give alerts when trend changed
DEMO VERSION of FXCANLI TREND Indicator work with any NZD or any DOGE symbols
TR - FxCanli Trend İndikatörü grafiklerinizde trendin yönünü veren ve trend değiştiğinde alarm veren TradingView indikatörüdür.
FXCANLI TREND indikatörünün DEMO VERSİYONUNU herhangi bir NZD veya DOGE sembolü ile kullanabilirsiniz.
EN - For Example | TR - Örnek
NZD|...
NZD|USD
NZD|CAD
NZD|CHF
NZD|JPY
DOGE|...
DOGE|USD
DOGE|USDT
DOGE|USDTPERP
DOGE|BTC
EN - FxCanli Trend indicator will help you to show the way of the trend and give alerts when trend changed
When the candles are;
Green Candles - Up Trend
Yellow Candles - Trend may Change
Red Candles - Down Trend
TR - FxCanli Trend İndikatörü grafiklerinizde trendin yönünü veren ve trend değiştiğinde alarm veren TradingView indikatörüdür.
Yeşil Mumlar - Yukarı Trend
Sarı Mumlar - Trend Dönebilir
Kırmızı Mumlar - Aşağı Trend
HOW TO USE BUY & SELL SIGNALS ?
(ALIŞ & SATIŞ SINYALLERI NASIL KULLANILIR?)
1) Never use BUY or SELL signals without any chart patterns. (Alış veya Satış sinyallerini asla formasyonsuz kullanmayın)
it can give good results with the candle color change when chart pattern triggered
(Formasyon gerçekleştiğinde, mum rengi değişimi takip edilmeli)
Ex 1) Wedge Pattern (Takoz Formasyonu) - BTC|USDT
Ex 2) Flag Pattern (Bayrak Formasyonu) - ETC|USDT
Ex 3) Head and Shoulders Pattern ( Omuz Baş Omuz Formasyonu)
Ex 4) Triangle Pattern ( Üçgen Formasyonu)
Features - Özellikler
1) Trend Panel - Trend Paneli
2)EN - Panel Width - to get better view at mobile phones and tablets
TR - Cep telefonları ve tabletlerde daha güzel görünüm için Panel Genişliği
3) Multi Timeframe Trend Tracking - Çoklu Zaman Dilimi Trend Takibi
4) Alert Control / Alarm Kontrolü
EN - Selected Alert - when all timeframes have same trend it will give selected time frame alert
TR - Seçilmiş Zaman Dilimi - Tüm seçilen zaman dilimleri aynı trend olunca, seçilmiş zaman dilimi alarmı verir
DEMO - FxCanli S/REN - FxCanli S&R indicator shows any drawings about Support & Resistance on charts
DEMO VERSION of FXCANLI S&R Indicator work with any NZD or any DOGE symbols
TR - FxCanli S&R indikatörü grafiklerinizde Destek & Direnç ile ilgili tüm çizimleri otomatik yapar
FXCANLI S&R indikatörünün DEMO VERSİYONUNU herhangi bir NZD veya DOGE sembolü ile kullanabilirsiniz.
EN - For Example | TR - Örnek
NZD|...
NZD|USD
NZD|CAD
NZD|CHF
NZD|JPY
DOGE|...
DOGE|USD
DOGE|USDT
DOGE|USDTPERP
DOGE|BTC
**ENGLISH**
This indicator shows;
1) Support Levels (Green Solid Line)
2) Resistance Levels (Red Solid Line)
3) Support Line (Green Dashed Line)
4) Resistance Line (Red Dashed Line)
ALERTS at;
Resistance Zone Breakout and Touch
Resistance Line Breakout and Touch
Support Zone Breakout and Touch
Support Line Breakout and Touch
AND AT PULLBACKS
COMBO BREAKOUTS
**TURKCE**
Bu indikatör grafiklerinizde;
1) Destek Seviyelerini (Yeşil Kesintisiz Çizgi)
2) Direnç Seviyelerini (Kırmızı Kesintisiz Çizgi)
3) Destek Çizgisini (Yeşil Kesikli Çizgi)
4) Direnç Çizgisini (Kırmızı Kesik Çizgi) çizer
Alarm Özellikleri;
Destek Bölgesi Kırılımı ve Teması
Destek Çizgisi Kırılımı ve Teması
Direnç Bölgesi Kırılımı ve Teması
Direnç Çizgisi Kırılımı ve Teması
VE PULLBACK lerde (GeriOnaylarda)
COMBO KIRILIMLARDA
Some Examples / Bazı Örnekler
s3.tradingview.com
s3.tradingview.com
s3.tradingview.com
s3.tradingview.com

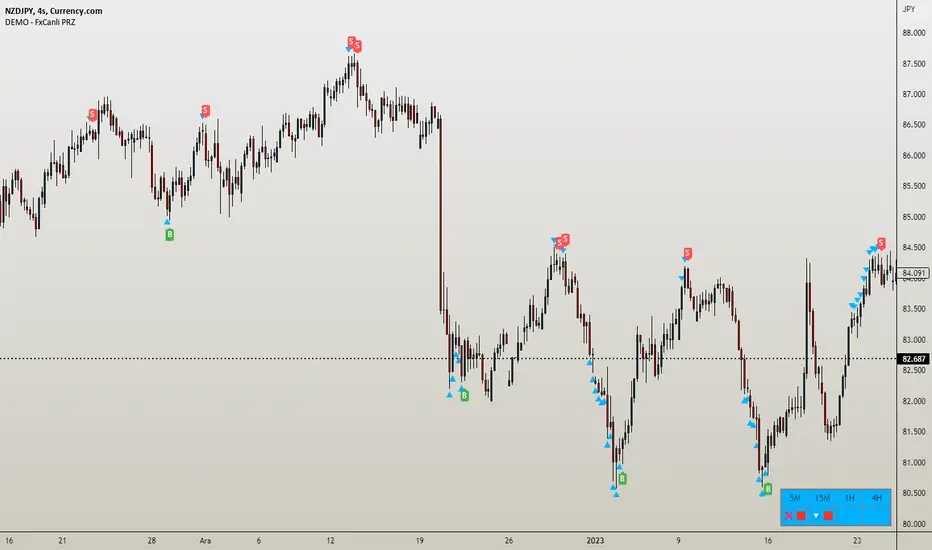
DEMO - FxCanli PRZEN - FxCanli PRZ indicator shows Price Reversel Zones on your charts.
DEMO VERSION of FXCANLI PRZ Indicator work with any NZD or any DOGE symbols
TR - FxCanli PRZ indikatörü grafiklerinizde olası dönüş bölgelerini gösterir.
FXCANLI PRZ indikatörünün DEMO VERSİYONUNU herhangi bir NZD veya DOGE sembolü ile kullanabilirsiniz.
EN - For Example | TR - Örnek
NZD|...
NZD|USD
NZD|CAD
NZD|CHF
NZD|JPY
DOGE|...
DOGE|USD
DOGE|USDT
DOGE|USDTPERP
DOGE|BTC
FEATURES & EXAMPLES / ÖZELLİKLER & ÖRNEKLER
**************************************************************
Multi Language / Çok Dil
EN - You can get alerts in English or Turkish language
TR - Alarmları İngilizce veya Türkçe olarak alabilirsiniz.
Bullish - Bearish PRZ / Boğa - Ayı yönlü PRZ
EN - You can choose Bullish and Bearish PRZ or either
TR - Boğa ve Ayı yönlü veya herhangi birini seçebilirsiniz
Buy - Sell Labels / Al -Sat Etiketleri
EN - You can see (S)ell label and (B)uy label at the end of Price Reversal Zones
TR - Olası Dönüş Bölgelerinin sonunda (S)ell-Sat etiketini ve (B)uy-Al etiketini görebilirsiniz.
Panel Properties / Panel Özellikleri
EN - In the panel settings, you can follow up with different characters and emojis when you enter the PRZ, at the PRZ and exit from PRZ.
TR - Panel ayarlarında, olası dönüş bölgesine girdiğinde, olası dönüş bölgesinde ve olası dönüş bölgesinden çıktığını faklı karakter ve emojiler ile takip edebilirsiniz
Multi Timeframe / Çoklu Zaman dilimi
EN - You can easly follow all timeframes at one chart
TR - Tüm zaman dilimlerini tek bir grafikte takip edebilirsiniz
EN - Panel Width - to get better view at mobile phones and tablets
TR - Cep telefonları ve tabletlerde daha güzel görünüm için Panel Genişliği
Alerts / Alarmlar
EN - You can set only one alert for all timeframe and all prz alerts
TR - Bir alarm kurarak, tüm zaman dilimlerinde PRZ alarmlarını alabilirsiniz
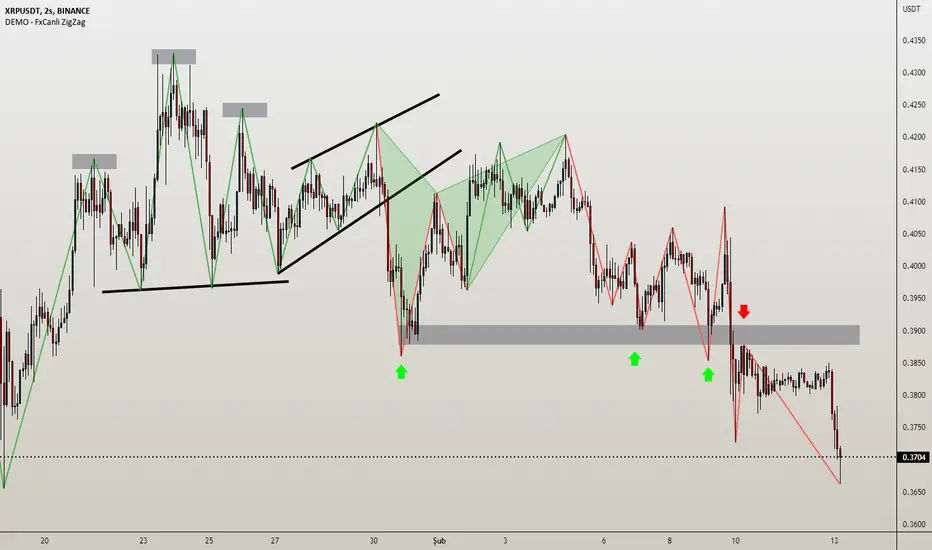
DEMO - FxCanli ZigZagEN - You can spot current trend and lots of patterns with FxCanli ZigZag indicator EASLY
DEMO VERSION of FXCANLI ZIGZAG Indicator works on only GBPNZD and XRPUSDT charts
TR - FxCanli ZigZag indikatörü mevcut trendi ve birçok formasyonu KOLAYCA bulmanızda size yardımcı olacaktır.
FXCANLI ZIGZAG indikatörünün DEMO VERSİYONU sadece GBPNZD ve XRPUSDT grafiklerinde çalışır
EN - Market Structure (At the Current time frame you can choose different colors for UpTrend and DownTrend)
TR - Market Yapısı (Mevcut zaman diliminde, Yukarı Trend ve Aşağı trendin rengini seçebilirsiniz.)
Harmonic Patterns / Harmonik Formasyonları
Elliott Wave / Elliott Dalgaları
AB=CD Pattern / AB=CD Formasyonu
EN - By activating the lower timeframe from the settings, you can see the lower timeframe waves.
TR - Ayarlardan alt zaman dilimini aktif ederek, alt zaman dilimi dalgalarını görebilirsiniz.
EN - By activating the higher timeframe from the settings, you can see the higher timeframe waves.
TR - Ayarlardan üst zaman dilimini aktif ederek, üst zaman dilimi dalgalarını görebilirsiniz.
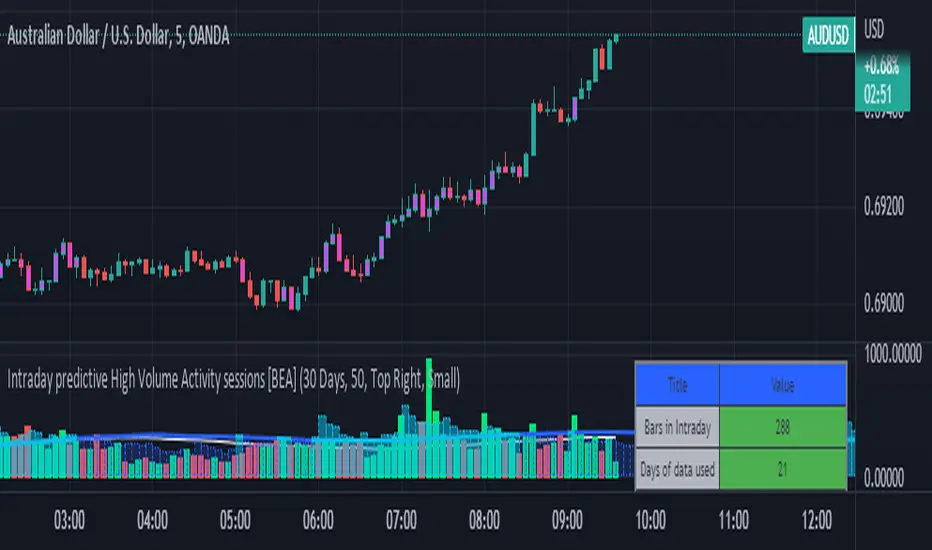
Intraday predictive High Volume Activity sessions [BEA]Idea:
This indicator is designed to know the high traded volume sessions in advance before the day starts.
The predictive volume bars will be plotted in advance once a new trading session starts.
Logic Used:
The basic idea is to store each bar volume / Volume MA data for the selected time. So, the first bar of each data is stored for all selected historical days.
Once the data is stored, I am taking average of each bar data for the selected Historical days.
How to Use:
This gives me an idea of the volume behavior throughout the days based on historical data. So I decide my time of trading for that specific times sessions where the traded volume activity is high.
The bars which are more than the Moving average ( Highlighted Volume bars plotted in future ) is the time session to focus.
Designed only for intraday timeframes.
Here in the image, you can see the session in advance for high traded volume activity.
Try it test it , let me know if it can be improved further.
Have a happy trading.
DISCLAIMER
Any and all liability for risks resulting from investment transactions or other asset dispositions carried out by the user based on information received or a market analysis is expressly excluded by me.
All the information made available here is generally provided to serve as an example only, without obligation and without specific recommendations for action. It does not constitute and cannot replace investment advice. We therefore recommend that you contact your personal financial advisor before carrying out specific transactions and investments.
Do your own research, this is not a financial advice.
Short Selling EMA Cross (By Coinrule)BINANCE:AVAXUSDT
This short selling script works best in periods of downtrends and general bearish market conditions, with the ultimate goal to sell as the the price decreases further and buy back before a rebound.
This script can work well on coins you are planning to hodl for long-term and works especially well whilst using an automated bot that can execute your trades for you. It allows you to hedge your investment by allocating a % of your coins to trade with, whilst not risking your entire holding. This mitigates unrealised losses from hodling as it provides additional cash from the profits made. You can then choose to to hodl this cash, or use it to reinvest when the market reaches attractive buying levels.
Entry
The exponential moving average ( EMA ) 20 and EMA 50 have been used for the variables determining the entry to the short. EMAs can operate better than simple moving averages due to the additional weighting placed on the most recent data points, whereas simple moving averages weight all the data the same. This means that price is tracked more closely and the most recent volatile moves can be captured and exploited more efficiently using EMAs.
Our backtesting data revealed that the most profitable timeframe was the 30-minute timeframe, this also enabled a good frequency of trades and high profitability.
A fast (shorter term) exponential moving average , in this strategy the EMA 20, crossing under a slow (longer term) moving average, in this example the EMA 50, signals the price of an asset has started to trend to the downside, as the most recent data signals price is declining compared to earlier data. The entry acts on this principle and executes when the EMA 20 crosses under the EMA 50.
Enter Short: EMA 20 crosses under EMA 50.
Exit
This script utilises a take profit and stop loss for the exit. The take profit is set at -8% and the stop loss is set at +16% from the entry price. This would normally be a poor trade due to the risk:reward equalling 0.5. However, when looking at the backtesting data, the high profitability of the strategy (93.33%) leads to increased confidence and showcases the high probability of success according to historical data.
The take profit (-8%) and the stop loss (+16%) of the strategy are widely placed to ensure the move is captured without being stopped out due to relief rallies. The stop loss also plays a role of mitigating losses and minimising risk of being stuck in a short position once there has been a fundamental trend reversal and the market has become bullish .
Exit Short: -8% price decrease from entry price.
OR
Exit Short: +16% price increase from entry price.
Tip: Research what coins have consistent and large token unlocks / highly inflationary tokenomics, and target these during bear markets to short as they will most likely have substantial selling pressure that outweighs demand - leading to declining prices.
The strategy assumes each order is using 30% of the available coins to make the results more realistic and to simulate you only ran this strategy on 30% of your holdings. A trading fee of 0.1% is also taken into account and is aligned to the base fee applied on Binance.
The backtesting data was recorded from December 1st 2021, just as the market was beginning its downtrend. We therefore recommend analysing the market conditions prior to utilising this strategy as it operates best on weak coins during downtrends and bearish conditions.

mark strategy2 divergence bot v0.5 for xbtusdHi first of all thanks for read this.
This is my second strategy for make trading, I optimized it for xbtusd with 30 min charts.
You can personalize some setting for reach a better result then me, these are the setting:
this script is only for long trade, so bearish divergence don't work
1)ema1
U can change this value for use another ema and use a faster or slower trend
2)ema2
U can change this value for use another ema and use a faster or slower trend
3)pivot right
U can change this value for watch a number of bar on your right
4)pivot left
U can change this value for watch a number of bar on your left
5)high range
U can change this value for watch a max number of bar
6)low range
U can change this value for watch a min number of bar
7)bullish
U can change this value for enable signal with bullish divergence
8)hidden bullish
U can change this value for enable signal with hidden bullish divergence
9)bearish
U can change this value for enable signal with bearish divergence
10)hidden bearish
U can change this value for enable signal with hidden bearish divergence
11)profit 1 %
U can change this value for the first take profit target
12)profit 2 %
U can change this value for the second take profit target
13)qty target 1 %
U can change this value for close a % of your trade at target 1
14)loss %
U can change this value for close the trade at a % of loss
Have nice day and send me a message if u will earn with my strategy.
If u want my code send me a message
for info send me a message

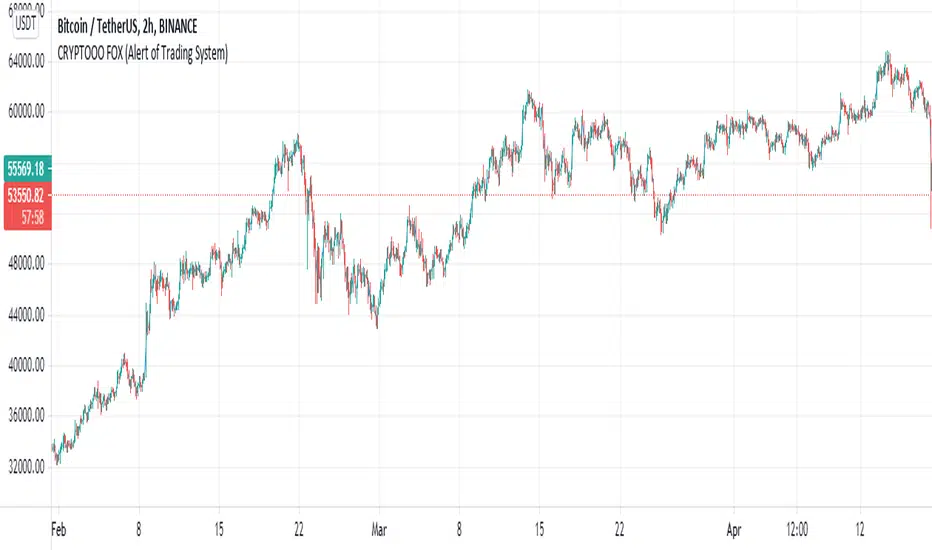
CRYPTOOO FOX (Alert of Trading System)CRYPTOOO FOX (Alert of Trading System) .
---DISCRIPTION---
How Indicator Work :
--Indicator is working on higher time frame so i use two high time frame
the higher is ( 2 H or 3 H or 4 H or 8 H or 12 H or Daily ) and the highest is ( Daily ) Time frame .
-- When the higher time frame cross over the Daily time frame( the Highest ) this mean the TREND and
the PRICE also going UP this strategy is going to long position ( Buy position ) .
-- When the higher time frame cross under Daily time frame( the Highest ) this mean the TREND and
the PRICE also going DOWN strategy going to ( close position ) .
-- Notes :
--Indicator use some averages to calculate the higher time frame .
--Indicator use parabolic indicator to filter entries which name is ( Filter )
--Indicator use one more candle close to confirm entry ( Filter 2 )
--This the best time frame ( HIGHER , HIGHEST ) in this strategy in profit and draw down .
--Indicator is working only in Long position i am not recommend to use it in short positions .
--THIS IS NO REPAINT Indicator .
--DON'T use it in DAILY time frame
--I recommend so mush to use take profit and stop loss although the low draw down but some time
the market have a huge movements .
CRYPTOOO FOX (Trading System)CRYPTOOO FOX (Trading System)
---DISCRIPTION---
How Strategy Work :
--Strategy is working on higher time frame so i use two high time frame
the higher is ( 2 H or 3 H or 4 H or 8 H or 12 H or Daily ) and the highest is ( Daily ) Time frame .
-- When the higher time frame cross over the Daily time frame( the Highest ) this mean the TREND and
the PRICE also going UP this strategy is going to long position ( Buy position ) .
-- When the higher time frame cross under Daily time frame( the Highest ) this mean the TREND and
the PRICE also going DOWN strategy going to ( close position ) .
-- Notes :
--Strategy use some averages to calculate the higher time frame .
--Strategy use parabolic indicator to filter entries which name is ( Filter )
--Strategy use one more candle close to confirm entry ( Filter 2 )
--This the best time frame ( HIGHER , HIGHEST ) in this strategy in profit and draw down .
--Strategy is working only in Long position i am not recommend to use it in short positions .
--THIS IS NO REPAINT STRATEGY .
--DON'T use it in DAILY time frame
--I recommend so mush to use take profit and stop loss although the low draw down but some time
the market have a huge movements .
---- Strategy Settings which we publish now :
Fees = 0.1 the same as market fees .
Equity = 10 % and you can change it as you want .
Filter = 4 .
Filter 2 = true ( Just mark in check box beside Filter 2 ) .
Charts which working in these settings :
Eth/Usdt- 30 min/Binance ( Current image ) .
Btc/Usdt- 30 min/Binance .
Bch/Usdt- 30 min/Binance .
We do a lot of tests to get the best profit and also the lowest draw down
we will update the new settings for new charts

Pin Bar IndicatorThe Pin Bar indicator is a pattern recognition indicator for Forex, Stocks, Indices, Futures, Commodities and Cryptos.
The strategy that comes with the Pin Bar pattern is based on price action.
Inputs of the indicator are:
MaxBars: maximum number of bars back to calculate searching for signals
BuySignals (true/false): you can filter signals and decide to show BUY signals or not. Default settings is true (no filter).
SellSignals (true/false): you can filter signals and decide to show SELL signals or not. Default settings is true (no filter).
Alerts:
The alerts are managed by TradingView trading platform features and not by the indicator itself. You must use Pin Bar Sell less than zero and Pin Bar Buy greater than zero as settings for the alerts.
Example of BUY alerts settings : BUY example (see documentation in our website)
Example of SELL alerts settings : SELL example (see documentation in our website)
Beware that TradingView (at the time of this publication) limits the number of alerts you can receive according to the plan you subscribed with the platform. If receiving alerts is important for you then you should investigate carefully this aspect before purchasing the indicator.
Trading rules:
For BUY: wait for a bullish Pin Bar to print on a support zone after a down trend. Wait for the price to break high of the Pin Bar (5 pips above the high for H1 and higher timeframes, 1 pip for M5). Immediately enter in the trade once high is broken. You also can use a BUY STOP order placed 5 pips above the high of the candle (plus spread). Stop Loss should be placed below the low of the Pin Bar. If order is not triggered in the next candle, then a trade is invalidated and should be canceled.
For SELL: wait for a bearish Pin Bar to print on resistance zone after an up trend. Wait for the price to break the low of the Pin Bar (5 pips below the low for H1 and higher timeframes, 1 pip for M5). Immediately enter in the trade once low is broken. You also can use a SELL STOP order placed 5 pips below the low of the candle. Stop Loss should be placed above the high of the Pin Bar. If order is not triggered in the next candle then trade is invalidated and should be canceled.
The Pin Bar indicator can be used with any timeframe.
The Pin Bar indicator can be used with any class of asset: Forex, Stocks, Indices, Futures, Commodities and Cryptos.
For more information please visit our website (see signature below). We cannot provide you direct link nor update this indicator description due to TradingView house rules. We encourage you to visit our website for up to date information.
You can also contact me in private using TradingView messaging.

Big Shadow IndicatorNaked Forex Big Shadow Indicator for TradingView
Big Shadow Indicator is a pattern recognition indicator for Forex, Stocks, Indices, Futures, Commodities, and Cryptos.
When you have a Big Shadow on your chart then this is a strong signal meaning that you might be ahead of a reversal. You can take other elements (momentum, trend, volatility, price action, fundamentals) to build a complete strategy and confirm your entries. Beware that you might not make money just following the arrows generated by the pattern recognition.
The Big Shadow pattern is a simple and effective pattern to trade.
The strategy that comes with the Big Shadow is based on price action.
Inputs:
MaxBars: number of bars back used to calculate the indicator
BuySignals (true/false): you can filter signals and decide to show BUY signals or not. Default settings is true (no filter).
SellSignals (true/false): you can filter signals and decide to show SELL signals or not. Default settings is true (no filter).
Alerts:
The alerts are managed by TradingView trading platform features and not by the indicator itself. You must use Big Shadow Sell less than zero and Big Shadow Buy greater than zero as settings for the alerts.
Trading rules:
For BUY: wait for a bullish Big Shadow to print on a support zone after a down trend. Wait for price to break high of the Big Shadow candle (5 pips above the high for H1 and higher time frames). Immediately enter in the trade once high is broken. You also can use a BUY STOP order placed 5 pips above the high of the candle (plus spread). Stop Loss should be placed below the low of the Big Shadow candle. If order is not triggered in the next candle then trade is invalidated and should be canceled.
For SELL: wait for a bearish Big Shadow to print on resistance zone after an up trend. Wait for price to break the low of the Big Shadow candle (5 pips below the low for H1 and higher time frames). Immediately enter in the trade once low is broken. You also can use a SELL STOP order place 5 pips below the low of the candle. Stop Loss should be placed above the high of the Big Shadow candle. If order is not triggered in the next candle then trade is invalidated and should be canceled.
The Big Shadow indicator can be used with any time frame.
The Big Shadow indicator can be used with any class of asset: Forex, Stocks, Indices, Futures, Commodities and Cryptos.
Other indicators: you might also be interested in the Kangaroo Tail Indicator (very good pattern which is part of the Naked Forex)
For updates of this description please visit our website (see signature below). Beware that due to TradingView house rules we are not allowed to update the present description nor to mention our website. At the time you are reading this description it might be outdated information.
For any question or request please feel free to contact me in private. I usually answer all requests at reception.

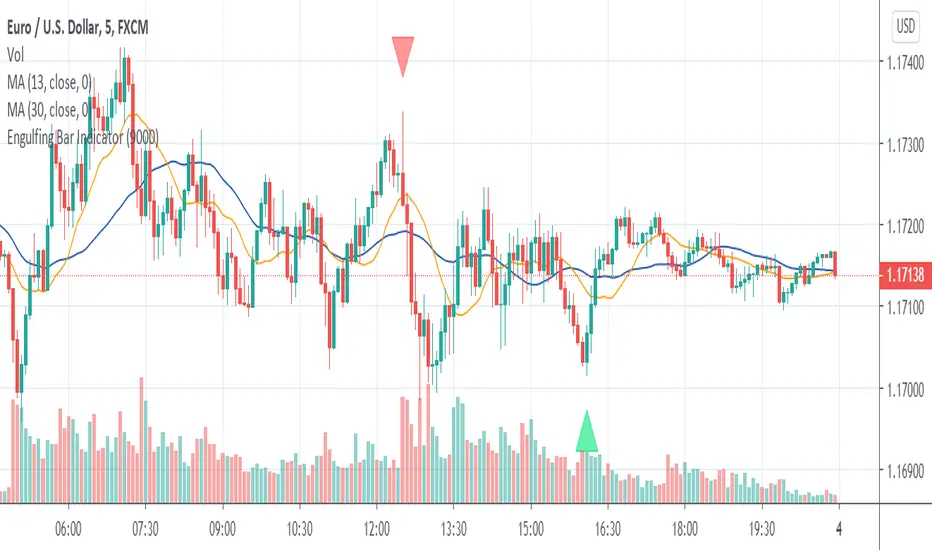
Engulfing Bar IndicatorEngulfing Bar indicator is a pattern recognition indicator for Forex, Stocks, Indices, Futures, Commodities and Cryptos.
The Engulfing Bar indicator is an enhanced pattern of the popular Engulfing Bar to keep only the best patterns produced in the market.
The strategy that comes with the Engulfing Bar is based on price action.
Inputs of the indicator are:
MaxBars: number of bars back used to calculate the indicator
BuySignals (true/false): you can filter signals and decide to show BUY signals or not. Default settings is true (no filter).
SellSignals (true/false): you can filter signals and decide to show SELL signals or not. Default settings is true (no filter).
Alerts:
The alerts are managed by TradingView trading platform features and not by the indicator itself. You must use Engulfing Sell less than zero and Engulfing Buy greater than zero as settings for the alerts.
Trading rules:
For BUY: wait for a bullish Engulfing Bar to print on a support zone after a down trend. Wait for the price to break high of the Engulfing Bar (5 pips above the high for H1 and higher timeframes, 1 pip for M5). Immediately enter in the trade once high is broken. You also can use a BUY STOP order placed 5 pips above the high of the candle (plus spread). Stop Loss should be placed below the low of the Engulfing Bar. If order is not triggered in the next candle, then trade is invalidated and should be canceled.
For SELL: wait for a bearish Engulfing Bar to print on resistance zone after an up trend. Wait for price to break the low of the Engulfing (5 pips below the low for H1 and higher timeframes, 1 pip for M5). Immediately enter in the trade once low is broken. You also can use a SELL STOP order to place 5 pips below the low of the candle. Stop Loss should be placed above the high of the Engulfing Bar. If order is not triggered in the next candle then trade is invalidated and should be canceled.
The Engulfing Bar indicator can be used with any timeframe.
The Engulfing Bar indicator can be used with any class of asset: Forex, Stocks, Indices, Futures, Commodities and Cryptos.
For updates of the present description please visit our website (see signature below). We are not allowed by house rules of TradingView to update the present description nor to mention our web page directly in the description.
For any question or assistance please feel free to send a message to my TradingView inbox or contact us over our website if you prefer. I will answer as soon as I receive your request.
Kangaroo Tail IndicatorKangaroo Tail Indicator is a pattern recognition indicator for Forex, Stocks, Indices, Futures, Commodities and Cryptos.
The Kangaroo Tail is a multi-bar pattern.
The Kangaroo Tail is both simple and very effective pattern to trade.
The strategy that comes with the Kangaroo Tail is based on price action.
The indicator does what he was designed for: displaying Kangaroo Tail patterns. Don't expect to follow the up and down arrows and make money. Trading is not that simple. The Kangaroo Tail pattern is a starting point. The arrow is not a confirmed BUY and SELL signal in itself. The Kangaroo Tail indicator alerts you that the market might be at a turning point now. Then you must use other elements of your strategy (trend, momentum, support/resistance, volatility, daily bias, and other indicators) to confirm the signal and place a trade.
Inputs of the indicator are:
MaxBars: number of bars back used to calculate the indicator
BuySignals (true/false): you can filter signals and decide to show BUY signals or not. Default settings is true (no filter).
SellSignals (true/false): you can filter signals and decide to show SELL signals or not. Default settings is true (no filter).
CandleSize: filter signals depending on the size of candle (0.5 to 1.5 recommended range of values)
Alerts:
The alerts are managed by TradingView trading platform features and not by the indicator itself. You must use Kangaroo Sell less than zero and Kangaroo Buy greater than zero as settings for the alerts.
Trading rules:
For BUY: wait for a bullish Kangaroo Tail to print on a support zone after a down trend. Wait for price to break high of the Kangaroo Tail candle (5 pips above the high for H1 and higher time frames). Immediately enter in the trade once high is broken. You also can use a BUY STOP order placed 5 pips above the high of the candle (plus spread). Stop Loss should be placed below the low of the Kangaroo Tail candle. If order is not triggered in the next candle then trade is invalidated and should be canceled.
For SELL: wait for a bearish Kangaroo Tail to print on resistance zone after an up trend. Wait for price to break the low of the Kangaroo Tail candle (5 pips below the low for H1 and higher time frames). Immediately enter in the trade once low is broken. You also can use a SELL STOP order place 5 pips below the low of the candle. Stop Loss should be placed above the high of the Kangaroo Tail candle. If order is not triggered in the next candle then trade is invalidated and should be canceled.
The Kangaroo Tail indicator can be used with any time frame.
The Kangaroo Tail indicator can be used with any class of asset: Forex, Stocks, Indices, Futures, Commodities and Cryptos.
Please contact me in private if you want to get access to the paid version of the indicator or use links of my signature to access our online store.

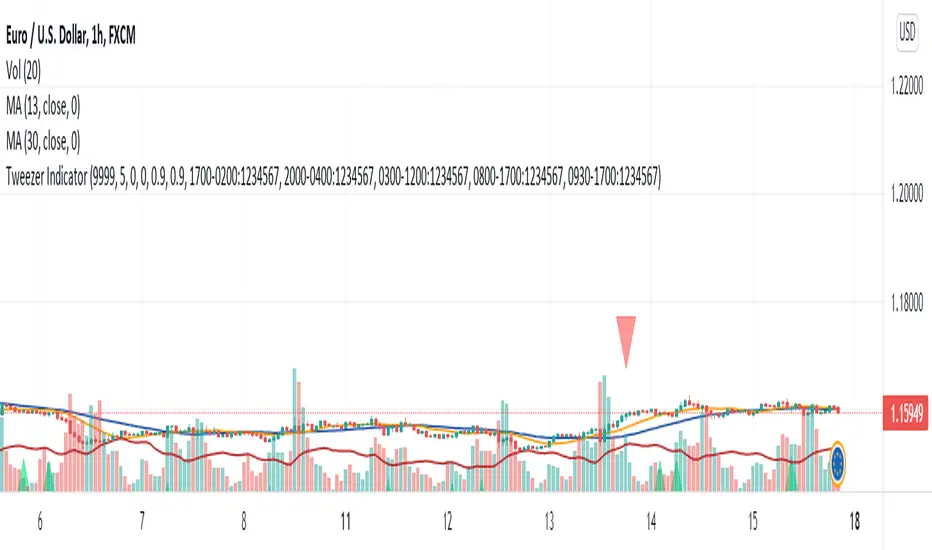
Tweezer Pro IndicatorTweezer Pro Indicator is a pattern recognition indicator for Forex, Stocks, Indices, Futures, Commodities and Cryptos.
The standard Tweezer is a two bar pattern. Our enhanced version is a multi-bar pattern. We filter the patterns for you so that you only get the best and most effective patterns and ignore the noise.
The Tweezer pattern is a simple and effective pattern to trade.
The strategy that comes with the Tweezer is based on price action.
The indicator was developed with the expertise of Justin Mueller. The indicator uses same rules as Justin who is an expert trader using the Tweezer pattern for a while now. You can visit Justin Youtube channel, like and subscribe.
The indicator does what he was designed for: displaying Tweezer patterns. Don't expect to follow the up and down arrows and make money. Trading is not that simple. The Tweezer pattern is a starting point. The arrow is not a confirmed BUY and SELL signal in itself. The Tweezer indicator alerts you that the market might be at a turning point now. Then you must use other elements of your strategy (trend, momentum, support/resistance, volatility, daily bias, and other indicators) to confirm the signal and place a trade.
The Tweezer Pro version let users define their own pattern definition. This version is meant for expert traders who want to use their own optimized settings.
Inputs of the indicator are:
MaxBars: maximum number of bars back to calculate searching for signals
Settings (automatic/manual): you can either use the defaults settings optimized by Justin Mueller (automatic) or use your own settings (manual).
TrendPeriod (20 as default): number of candles the indicator should look back to determine current trend direction.
CandleSize (0.5 as default): minimum size for candles to consider pattern as valid (0.0:no filter, 0.5:middle size candle, 1.0:big candle only).
SameTailsSize (0.9 as default): check accuracy of same candle wicks size to validate pattern (0.0:ignore wick size criterion, 0.8:strict same size, 0.9:very strict same size).
SameOpenClose (0.9 as default): check accuracy of same open and close for the candles (0.0:ignore criterion, 0.8:strict same open/close, 0.9:very strict same open/close).
UseEngulfingFilter (true/false): if set to true then ignore patterns that do not include engulfing pattern.
UseEngulfingEvenAfter (true/false): if set to true then will also consider engulfing pattern with the next candle after the Tweezer formation.
Trading rules:
For BUY: wait for a bullish Tweezer (Tweezer bottom) to print on a support zone after a down trend. Wait for price to break high of the Tweezer pattern (5 pips above the high for H1 and higher time frames). Immediately enter in the trade once high is broken. You also can use a BUY STOP order placed 5 pips above the high of the candle (plus spread). Stop Loss should be placed below the low of the Tweezer pattern. If order is not triggered in the next candle then trade is invalidated and should be canceled.
For SELL: wait for a bearish Tweezer (Tweezer top) to print on resistance zone after an up trend. Wait for price to break the low of the Tweezer pattern (5 pips below the low for H1 and higher time frames). Immediately enter in the trade once low is broken. You also can use a SELL STOP order place 5 pips below the low of the candle. Stop Loss should be placed above the high of the Tweezer pattern. If order is not triggered in the next candle then trade is invalidated and should be canceled.
The Tweezer indicator can be used with any time frame.
The Tweezer indicator can be used with any class of asset: Forex, Stocks, Indices, Futures, Commodities and Cryptos.
BigBendFX Ichimoku Cloud | Cloud BreakoutCloud breakout is an enhancement of TradingView's built-in Ichimoku Cloud Indicator. By default, only the cloud is visible. The other Ichimoku lines can be toggled on if needed. This indicator focuses on the breakout of the Kumo cloud. An additional simple moving average filter can be added as well.
Breakout Condition
2 candlesticks are part of the breakout condition
Candlestick 1: 'open' price is still within the cloud and 'close' price breaks out of the cloud
Candlestick 2: 'open' price confirms that candlestick 1 'close' remains as a breakout
There are 4 possible breakout conditions: 2 bullish direction moves crossing each senkou span and 2 bearish direction moves crossing each senkou span
Note: ranging markets will cause false breakouts, so a moving average is integrated to help filter this out
Moving Average Integration
A simple moving average can easily be toggled on/off to filter out cloud breakout signals
The SMA length and color can be adjusted in the settings
Alerts
There are 2 alert options: bullish or bearish
Alerts will confirm if the Moving Average Integration is activated
To add to your chart simply search for the title "BigBendFX Ichimoku Cloud" in indicators & strategies.
If you would like any added features or functionalities, please comment/share below. Be sure to check out our website (link below)!
Thank you!

Best Volatility CalculatorHello traders,
This indicator shows the average volatility, of last N Periods, for the selected time frames.
You can select up to 2 timeframes with this version
Volatility is defined as the close of current candle - close of the previous N candle
Presented as Currency, Pip, percentage labels in a panel below.
Will calculate in real-time only for the current instrument on the chart.
The indicator is coded to not be repainting
Example
In the indicator screenshot, I used a lookback period of 1.
That compares the current candle close versus the previous one for the daily and weekly timeframe
Showing how the results are calculated for the weekly calculations
Enjoy :)
Best regards
Dave

Profit HarbingerProfit Harbinger is privately owned paid indicator on trading view, It is what I consider to be the current precipices of my trading journey. After years of trading stocks and crypto working tirelessly to perfect my strategy it was only after really sitting down with my mentor and teacher that we developed the alpha version of this strategy. After working for what seemed like forever on the math, and code. I developed this indicator to work in my stead. This indicator is the development of the aforementioned strategy converted into a machine to take all the emotions out of trading the various trade-able assets.

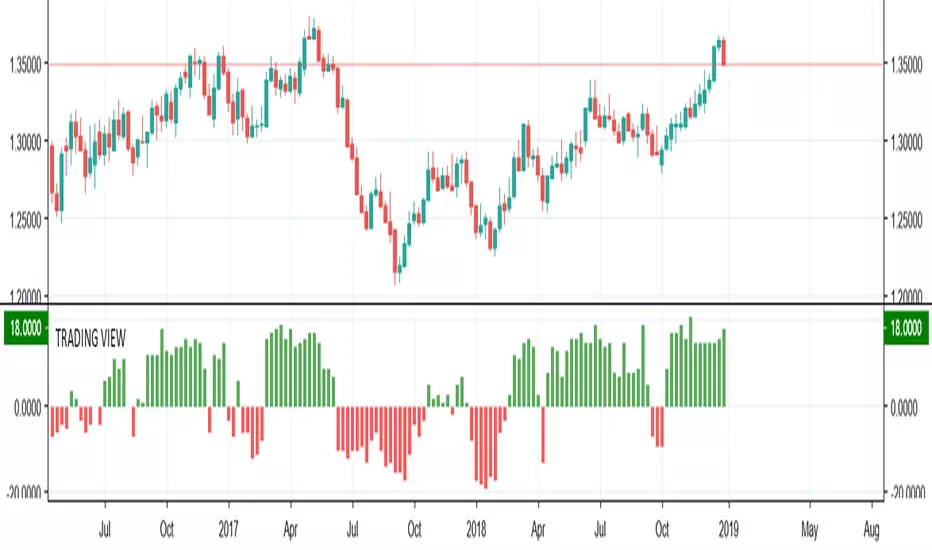
TRADING VIEW INDICATOR - PINE TUTORIAL 5After a long gap, I have written the 5th tutorial for the pine script. You can find the others below, if you read through all of these you should be good to do your own writing.
This script mimics the Trading View Indicator . For example this one below.
www.tradingview.com
It shows the net result of the 28 indicator, either as buy or sell. I have worked hard to make sure it matches the trading view results but I am not in hundred percent agreement with tradingView on SMA, EMA and Ichimoku indicator.
There are many commented plots because I needed to check separately if each indicator is working correctly.
Someone else wrote this code but they did not make it public. It took me about 3 weeks to write this and to be honest it could be cleaner and better commented.
If you find any mistake please let me know. I hope it will be useful in your learning.
BullTrading ZigZagSome people say the ZigZag indicator is the Holy Grail... I think half of this statement is true :)
This is an alert friendly ZigZag indicator with MultiTimeframe Capabilities, it will alert you each time the ZigZag plots a new line (Higher Timeframe ZigZags are plotted with respective timeframe offset).
Note: The indicator works on higher timeframes (D and above)
Default Resolution is D, adjust resolution to your favorite timeframe and Min %
Use in conjunction with your Fib tool and enjoy.

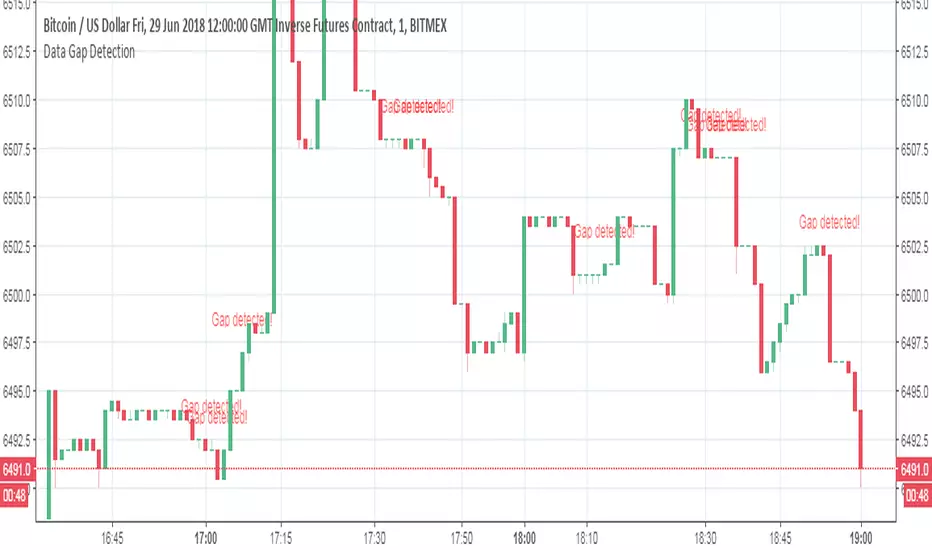
Data Gap DetectionThis simple script checks for data gaps in an intra-day TradingView chart. I have found that BitMEX 1-minute data is coming in rather holey lately, so I wrote this just to see how prevalent the problem is. It should work on any intra-day timeframe, not just 1-minute.
V1: initial release.