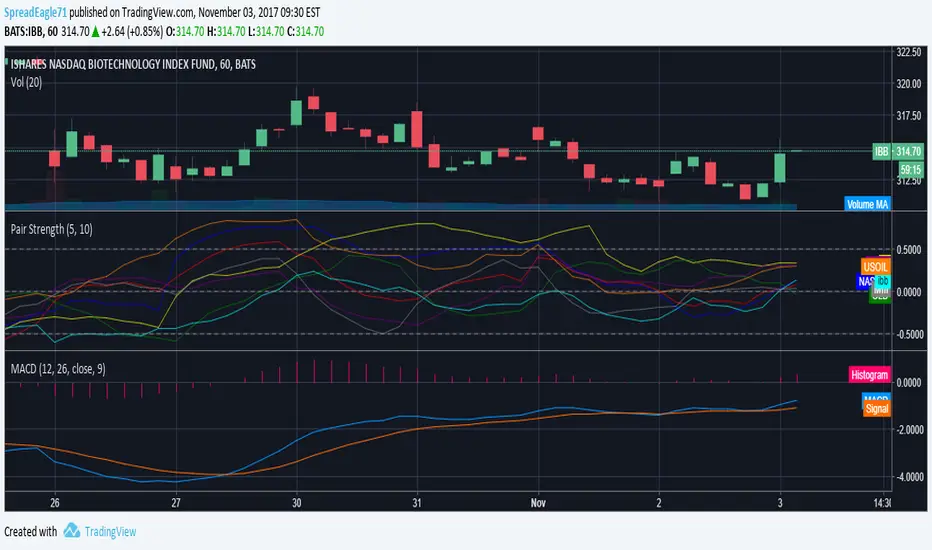
Pair Strength: Updated Version of the one by GlazI updated this version used for Forex with Stock&Index related instruments. Enjoy. Chỉ báo Pine Script®của SpreadEagle71103
SMI Ergodic Oscillator Backtest The SMI Ergodic Indicator is the same as the True Strength Index (TSI) developed by William Blau, except the SMI includes a signal line. The SMI uses double moving averages of price minus previous price over 2 time frames. The signal line, which is an EMA of the SMI, is plotted to help trigger trading signals. Adjustable guides are also given to fine tune these signals. The user may change the input (close), method (EMA), period lengths and guide values. You can use in the xPrice any series: Open, High, Low, Close, HL2, HLC3, OHLC4 and ect... You can change long to short in the Input Settings WARNING: - For purpose educate only - This script to change bars colors.Chiến lược Pine Script®của HPotter89
SMI Ergodic Oscillator Strategy The SMI Ergodic Indicator is the same as the True Strength Index (TSI) developed by William Blau, except the SMI includes a signal line. The SMI uses double moving averages of price minus previous price over 2 time frames. The signal line, which is an EMA of the SMI, is plotted to help trigger trading signals. Adjustable guides are also given to fine tune these signals. The user may change the input (close), method (EMA), period lengths and guide values. You can use in the xPrice any series: Open, High, Low, Close, HL2, HLC3, OHLC4 and ect... WARNING: - This script to change bars colors.Chỉ báo Pine Script®của HPotter132
True Strength Indicator - RMAThis is the base TSI indicator with the RMA instead of the the EMA.Chỉ báo Pine Script®của itsjustanalysis11306
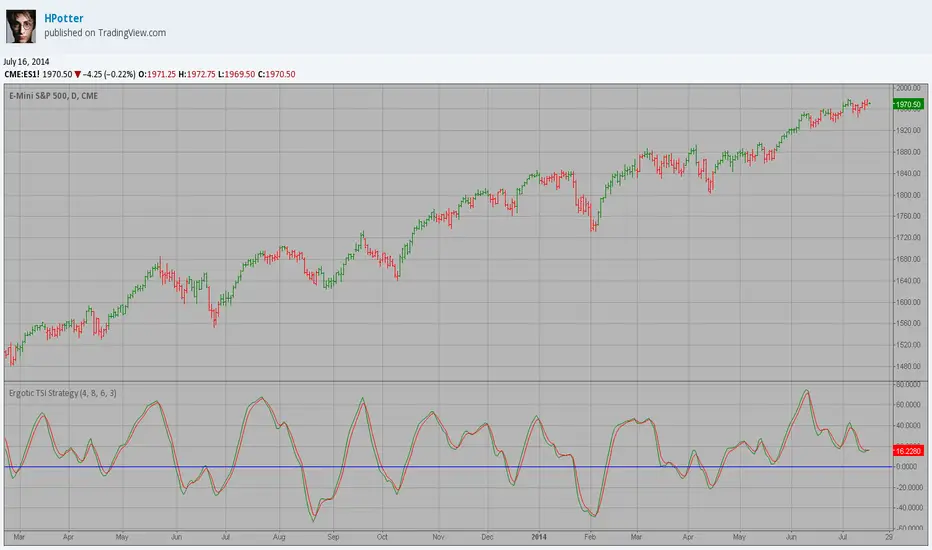
Ergotic TSI Strategy Backtest r - Length of first EMA smoothing of 1 day momentum 4 s - Length of second EMA smoothing of 1 day smoothing 8 u- Length of third EMA smoothing of 1 day momentum 6 Length of EMA signal line 3 Source of Ergotic TSI Close This is one of the techniques described by William Blau in his book "Momentum, Direction and Divergence" (1995). If you like to learn more, we advise you to read this book. His book focuses on three key aspects of trading: momentum, direction and divergence. Blau, who was an electrical engineer before becoming a trader, thoroughly examines the relationship between price and momentum in step-by-step examples. From this grounding, he then looks at the deficiencies in other oscillators and introduces some innovative techniques, including a fresh twist on Stochastics. On directional issues, he analyzes the intricacies of ADX and offers a unique approach to help define trending and non-trending periods. You can use in the xPrice any series: Open, High, Low, Close, HL2, HLC3, OHLC4 and ect... You can change long to short in the Input Settings Please, use it only for learning or paper trading. Do not for real trading.Chiến lược Pine Script®của HPotter11151
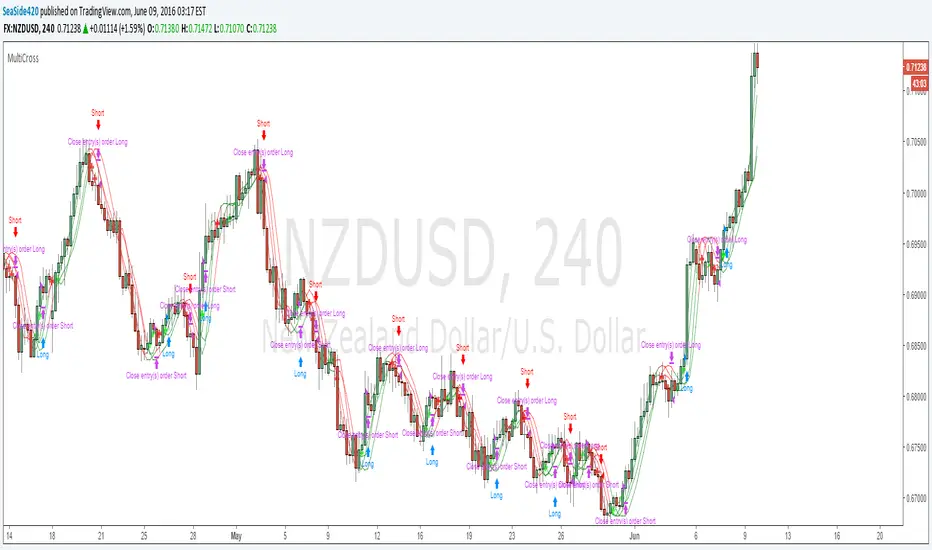
MultiCross v4.20Quad-HullMA-cross & VWMA & MacD & TSI combination Version 4.20 added script for strategy settings to be already correct when strategy loads onto chart: calc_on_order_fills= true, calc_on_every_tick=true, default_qty_type=strategy.percent_of_equity, default_qty_value=100, pyramiding=0Chiến lược Pine Script®của SeaSide4201515804
MultiCrossQuad-HullMA-cross & VWMA & MacD & TSI combination Made for 4H - other timeframes unkown result.Chiến lược Pine Script®của SeaSide420346
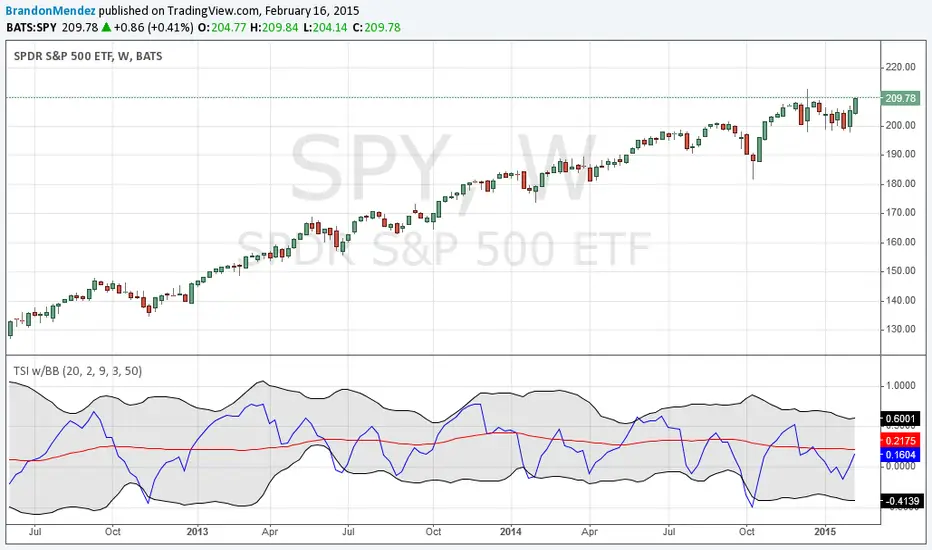
TSI w/BBA simple modification of the normal TSI indicator. It adds Bollinger Bands that are based on the TSI values, instead of the price history. I find this indicator useful on the weekly interval.Chỉ báo Pine Script®của BrandonMendez11304
True Strength Indicator MTFHere is an example of a script showing a multi-time frame of TSI. Chart below compares FX EURUSD Daily TSI to 1H TSI Here is an updated version study("True Strength Indicator MTF", shorttitle="TSI MTF") resCustom = input(title="Timeframe", type=resolution, defval="60" ) long = input(title="Long Length", type=integer, defval=25) short = input(title="Short Length", type=integer, defval=13) signal = input(title="Signal Length", type=integer, defval=13) price = close double_smooth(src, long, short) => fist_smooth = ema(src, long) ema(fist_smooth, short) pc = change(price) double_smoothed_pc = double_smooth(pc, long, short) double_smoothed_abs_pc = double_smooth(abs(pc), long, short) tsi_value = 100 * (double_smoothed_pc / double_smoothed_abs_pc) tsi = security(tickerid, resCustom,tsi_value) plot(tsi, color=black) plot(ema(tsi, signal), color=red) hline(0, title="Zero")Chỉ báo Pine Script®của QuantitativeExhaustion1313 1.8 K
Ergotic TSI Strategy r - Length of first EMA smoothing of 1 day momentum s - Length of second EMA smoothing of 1 day smoothing u- Length of third EMA smoothing of 1 day momentum Length of EMA signal line This is one of the techniques described by William Blau in his book "Momentum, Direction and Divergence" (1995). If you like to learn more, we advise you to read this book. His book focuses on three key aspects of trading: momentum, direction and divergence. Blau, who was an electrical engineer before becoming a trader, thoroughly examines the relationship between price and momentum in step-by-step examples. From this grounding, he then looks at the deficiencies in other oscillators and introduces some innovative techniques, including a fresh twist on Stochastics. On directional issues, he analyzes the intricacies of ADX and offers a unique approach to help define trending and non-trending periods. You can use in the xPrice any series: Open, High, Low, Close, HL2, HLC3, OHLC4 and ect...Chỉ báo Pine Script®của HPotter44655