MorphWave Bands [JOAT]MorphWave Bands - Adaptive Volatility Envelope System
MorphWave Bands create a dynamic price envelope that automatically adjusts its width based on current market conditions. Unlike static Bollinger Bands, this indicator blends ATR and standard deviation with an efficiency ratio to expand during trending conditions and contract during consolidation.
What This Indicator Does
Plots adaptive upper and lower bands around a customizable moving average basis
Automatically adjusts band width using a blend of ATR and standard deviation
Detects volatility squeezes when bands contract to historical lows
Highlights breakouts when price moves beyond the bands
Provides squeeze alerts for anticipating volatility expansion
Adaptive Mechanism
The bands adapt through a multi-step process:
// Blend ATR and Standard Deviation
blendedVol = useAtrBlend ? (atrVal * 0.6 + stdVal * 0.4) : stdVal
// Normalize volatility to its historical range
volNorm = (blendedVol - volLow) / (volHigh - volLow)
// Create adaptive multiplier
adaptMult = baseMult * (0.5 + volNorm * adaptSens)
This creates bands that respond to market regime changes while maintaining stability.
Squeeze Detection
A squeeze is identified when band width drops below a specified percentile of its historical range:
Background highlighting indicates active squeeze conditions
Low percentile readings suggest compressed volatility
Squeeze exits often precede directional moves
Inputs Overview
Band Length — Period for basis calculation (default: 20)
Base Multiplier — Starting band width multiplier (default: 2.0)
MA Type — Choose from SMA, EMA, WMA, VWMA, or HMA
Adaptation Lookback — Historical period for normalization (default: 50)
Adaptation Sensitivity — How much bands respond to volatility changes
Squeeze Threshold — Percentile below which squeeze is detected
Dashboard Information
Current trend direction relative to basis and bands
Band width percentage
Squeeze status (Active or None)
Efficiency ratio
Current adaptive multiplier value
How to Use It
Look for squeeze conditions as potential precursors to breakouts
Use band touches as dynamic support/resistance references
Monitor breakout signals when price closes beyond bands
Combine with momentum indicators for directional confirmation
Alerts
Upper/Lower Breakout — Price exceeds band boundaries
Squeeze Entry/Exit — Volatility compression begins or ends
Basis Crosses — Price crosses the center line
This indicator is provided for educational purposes. It does not constitute financial advice.
— Made with passion by officialjackofalltrades
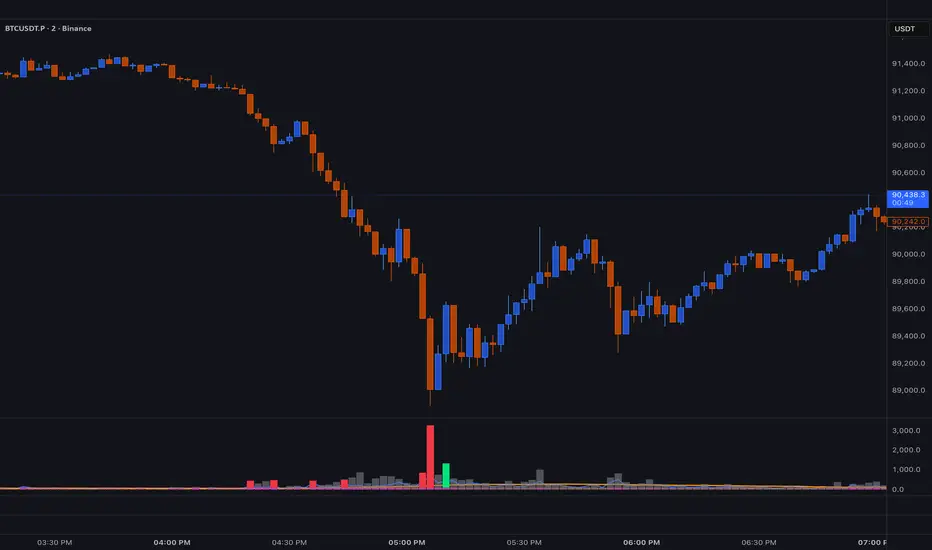
VOLUMEBREAKOUT

BT SpikeBT Spike is a lightweight but highly effective alert engine designed to identify
moments of unusual volatility and volume expansion . These spikes often appear
at the very beginning of major moves, giving traders early insight into:
Momentum ignition
Breakout confirmation
Liquidity shifts
Stop runs & displacement moves
Trend acceleration
High-impact expansions before news or volatility events
Rather than watching charts all day, BT Spike allows traders to receive
instant alerts whenever the market enters an abnormal volatility regime.
---
■ What BT Spike Measures
1. ATR Spike
Detects sudden expansion in true range (micro-volatility).
This often marks the beginning of a displacement candle.
2. Volume Spike
Identifies candles where volume exceeds typical market participation.
3. Combined Spike
A powerful signal triggered only when both conditions occur together:
ATR Spike AND Volume Spike
4. Spike Score (0–100)
A normalized measure of spike intensity.
• Higher score → Stronger anomaly
• 90+ → Extreme event (liquidity shifts, stop runs, institutional activity)
---
■ Visual Elements
• True Range Line
Shows per-candle volatility relative to baseline ATR.
• Volume Bars (Color-Scaled)
Volume bars turn:
Green for bullish spikes
Red for bearish spikes
Intensity based on Spike Score
Gray during normal activity
This creates a clear volatility heatmap directly in the volume panel.
• Spike Score Histogram
Helps visually identify:
Minor spikes
Major volatility clusters
Extreme anomalies
• Threshold Lines
Yellow = Minor
Orange = Major
Red = Extreme
---
■ Why BT Spike Is Useful
Spike-based analysis helps traders:
Catch large moves early
Confirm breakouts and avoid fake ones
Identify when smart money enters the market
Find the start of momentum legs
Monitor many charts with alerts instead of manual watching
A spike is often the first footprint of a meaningful move.
---
■ Practical Trading Uses
1. Breakout Confirmation
A breakout with no spike is often weak.
A breakout with a spike is typically genuine and sustained.
2. Reversal Detection
Extreme spike after a sweep often signals a reversal event.
3. Trend Ignition
Spikes frequently occur at the beginning of:
Trend legs
News-driven surges
Momentum continuation moves
4. Divergence With Price
High-volume, high-ATR spikes with little price movement can indicate:
Absorption
Trap conditions
Exhaustion
5. Alert-Driven Market Monitoring
Set alerts for:
ATR Spike
Volume Spike
Combined Spike
Major Spike (Score ≥ threshold)
Extreme Spike (Score ≥ threshold)
This allows traders to walk away while still catching every volatility event.
---
■ Spike Score Guide
0–30 → Mild noise
30–60 → Minor shift
60–80 → Strong volatility expansion
80–95 → Major spike (high-impact)
95–100 → Extreme event (institutional presence, sweeps, stop runs)
---
■ Final Summary
BT Spike gives traders:
Early detection of volatility expansion
Bull/Bear intensity visualization
Powerful alert automation
A universal signal layer that fits any strategy
Cleaner insight into where major moves originate
BT Spike = Your volatility radar .
It tells you when to look at a chart—before the move happens.
Kinetic EMA & Volume with State EngineKinetic EMA & Volume with State Engine (EMVOL)
1. Introduction & Concept
The EMVOL indicator converts a dense family of EMA signals and volume flows into a compact “state engine”. Instead of looking at individual EMA lines or simple crossovers, the script treats each EMA as part of a kinetic vector field and classifies the market into interpretable states:
- Trend direction and strength (from a grid of prime‑period EMAs).
- Volume regime (expansion, contraction, climax, dry‑up).
- Order‑flow bias via delta (buy versus sell volume).
- A combined scenario label that summarises how these three layers interact.
The goal is educational: to help traders see that moving averages and volume become more meaningful when observed as a structure, not as isolated lines. EMVOL is therefore designed as a real‑time teaching tool, not as an automatic signal generator.
2. Volume Settings
Group: “Volume Settings”
A. Calculation Method
- Geometry (Source File) – Default mode.
Buy and sell volume are estimated from each candle’s geometry: the close is compared to the high/low range and the bar’s total volume is split proportionally between buyers and sellers. This approximation works on any TradingView plan and does not require lower‑timeframe data.
- Intrabar (Precise) – Reconstructs buy/sell volume using a lower timeframe via requestUpAndDownVolume(). The script asks TradingView for historical intrabar data (e.g., 15‑second bars) and builds buy/sell volume and delta from that stream. This mode can produce a more accurate view of order flow, but coverage is limited by your account’s history limits and the symbol’s available lower‑timeframe data.
B. Intrabar Resolution (If Precise)
- Intrabar Resolution (If Precise) – Selected only when the calculation method is “Intrabar (Precise)”. It defines which lower timeframe (for example 15S, 30S, 1m) is used to compute up/down volume. Smaller intrabar timeframes may give smoother and more granular deltas, but require more historical depth from the platform.
When “Intrabar (Precise)” is active, the dashboard’s extended section shows the resolution and the number of bars for which precise volume has been successfully retrieved, in the format:
- Mode: Intrabar (15S) – where N is the count of bars with valid high‑resolution volume data.
In Geometry mode this counter simply reflects the processed bars in the current session.
3. Kinetic Vector Settings
Group: “Kinetic Vector”
A. Vector Window
- Vector Window – Controls the temporal smoothing applied to the aggregated vectors (trend, volume, delta, etc.). Internally, each bar’s vector value is averaged with a simple moving window of this length.
- Shorter windows make the state engine more reactive and sensitive to local swings.
- Longer windows make the states more stable and better suited to higher‑timeframe structure.
B. Max Prime Period
- Max Prime Period – Sets the largest prime number used in the EMA grid. The engine builds a family of EMAs on prime lengths (2, 3, 5, 7, …) up to this limit and converts their slopes into angles.
- A higher limit increases the number of long‑horizon EMAs in the grid and makes the vectors sensitive to broader structure.
- A lower limit focuses the analysis on short- and medium‑term behaviour.
C. Price Source
- Price Source – The price series from which the kinetic EMA grid is built (e.g., Close, HLC3, OHLC4). Changing the source modifies the context that the state engine is reading but does not change the core logic.
4. State Engine Settings
Group: “State Engine Settings”
These inputs define how the continuous vectors are translated into discrete states.
A. Trend Thresholds
- Strong Trend Threshold – Value above which the trend vector is treated as “extreme bullish” and below which it is “extreme bearish”.
- Weak Trend Threshold – Inner boundary between neutral and directional conditions.
Roughly:
- |trend| < weak → Neutral trend state.
- weak < |trend| ≤ strong → Bullish/Bearish.
- |trend| > strong → Extreme Bullish/Extreme Bearish.
B. Volume Thresholds
- Volume Climax Threshold – Upper bound at which volume is considered “climax” (unusually expanded participation).
- Volume Expansion Threshold – Boundary for normal expansion versus contraction.
Conceptually:
- Volume above “expansion” indicates increasing activity.
- Volume near or above “climax” marks extreme participation.
- Negative values below the symmetric thresholds map to contraction and extreme dry‑up (liquidity vacuum) states.
C. Delta Thresholds
- Strong Delta Threshold – Cut‑off for extreme buying or selling dominance in delta.
- Weak Delta Threshold – Threshold for mild buy/sell bias versus neutral order flow.
Combined with the sign of the delta vector, these thresholds classify order flow as:
- Extreme Buy, Buy‑Dominant, Neutral, Sell‑Dominant, Extreme Sell.
D. State Hysteresis Bars
- State Hysteresis Bars – Minimum number of bars for which a new state must persist before the engine commits to the change. This prevents the dashboard from flickering during fast spikes and emphasises persistent market behaviour.
- Smaller values switch states quickly; larger values demand more confirmation.
5. Visual Interface
Group: “Visual Interface”
A. Ribbon Base Color
- Ribbon Base Color – Base hue for the multi‑layer EMA ribbon drawn around price. The script plots a dense grid of hidden EMAs and fills the gaps between them to form a semi‑transparent band. Narrow, overlapping bands hint at compression; wider separation hints at dispersion across EMA horizons.
B. Show Dashboard
- Show Dashboard – Toggles the on‑chart table which summarises the current state engine output. Disable this if you only want to keep the EMA ribbon and volume‑based structure on the price chart.
C. Color Theme
- Color Theme – Switch between a dark and light style for the dashboard background and text colours so that the table matches your chart theme.
D. Table Position
- Table Position – Places the dashboard at any corner or edge of the chart (Top / Middle / Bottom × Left / Centre / Right).
E. Table Size
- Table Size – Changes the dashboard’s text size (Tiny, Small, Normal, Large). Use a larger size on high‑resolution screens or when streaming.
F. Show Extended Info
- Show Extended Info – Adds diagnostic rows under the main state summary:
- Mode / Primes / Vector – Shows the current calculation mode (Geometry / Intrabar), the selected intrabar resolution and coverage in bars ( ), how many prime periods are active, and the vector window.
- Values – Displays the current aggregated vectors:
- P: price vector
- V: volume vector
- B: buy‑volume vector
- S: sell‑volume vector
- D: delta vector
Values are bounded between ‑1 and +1.
- Volume Stats – Prints the last bar’s raw buy volume, sell volume and delta as formatted numbers.
- Footer – A final row with the symbol and current time: #SYMBOL | HH:MM.
These extended rows are meant for inspecting how the engine is behaving under the hood while you scroll the chart and compare different assets or timeframes.
6. Language Settings
Group: “Language Settings”
- Select Language – Switches the entire dashboard between English and Turkish.
The underlying calculations and scenario logic are identical; only the labels, titles and comments in the table are translated.
7. Dashboard Structure & Reading Guide
The table summarises the current situation in a few rows:
1. System Header – Shows the script name and the active calculation method (“Geometry” or “Intrabar”).
2. Scenario Title – High‑level description of the current combined scenario (e.g., “Trending Buy Confirmed”, “Sideways Balanced”, “Bull Trap”, “Blow‑Off Top”). The background colour is derived from the scenario family (trending, compression, exhaustion, anomaly, etc.).
3. Bias / Trend Line – States the dominant trend bias derived from the trend vector (Extreme Bullish, Bullish, Neutral, Bearish, Extreme Bearish).
4. Signal / Consideration Line – A short sentence giving qualitative guidance about the current state (for example: continuation risk, exhaustion risk, trap‑like behaviour, or compression). This is deliberately phrased as a consideration, not as a direct trading signal.
5. Trend / Volume / Delta Rows – Three separate rows explain, in plain language, how the trend, volume regime and delta are classified at this bar.
6. Extended Info (optional) – Mode / primes / vector settings, current vector values, and last‑bar volume statistics, as described above.
Together, these rows are meant to be read as a narrative of what price, volume and order‑flow are doing, not as mechanical instructions.
8. State Taxonomy
The state engine organizes market behaviour in three stages.
8.1 Trend States (from the Price Vector)
- Extreme Bullish Trend – The prime‑grid price vector is strongly upward; most EMAs are aligned to the upside.
- Bullish Trend – Upward bias is present, but less extreme.
- Neutral Trend – EMAs are mixed or flat; price is effectively sideways relative to the grid.
- Bearish Trend – Downward bias, with the EMA grid sloping down.
- Extreme Bearish Trend – Strong downside alignment across the grid.
8.2 Volume Regime States (from the Volume Vector)
- Volume Climax (Buy‑Side) – Strong positive volume vector; participation is unusually high in the current direction.
- Volume Expansion – Activity above normal but below the climax threshold.
- Neutral Volume – No major expansion or contraction versus recent history.
- Volume Contraction – Activity is drying up compared with the past.
- Extreme Dry‑Up / Liquidity Vacuum – Very low participation; the market is thin and prone to slippage.
8.3 Delta Behaviour States (from the Delta Vector)
- Extreme Buy Delta – Buying pressure dominates strongly.
- Buy‑Dominant Delta – Buy volume exceeds sell volume, but not at an extreme.
- Neutral Delta – Buy and sell flows are roughly balanced.
- Sell‑Dominant Delta – Selling pressure dominates.
- Extreme Sell Delta – Aggressive, one‑sided selling.
8.4 Combined Scenario State s
EMVOL uses the three base states above to generate a single scenario label. These scenarios are designed to be read as context, not as entry or exit signals.
Trending Scenarios
1. Trending Buy Confirmed
- Bullish or extreme bullish trend, supported by expanding or climax volume and buy‑side delta.
- Educational idea: a healthy uptrend where both participation and order flow agree with the direction.
2. Trending Buy – Weak Volume
- Bullish trend, but volume is neutral, contracting or in dry‑up while delta is still buy‑side.
- Educational idea: price is advancing, yet participation is thinning; trend continuation becomes more fragile.
3. Trending Sell Confirmed
- Bearish or extreme bearish trend, with expanding or climax volume and sell‑side delta.
- Educational idea: strong downtrend with both volume and order‑flow confirmation.
4. Trending Sell – Weak Volume
- Bearish trend, but volume is neutral, contracting or very low while delta remains sell‑side.
- Educational idea: downside continues but with limited participation; vulnerable to short‑covering.
Sideways / Range Scenarios
5. Sideways Balanced
- Neutral trend, neutral delta, neutral volume.
- Classic range environment; low directional edge, suitable for observation and context rather than trend trading.
6. Sideways with Buy Pressure
- Neutral trend, but buy‑side delta is dominant or extreme.
- Range with latent accumulation: price may still appear sideways, but buyers are quietly more active.
7. Sideways with Sell Pressure
- Neutral trend with dominant or extreme sell‑side delta.
- Distribution‑like environment where price chops while sellers are gradually more aggressive.
Exhaustion & Volume Extremes
8. Exhaustion – Buy Risk
- Extreme bullish trend, volume climax and strong buy‑side delta.
- Educational idea: very strong up‑move where both participation and delta are already stretched; risk of exhaustion or blow‑off.
9. Exhaustion – Sell Risk
- Extreme bearish trend, volume dry‑up and strong sell‑side delta.
- Suggests one‑sided selling into increasingly thin liquidity.
10. Volume Climax (Buy)
- Neutral trend, neutral delta, but volume at climax levels.
- Often associated with a “big event” bar where participation spikes without a clear directional commitment.
11. Volume Climax (Sell / Dry‑Up)
- Neutral trend and neutral delta, while the volume vector indicates an extreme dry‑up.
- Highlights a stand‑still episode: very limited interest from both sides, increasing the sensitivity to future impulses.
Divergences
12. Divergence – Bullish Context
- Bullish or extreme bullish trend, but delta has faded back to neutral.
- Price trend continues while order‑flow conviction softens; can precede pauses or complex corrections.
13. Divergence – Bearish Context
- Bearish or extreme bearish trend with a neutral delta.
- Downtrend persists, but selling pressure no longer dominates as clearly.
Consolidation & Compression
14. Consolidation
- Default state when no specific pattern dominates and the market is broadly balanced.
- Educational use: treat this as a “no strong edge” label; focus on structure rather than direction.
15. Breakout Imminent
- Neutral trend with contracting volume.
- Compression phase where energy is building up; often precedes transitions into trending or shock scenarios.
Traps & Hidden Divergences
16. Bull Trap
- Bullish trend, with neutral or contracting volume and sell‑side delta.
- Price appears strong, but order‑flow shifts against it; often seen near fake breakouts or failing rallies.
17. Bear Trap
- Bearish trend, neutral or contracting volume, but buy‑side delta.
- Downtrend “looks” intact, while buyers become more aggressive underneath the surface.
18. Hidden Bullish Divergence
- Bullish trend, contracting volume, but strong buy‑side delta.
- Educational idea: price dips or slows while aggressive buyers step in, often inside an ongoing uptrend.
19. Hidden Bearish Divergence
- Bearish trend, volume expansion and strong sell‑side delta.
- Reinforced downside pressure even if price is temporarily retracing.
Reversal & Transition Patterns
20. Reversal to Bearish
- Neutral trend, volume climax and strong sell‑side delta.
- Suggests that heavy selling appears at the top of a move, turning a previously neutral or rising context into potential downside.
21. Reversal to Bullish
- Neutral trend, extreme volume dry‑up and strong buy‑side delta.
- Often associated with selling exhaustion where buyers start to take control.
22. Indecision Spike
- Neutral trend with extreme volume (climax or dry‑up) but neutral delta.
- Crowd participation changes sharply while order‑flow remains undecided; treat as an informational spike rather than a direction.
Extended Compression & Acceleration
23. Coiling Phase
- Neutral trend, contracting volume, and delta that is neutral or only mildly one‑sided.
- Extended compression where price, volume and delta all contract into a tightly coiled range, often preceding a strong move.
24. Bullish Acceleration
- Bullish trend with volume expansion and strong buy‑side delta.
- Uptrend not only continues but gains kinetic strength; educationally, this illustrates how trend, volume and delta align in the strongest phases of a move.
25. Bearish Acceleration
- Bearish trend with volume expansion and strong sell‑side delta.
- Mirror image of Bullish Acceleration on the downside.
Trend Exhaustion & Climax Reversal
26. Bull Exhaustion
- Bullish or extreme bullish trend, with contraction or dry‑up in volume and buy‑side or neutral delta.
- The move has already travelled far; participation fades while price is still elevated.
27. Bear Exhaustion
- Bearish or extreme bearish trend, with volume climax or contraction and sell‑side or neutral delta.
- Down‑move may be approaching a point where additional selling pressure has diminishing impact.
28. Blow‑Off Top
- Extreme bullish trend, volume climax and extreme buy delta all at once.
- Classic blow‑off behaviour: price, volume and order‑flow are simultaneously stretched in the same direction.
29. Selling Climax Reversal
- Extreme bearish trend with extreme volume dry‑up and extreme sell‑side delta.
- Marks a very aggressive capitulation phase that can precede major rebounds.
Advanced VSA / Anomaly Scenarios
30. Absorption
- Typically neutral trend with expanding or climax volume and extreme delta (either buy or sell).
- Educational focus: large participants are aggressively absorbing liquidity from the opposite side, while price remains relatively contained.
31. Distribution
- Scenario where volume remains elevated while directional conviction weakens and the trend slows.
- Represents potential “selling into strength” or “buying into weakness”, depending on the active side.
32. Liquidity Vacuum
- Combination of thin liquidity (extreme dry‑up) with a directional trend or strong delta.
- Highlights environments where even small orders can move price disproportionately.
33. Anomaly / Shock Event
- Triggered when the vector z‑scores detect rare combinations of price, volume and delta behaviour that deviate from their own historical distribution.
- Intended as a warning label for unusual events rather than a specific tradeable pattern.
9. Educational Usage Notes
- EMVOL does not produce mechanical “buy” or “sell” commands. Instead, it classes each bar into an interpretable state so that traders can study how trends, volume and order‑flow interact over time.
- A common exercise is to overlay your usual EMA crossovers, support/resistance or price patterns and observe which EMVOL scenarios appear around entries, exits, traps and climaxes.
- Because the vectors are normalized (bounded between ‑1 and +1) and then discretized, the same conceptual states can be compared across different symbols and timeframes.
10. Disclaimer & Educational Purpose
This indicator is provided strictly as an educational and analytical tool. Its purpose is to help visualise how price, volume and order‑flow interact; it is not designed to function as a stand‑alone trading system.
Please note:
1. No Automated Strategy – The script does not implement a complete trading strategy. Scenario labels and dashboard messages are descriptive and should not be followed as unconditional entry or exit signals.
2. No Financial Advice – All information produced by this indicator is general market analysis. It must not be interpreted as investment, financial or trading advice, or as a recommendation to buy or sell any instrument.
3. Risk Warning – Trading and investing involve substantial risk, including the risk of loss. Always perform your own analysis, use appropriate position sizing and risk management, and consult a qualified professional if needed. You are solely responsible for any decisions made using this tool.
4. Data Precision & Platform Limits – The “Intrabar (Precise)” mode depends on the availability of high‑resolution historical data at the chosen intrabar timeframe. If your TradingView plan or the symbol’s history does not provide sufficient depth, this mode may only partially cover the visible chart. In such cases, consider switching to “Geometry (Source File)” for a fully populated view.

Flow Rider Mother Candle Breakout Long Short indicator - ScalpOVERVIEW
// ═══════════════════════════════════════════════════════════
// 1. Detects HIGH VOLUME "Mother/Big" candles
// 2. Waits for 2+ INSIDE bars (consolidation)
// 3. Enters SHORT on bearish breakout below mother low Enters Long on bullish breakout above
// 4. Stop Loss: Highest point + 1.5x largest upper wick (default)
// 5. Targets: TP1 @ 0.618, TP2 @ 1.618 Fibonacci extensions

Volume Threshold Levels - Crypto LidyaVolume Threshold Levels – Crypto Lidya
Understanding volume behavior is one of the most effective ways to detect trend changes, manipulation candles, aggressive entries, and institutional activity.
Volume Threshold Levels (VTL) not only displays raw volume but also calculates dynamic volume thresholds (2x – 3x – 4x) based on the moving average, allowing you to identify statistically meaningful volume anomalies with precision.
📌 1. Volume Columns
The indicator plots each bar’s volume using traditional column-style visualization.
Green: Bullish candle
Red: Bearish candle
Gray: Neutral candle
This helps traders clearly understand the relationship between price and volume.
📌 2. Average Volume Area
VTL offers two types of moving averages for volume:
SMA (Simple Moving Average)
EMA (Exponential Moving Average)
The average volume is drawn as a soft yellow area across the chart.
This area acts as the baseline for normal volume levels.
📌 3. Dynamic Threshold Lines (2x / 3x / 4x)
The script calculates and displays multipliers of the average volume:
2x Average
3x Average
4x Average
These levels appear as bright yellow lines.
They are extremely useful for identifying breakouts, traps, and aggressive institutional entries.
📌 4. Volume Spike Detection (Alerts)
VTL identifies upward crossovers where volume breaks above key levels:
1x Volume Signal
2x Volume Signal
3x Volume Signal
4x Volume Signal
These can be used directly as TradingView alerts.
This allows you to automate detection of high-impact volume spikes.
📌 5. Use Cases
The indicator performs exceptionally well in:
Breakout confirmation
Liquidity sweep analysis
Detecting manipulation candles
Combining with OB, FVG, or other SMC structures
Scalping and low-timeframe aggressive volume interpretation
Algorithmic filters for volume-based strategies
📌 6. Summary
VTL delivers:
✔ Dynamic average volume baseline
✔ Clear 2x–3x–4x volume thresholds
✔ Accurate detection of upside volume explosions
✔ A strong tool for traders who rely on volume confirmation
Completely open-source and ready to be extended.

Volume essential parameters overlayVolume EPO – Essential Volume Parameters Overlay
1. Motivation and design philosophy
Volume EPO is designed as a conceptual overlay rather than a self contained trading system. The main idea behind this script is to take complex, foundational market concepts out of heavy, menu driven strategies and express them as lightweight, independent layers that sit on top of any chart or indicator.
In many TradingView scripts, a single strategy tries to handle everything at once: signal logic, risk settings, visual cues, multi timeframe controls, and conceptual explanations. This usually leads to long input menus, performance issues, and difficult maintenance. The architectural approach behind Volume EPO is the opposite: keep the core strategy lean, and move the explanation and measurement of key concepts into dedicated overlays.
In this framework, Volume EPO is the base layer for the concept of volume. It does not decide anything about entries or exits. Instead, it exposes and clarifies how different definitions of volume behave candle by candle. Other layers or strategies can then build on top of this understanding.
2. What Volume EPO does
Volume EPO focuses on four essential volume parameters for each bar:
- Buy volume - Sell volume - Total volume - Delta volume (the difference between buy and sell volume)
The script presents these parameters in a compact heads up display (HUD) table that can be positioned anywhere on the chart. It is designed to be visually minimal, language aware, and usable on top of any other indicator or price action without cluttering the view.
The indicator does not output signals, alerts, arrows, or strategy entries. It is a descriptive and educational tool that shows how volume is distributed, not a prescriptive tool that tells the trader what to do.
3. Two definitions of volume
A central theme of this script is that there is more than one way to define and interpret “volume” inside a single candle. Volume EPO implements and clearly separates two different approaches:
- A geometric, candle based approximation that uses only OHLC and volume of the current bar. - An intrabar, data driven definition that uses lower timeframe up and down volume when it is available.
The user can switch between these modes via the calculation method input. The mode is prominently shown inside the on chart table so that the context is always explicit.
3.1 Geometry mode (Source File, approximate)
In Geometry mode, Volume EPO works only with the current bar’s OHLC values and total volume. No lower timeframe data is required.
The candle’s range is defined as high minus low. If the range is positive, the position of the close inside that range is used as a simple model for how volume might have been distributed between buyers and sellers:
- The closer the close is to the high, the more of the total volume is attributed to the buying side. - The closer the close is to the low, the more of the total volume is attributed to the selling side. - In a rare case where the bar has no price range (for example a flat or doji bar), total volume is split evenly between buy and sell volume.
From this model, the script derives:
- Buy volume (approximated) - Sell volume (approximated) - Total volume (as reported by the bar) - Delta volume as the difference between buy and sell volume
This approach is intentionally labeled as “Geometry (Approx)” in the HUD. It is a theoretical reconstruction based solely on the candle’s geometry and total volume, and it is always available on any market or timeframe that provides OHLCV data.
3.2 Intrabar mode (Precise)
In Intrabar mode, Volume EPO uses the TradingView built in library for up and down volume on a user selected lower timeframe. Instead of inferring volume from the shape of the candle, it reads the underlying lower timeframe data when that data is accessible.
The script requests up and down volume from a lower timeframe such as 15 seconds, using the official TA library functions. The results are then interpreted as follows:
- Buy volume is taken as the absolute value of the up volume. - Sell volume is taken as the absolute value of the down volume. - Total volume is the sum of buy and sell volume. - Delta volume is provided directly by the library as the difference between up and down volume.
If valid lower timeframe data exists for a bar, the bar is counted as covered by Intrabar data. If not, that bar is marked as invalid for this precise calculation and is excluded from the covered count.
This mode is labeled “Precise” in the HUD, together with the selected lower timeframe, because it is anchored in actual intrabar data rather than in a geometric model. It provides a closer view of how buying and selling pressure unfolded inside the bar, at the cost of requiring more data and being dependent on the availability of that data.
4. Coverage, lookback, and what the numbers mean
The top part of the HUD reports not only which volume definition is active, but also an additional line that describes the effective coverage of the data.
In Intrabar (Precise) mode, the script displays:
- “Scanned: N Bars”
Here, N counts how many bars since the indicator was loaded have successfully received valid lower timeframe delta data. It is a measure of how much of the visible history has been truly covered by intrabar information, not a lookback window in the sense of a rolling calculation.
In Geometry mode, the script displays:
- “Lookback: L Bars”
In this extracted layer, the lookback value L is purely descriptive. It does not change how the current bar’s volume is computed, and it is not used in any iterative or statistical calculation inside this script. It is meant as a conceptual label, for example to keep the volume layer consistent with a broader framework where lookback length is a structural parameter.
Summarizing these two fields:
- Scanned tells you how many bars have been processed using real intrabar data. - Lookback is a descriptive parameter in Geometry mode in this specific overlay, not a direct driver of the computations.
5. The HUD layout on the chart
The on chart table is intentionally compact and structured to be read quickly:
- Header: a title identifying the overlay as Volume EPO. - Mode line: explicitly states whether the script is in Precise or Geometry mode, and for Precise mode also shows the lower timeframe used. - Coverage line: - In Precise mode, it shows “Scanned: N Bars”. - In Geometry mode, it shows “Lookback: L Bars”. - Volume block: - A line for buy and sell volume, marked with clear directional symbols. - A line for total volume and the absolute delta, accompanied by the sign of the delta. - Numeric formatting uses human friendly suffixes (for example K, M, B) to keep the display readable. - Footer: the current symbol and a time stamp, adjusted by a user selectable timezone offset so that the HUD can be aligned with the trader’s local time reference.
The table can be positioned anywhere on the chart and resized via inputs, and it supports multiple color themes and languages in order to integrate cleanly into different chart layouts.
6. How to use Volume EPO in practice
Volume EPO is meant to be read together with price action and other tools, not in isolation. Typical uses include:
- Studying how often a strong directional candle is actually supported by dominant buy or sell volume. - Comparing the behavior of delta volume between Geometry and Intrabar definitions. - Building a personal intuition for how intrabar data refines or contradicts the simple candle based approximation. - Feeding these insights into separate, lean strategy scripts that do not need to carry the full explanatory logic of volume inside them.
Because it is an overlay layer, Volume EPO can be stacked with other custom indicators without adding new signals or complexity to their logic. It simply adds a clear and consistent view of volume behavior on top of whatever the trader is already watching.
7. Educational and non signalling nature
Finally, it is important to stress that Volume EPO is not a trading system, not a signal generator, and not financial advice. The script does not tell the user when to enter or exit. It only reports how different definitions of volume describe the current bar.
Deciding whether to trade, how to trade, and which risk parameters to use remains entirely with the user and with their own strategy. Volume EPO provides context and clarity around the concept of volume so that those decisions can be informed by a better understanding of how buying and selling pressure is structured inside each candle.
Note: Even on lower timeframes, every reconstruction of volume remains an approximation, except at the true single tick level. However, the closer the chosen lower timeframe is to a one tick stream, the more accurately it can reflect the underlying order flow and balance between buying and selling pressure.

Volume Surge AlertVolume is often the fuel behind meaningful price moves. The Volume Surge Alert indicator highlights bars where volume explodes above its recent average, helping you spot accumulation, distribution, and breakout attempts before the price fully reacts.
Calculates a configurable simple moving average of volume to establish “normal” activity.
Flags bars where the current volume exceeds the SMA by a user-defined multiple (default 2×).
Colors the column and background on surge bars for quick visual confirmation.
Provides an alert condition so you can receive notifications the moment activity spikes.
Use it on any timeframe or market to monitor for unusual participation, confirm breakouts, or filter entries. Adjust the SMA length and surge multiple to match your market’s typical liquidity profile.

ORB Pro SuiteOverview
ORB Pro with Filters + Debug Overlay is an advanced Opening Range Breakout indicator designed for precision intraday trading. It defines a configurable ORB window, automatically builds the breakout range, and triggers long or short signals only when all active filters align. The script also includes a built-in debug overlay that explains why each breakout is accepted or blocked, allowing traders to fine-tune entries with transparency.
What Makes It Unique
• Modular filter stack – close-confirmation vs. instant breaks, retest confirmation with adjustable tolerance %, volume-spike and EMA-trend filters, ORB-size range, session cutoff, and cooldown logic.
• Non-blocking debug overlay – inline or corner display of the exact rejection reason (“Too late,” “Low volume,” “Trend mismatch,” etc.).
• Fully customizable visuals – choose shaded, outline, or line-only ORB styles; set opacity, border color, and right-edge offset so the box never hides current candles.
• Integrated reversal engine – detects doji, hammer, and engulfing structures within a time-filtered window and optional VWAP/EMA confluence.
How It Works
During the defined opening window (default 9:30 – 9:45 NY), the indicator records the session high and low.
After the box closes, it looks for breakouts confirmed by candle close or retest (per user settings).
Each signal passes through range, volume, trend, time-delay, and session filters before printing.
Visual stop-loss / take-profit levels appear for reference using either R:R multiples or fixed %.
The optional reversal layer marks short-term exhaustion zones for counter-scalp setups.
Usage Guidelines
• Apply to standard candlestick charts (not Heikin Ashi, Renko, or Range).
• Select your local ORB start / end time, then enable or disable filters based on your playbook.
• Use the “Outline only” or “Corner table” debug modes for a cleaner chart.
• The script provides visual and alert-based confirmations only; it does not execute orders or backtest performance.
Inputs at a Glance
– ORB window (start/end time)
– Close-confirm toggle
– Retest tolerance %
– Volume SMA length
– EMA length for trend filter
– Min/Max range % filter
– Cooldown bars and session cutoff
– Visual R:R ratio or fixed SL/TP %
– Box style, opacity, border width / color
– Debug overlay mode (inline or table) and leader lines
Notes & Disclaimers
• This script is for analysis and educational purposes only. It does not constitute financial advice or guarantee performance.
• Signals are calculated on completed bars without lookahead.
• Invite-only access ensures version integrity and controlled distribution.
© Trades with B – Original development in Pine v6. Reuse of this code requires explicit permission from the author.

POC Volume Bar (Highest Volume in Range)What the highlighted POC bar means
🔶 1. Institutional interest
A POC often identifies where big money stepped in.
🔶 2. Support or resistance pivot
Large volume often signals:
• A reversal
• A breakout
• Or the beginning of a trend
🔶 3. Liquidity magnet
Price tends to revisit high-volume bars.
They act like magnets.
🔶 4. Trend confirmation or exhaustion
High volume on:
• Green candle → bullish participation
• Red candle → distribution / aggressive selling

Bubbles VolumeBubbles Volume Indicator
Overview
The Bubbles Volume Indicator is an advanced volume visualization tool that transforms traditional volume analysis into an intuitive, visual experience. By representing volume as dynamically-sized bubbles directly on your price chart, this indicator helps traders quickly identify significant volume events, potential support/resistance levels, and shifts in market sentiment.
Key Features
🔵 Visual Volume Representation
Displays volume as circular bubbles at the midpoint of each candle
Bubble size scales proportionally to volume significance
Instant visual identification of unusual volume activity
Clean, uncluttered chart presentation
📊 Dual Volume Modes
Total Volume Mode: Displays complete trading volume for each bar
Volume Delta Mode: Shows the difference between buying and selling pressure, helping identify market direction and strength
🎨 Advanced Coloring Systems
Simple Mode: Clear green/red coloring for buy/sell pressure
HeatMap Mode: Gradient coloring that intensifies with volume strength, providing instant visual feedback on volume intensity
📍 Significant Level Detection
Automatically identifies and marks price levels with exceptional volume
These levels often act as future support or resistance zones
Historical volume levels remain visible for reference
How to Use
For Day Traders
Identify volume climaxes that may signal reversals
Spot accumulation/distribution patterns through Volume Delta
Confirm breakouts with significant volume bubbles
For Swing Traders
Mark important support/resistance levels based on historical high-volume areas
Identify institutional activity through unusual volume patterns
Validate trend strength using volume confirmation
For Scalpers
Quick visual identification of liquidity pockets
Real-time volume delta for order flow analysis
Filter out low-volume noise with minimum contract settings
Parameter Settings
Volume Settings
Volume Type
Total Volume: Shows all traded volume for each bar - ideal for general volume analysis
Volume Delta: Displays the difference between buying and selling pressure - perfect for order flow analysis
Minimum Contracts
Filters out bubbles below a specified volume threshold
Set to 0 to disable filtering
Helps remove noise during low-volume periods
For Volume Delta: Filters based on absolute delta value
Bubble Display
Show Bubbles
Toggle the visibility of volume bubbles on/off
Bubbles appear at the middle price point (HL2) of each bar
Threshold
Statistical threshold measured in standard deviations
Controls sensitivity of volume significance detection:
1.0 = Shows top ~32% of volumes (more bubbles, common events)
2.0 = Shows top ~5% of volumes (significant events)
3.0 = Shows top ~0.3% of volumes (rare, extreme events)
Higher values display only the most significant volume spikes
HeatMap
OFF: Simple coloring scheme (green for buying, red for selling in Delta mode)
ON: Gradient coloring that intensifies with volume strength
Provides additional visual dimension to volume analysis
Volume Levels
Significant Levels
Draws horizontal lines at price levels where extreme volume occurred
Volume must exceed 3x the threshold setting to qualify
These levels often become important support/resistance zones
Levels Qty
Maximum number of significant volume level lines to display
Older lines are automatically removed when limit is exceeded
Keeps chart clean while maintaining relevant historical levels
Visual Indicators
Bubble Sizes (in order of significance)
Tiny: Minimal volume above baseline
Small: Low significant volume
Normal: Moderate volume activity
Medium: Above-average volume
Large: High volume activity
Huge: Exceptional volume
Labeled: Extreme volume with numeric display
Color Coding
Green: Buying pressure (in Volume Delta mode) or rising prices
Red: Selling pressure (in Volume Delta mode) or falling prices
Gradient Intensity: Stronger colors indicate higher relative volume
Information Display
The indicator includes a real-time information table showing:
Current operating mode (Total Volume or Volume Delta)
Live delta values with directional arrows (in Volume Delta mode)
Active minimum contracts filter setting
Best Practices
Start with default settings to familiarize yourself with the indicator
Adjust threshold based on your trading timeframe (lower for scalping, higher for position trading)
Use Volume Delta mode when analyzing order flow and market sentiment
Enable Significant Levels for swing trading to identify key support/resistance
Apply Minimum Contracts filter to reduce noise in low-volume markets
Technical Notes
The indicator requires volume data to function (not available on all symbols)
Volume Delta calculations use intrabar data for enhanced accuracy
Historical significant levels are preserved for technical analysis
Optimized for both light and dark chart themes
Trading Applications
Breakout Confirmation: Large bubbles during breakouts confirm strength
Reversal Detection: Extreme volume at tops/bottoms may signal reversals
Trend Analysis: Increasing bubble sizes confirm trend strength
Support/Resistance: High-volume levels often become future pivots
Order Flow: Volume Delta reveals real-time buying/selling pressure
TernTable: VolViz
VolViz - Overview
VolViz is designed to give traders an instant volume strength visualisation tool using multiple timeframes. It provides an interactive table overlay that allows users to track volume metrics across a range of custom-selected timeframes. The table can dynamically display relative volume (RVOL), average volume, and current volume for each selected timeframes in real time.
Additionally, users can toggle various features and adjust thresholds to receive alerts for both high and low volume conditions.
Key Features
* Volume Metrics: Displays three main volume-related data points across multiple timeframes: Relative Volume (RVOL), Average Volume, and Current Volume.
* Timeframe Flexibility: Supports a range of customisable timeframes from seconds, minutes, hours to daily weekly and monthly intervals up to 12 months. Users can select which timeframes to display.
* Dynamic Table: A table is dynamically updated with data for each enabled timeframe, allowing traders to quickly compare volume data across different periods.
* Optional alert System: Includes alert functionality for high and low volume conditions based on customisable thresholds. Alerts can be set for a minimum number of timeframes for a condition to trigger.
Colour Logic
The script uses specific colours to enhance the visual alert properties that represent different ranges of Relative Volume (RVOL), which are used in the table to visually highlight the volume data:
1. Red: RVOL is less than 1.0, indicating low relative volume.
2. Green: RVOL is between 1.0 and 1.2, indicating moderate relative volume.
3. Purple: RVOL is between 1.2 and 1.5, indicating above average relative volume.
4. Orange: RVOL is between 1.5 and 2.0, indicating higher relative volume.
5. Yellow: RVOL is greater than 2.0, indicating very high relative volume.
How to use
1. Inputs:
* Volume Period: Set the period for calculating the moving average of volume (14 period default).
* The script defaults to the 2m 5m 15m 30m 1h 4h 12h D W M timeframes but user defined custom timeframes can be used (comma-separated) to specify the timeframes to track ( e.g "D,W,M,3M,6M,12M”) to a max of 10 timeframes. The table dynamically adjusts its size dependant on how many timeframes the user chooses to input.
* Table Position: Choose where to display the table: Top Left, Top Right, Bottom Left, or Bottom Right.
* Maximum Decimal Places: Control how many decimal places are shown for volume data.
2. Toggles:
* Enable High Volume Alert: Toggle this to activate the high volume alert.
* Enable Low Volume Alert: Toggle this to activate the low volume alert.
* Enable Minimum Timeframes for Alerts: Toggle this to require a specific number of timeframes to meet the alert condition before triggering.
* Pane Labels: There is also an optional debug label found in the Style tab to identify / confirm the current mode selected and the number of timeframes that meet the alert mode criteria.
The Show Row toggles can be utilised to include or exclude rows to take up less space on the chart.
* Show RVOL Row: Toggle to show the relative volume row in the table.
* Show Avg Volume Row: Toggle to show the average volume row in the table.
* Show Current Volume Row: Toggle to show the current volume row in the table.
* Show Spacer Row Below Table: Toggle to show or hide a blank spacer row below the table.
* Show Spacer Row Above Header: Toggle to show or hide a blank spacer row above the header.
3. How the Table Works:
* The table is populated with the following rows:
1. Spacer Row Above Header (optional): Adds space above the table header.
2. Header Row: Displays the timeframes (e.g., "1h", "4h", "12h", etc.).
3. Relative Volume (RVOL): Shows the RVOL for each timeframe, colored according to the thresholds.
4. Average Volume: Shows the average volume for each timeframe.
5. Current Volume: Displays the current volume for each timeframe.
6. Spacer Row Below Table (optional): Adds space below the data rows.
4. Optional Visual Alerts:
* High Volume Alert: When the current volume exceeds the default or user specified threshold compared to the average volume for the enabled timeframes.
* Low Volume Alert: When the current volume is below the default or user specified threshold compared to the average volume for the enabled timeframes.
When the visual alerts trigger unobtrusive diamonds will appear on the chart. White diamonds above the bar to indicate high volume and yellow diamonds below the bar to indicate low volume. These are not trend direction nor entry or exit signals but may be used in conjunction with other indicators for contextual purposes.
Questions or comments are always welcomed and I hope it helps with your trading !

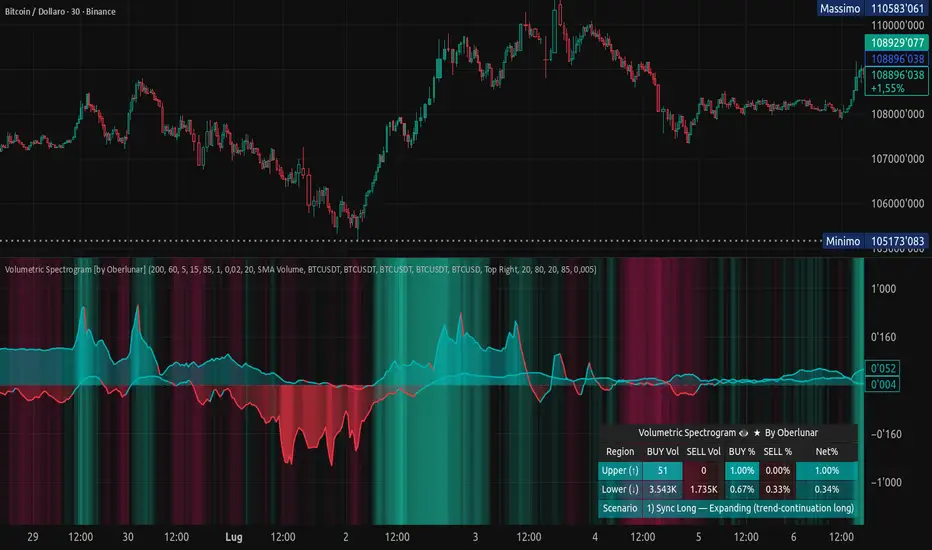
Volumetric Spectrogram [by Oberlunar]Volumetric Spectrogram
A two-pole, price-relative volume profiler that turns regional buy/sell pressure into clean oscillators and actionable regimes in a multi-broker setup.
What it measures
The indicator divides the recent price span into bins and accumulates buy vs. sell volume in each bin, then summarises two regions with respect to the current price:
Upper (↑) — volume that traded above the current price (overhead supply/demand).
Lower (↓) — volume that traded below the current price (underfoot bid/pressure).
Per region, it computes BUY% and SELL%, then forms two normalised oscillators in :
Upper Osc = Upper(BUY%) − Upper(SELL%) → positive when overhead offers are being lifted (breakout acceptance), negative when overhead sell pressure dominates (resistance).
Lower Osc = Lower(BUY%) − Lower(SELL%) → positive when sub-price bids strengthen (support/absorption), negative when selling persists beneath price (weak underbelly).
Both oscillators are optionally smoothed with EMA and can be filled to zero or between curves for quick polarity/strength reading.
Candle-fill modes across brokers
The indicator supports multiple candle-fill policies tied to cross-broker volumetric agreement (e.g., spectral/range-only fills when ≥N brokers align above 70% bullish or below 20% bearish Buy%). This makes regime and pressure shifts visually explicit while filtering out unconfirmed noise.
How it works (core algorithm)
Over a lookback window, find the high/low and split the range into N bins .
For each historical bar, approximate “buy” vs “sell” volume using candle direction and the close relative to each bin’s midprice; update left/right profiles per bin.
Aggregate bins above the current price into the Upper region and bins below into the Lower region; compute regional totals and percentages.
Convert to signed oscillators and smooth (EMA length per input).
Scenario engine (table, every bar)
A compact table reports, for Upper/Lower: BUY Vol, SELL Vol, BUY%, SELL%, and Net%. A classifier labels 8 regimes based on oscillator sign and recent expansion/decay: Sync Long/Short (Expanding/Decaying), Opposite Signs (Widening/Converging), and Tilts (Upper/Lower). This helps distinguish trend continuation, fade risk, compression before break, and asymmetric pressure (e.g., “Tilt Lower — bid/support strengthening”).
# Example strategies and annotated cases:
There are different operational strategies:
1) Bottle-neck Strategy with multi-broker confirmation
When both oscillators are red and they compress toward the zero line (a bottle-neck [/i>), if the squeeze does not flip into the opposite trend but instead resolves in the same direction, you have a continuation setup that can be exploited:
• Pattern: both oscillators red → short, visible contraction (narrow, low-variance cluster) → break of the cluster lows → background shadow bars align bearish (multi-broker agreement).
Example:
This sequence often supports a 1.5–2.5 R/R trade, as in:
Bullish mirror
If both oscillators are teal and compress, then expand upward with multi-broker agreement, the scenario becomes bullish after several bars; the position can be profitable with a reasonable risk setup:
Example:
Follow-through:
Here are the additional, English “playbook” examples you can append to the previous description.
2) Dual-confirmation on volume spikes + multi-broker checks
When pronounced volumetric spikes appear (up or down), trend often reverses sharply. In the figure, the circles highlight the spikes; once the spike subsides (reversion toward baseline), the oscillator turns bullish. The double confirmation of two consecutive minimum spikes acts as support for an ensuing up-move, with fill colors confirming direction.
Chart:
Even with a single spike confirmation, the reversion from an extreme often provides actionable long setups.
3) Volume-pressure + regime-change (multi-broker)
A prospective long configuration emerges when bullish volumetric pressure dominates and bearish pressure fades, especially if this occurs after a lateral phase, followed by a bullish volume spike and multi-broker confirmation .
Chart:
Shadow bars subsequently confirm continuation in a bullish regime; however, a possible regime change is flagged by the scenario classifier and by a color flip in the volumetric borders ( “Possible regime change, but without multi-broker confirmation.” is an appropriate label when applicable).
Chart:
After a verified mean-reversion, price transitions into a bearish configuration: both oscillators turn red. One can wait for a pullback and seek short entries.
Chart:
As shown here, the regime change is anticipated well in advance by the oscillators and multi-broker pressure:
Chart:
4) Contrastive regime-shift with multi-broker validation
In a contrastive trading phase, the lower volumetric oscillator flips color first—buyers start attacking. The first set of background shadow bars does not agree with the regime flip; the second set does. This sequence (oscillator flip → later multi-broker agreement) is a robust early sign of a potential long setup.
Chart:
At the multi-broker level, all shadow bars turn fully green and the setup becomes unambiguously bullish.
Chart:
Note that bearish pressure can still be non-trivial on the volumetric scale—even if it does not reach prior extreme minima—so risk controls should reflect the residual supply.
Delta-bar coloring (optional)
Bars (or candle overlays) can be tinted by a multi-venue weighted bias:
Choose venues (OKX, Coinbase, Bybit, Binance, BlackBull…).
Weight by Equal / Last Volume / SMA Volume.
Apply deadband to suppress flicker around neutrality and a gamma curve to modulate opacity with |bias|.
This layer is independent of the spectrogram core but provides immediate market-wide flow context, consistent with the table and fills.
Inputs (essentials)
Calculation Period and Bins — resolution and depth of the price-range histogram.
EMA length — smoothing per oscillator (optional)
Fill options — to zero / between curves, gradual opacity by |osc|, min/max alpha.
Delta Bar — enable tinting, gamma, neutral band; venue list and weighting mode.
Reading guide
Upper > 0 & expanding : overhead supply is being lifted → breakout acceptance risk rises.
Lower > 0 & expanding : sub-price bids strengthen → pullbacks more likely to absorb.
Opposite signs widening : tug-of-war; avoid late entries.
Converging : compression → prepare for break.
Use the table’s regime label to keep the narrative honest bar-by-bar.
Notes & limits
Buy/Sell attribution uses candle direction and range partitioning (no L2/tick tape).
Venue aggregation relies on per-exchange volume and your chosen weighting; symbols must align (e.g., BTCUSDT pairs).
Oscillators are relative to the current price (regional) by design; they complement, not replace, classical volume profile.
— Oberlunar 👁 ★
#1 Vishal Toora Buy/Sell Table#1 Vishal Toora Buy/Sell Table
A multi-range volume analysis tool that tracks Short, Medium, and Long-term volume activity directly from recent candles.
It calculates Buy and Sell volumes for each range, shows their Delta (difference), and generates a combined Signal (Buy / Sell / Neutral) based on all active ranges.
Each column and the Signal row can be switched ON/OFF for custom clarity.
🧠 What the Numbers Represent (Candle Connection)
Each number represents total volume from a group of candles:
The script looks back a certain number of candles in each range (e.g., 2–3 candles for Short, 10–20 for Medium, 50–100 for Long).
It measures how much volume occurred on bullish candles (Buy) vs bearish candles (Sell).
Buy Volume (Green Numbers):
Volume from candles where price closed higher than it opened → bullish pressure.
Sell Volume (Red Numbers):
Volume from candles where price closed lower than it opened → bearish pressure.
Delta (White or Yellow Numbers):
The difference between Buy and Sell volumes within that range.
Positive → More bullish volume.
Negative → More bearish volume.
Larger absolute values = stronger imbalance between buyers and sellers.
Signal Row:
Summarizes all ranges’ deltas:
🟢 Buy → majority of ranges show positive delta.
🔴 Sell → majority show negative delta.
⚪ Neutral → roughly balanced or mixed candle behavior.
🎯 In Simple Terms
Each number in the table is a summary of what recent candles did —
it converts multiple candles’ volume data into clean, readable signals,
so you instantly see who’s in control (buyers or sellers) across short, medium, and long perspectives.
© 2025 Vishal Toora — counting volumes so you don’t have to.
Buy or Sell... or just stare at the screen.
Making deltas speak louder than your ex. 💀
Disclaimer:
This indicator is for educational and informational purposes only.
It does not guarantee accuracy or performance.
You are solely responsible for your trading decisions.

VolumeAnlaysis### Volume Analysis (VA) Indicator
**Overview**
The Volume Analysis (VA) indicator is a dynamic overlay tool designed for traders seeking to identify high-volume breakouts, retests, and multi-timeframe volume-driven price cycles. By combining volume spikes with price action and support/resistance boxes, it highlights potential trend continuations, reversals, and cycle shifts. Ideal for intraday and swing trading on stocks, forex, or crypto, it uses a Fibonacci-inspired 1.618 multiplier to detect significant volume surges, then maps them to visual boxes and key levels for actionable insights.
This indicator draws from volume profile concepts but focuses on **breakout confirmation** and **cycle momentum**, helping you spot when "smart money" volume aligns with price extremes. It's particularly useful in volatile markets where volume precedes price moves.
**How It Works**
1. **Volume Break Detection**:
- Identifies a "Volume Break" when the current bar's volume exceeds 1.618x the highest volume from the prior 5 bars. This signals unusual activity, often preceding breakouts.
- A "Volume Retest" triggers exactly 3 bars after a break if volume has been falling steadily over those 3 bars—indicating a pullback for re-accumulation/distribution.
2. **Visual Annotations**:
- **Labels**: Green/red/yellow labels mark Volume Breaks and Retests, positioned above/below the bar based on candle direction for clarity.
- **Demand/Supply Boxes**:
- Blue semi-transparent boxes form around Retest bars, extending rightward to act as dynamic support/resistance.
- Green (bullish) or red (bearish) boxes draw from Volume Breaks, based on the original candle's open/close, highlighting potential zones for continuation.
- Limited to 5 boxes max to avoid chart clutter; older boxes fade as new ones form.
3. **Box Interaction Signals**:
- When price enters a box:
- **Reversal Hints**: Maroon (bearish rejection) or lime (bullish rejection) labels on closes against the trend with opening price momentum.
- **Breakout Arrows**: Up/down arrows on crossovers/crossunders of box tops/bottoms from Retest boxes.
- Scans all active boxes for interactions, prioritizing recent volume events.
4. **Multi-Timeframe Volume Cycles**:
- Aggregates the "Volume Break Max" level (a proxy for key price extremes tied to volume spikes) across timeframes: 1min, 5min, 10min, 30min, and 65min (using `request.security`).
- Computes **MaxVolBreak** (highest extreme) and **MinVolBreak** (lowest extreme) for trend-following levels.
- Tracks **Percent Volume Greater/Less Than Close**: Sums volumes from TFs where price is below/above these levels, creating a momentum ratio.
- **CrossClose**: Plots the prior close where this ratio crosses (gray line), signaling cycle shifts—bullish below MinVolBreak, bearish above MaxVolBreak.
- **Fills**: Red fill above CrossClose/MaxVolBreak (bearish cycle); green below CrossClose/MinVolBreak (bullish cycle).
5. **Plots**:
- Black lines for MaxVolBreak (⏫) and MinVolBreak (⏬).
- Gray 🔄 for CrossClose.
- Colors dynamically adjust (green/red) based on close relative to levels.
**Key Features**
- **Trend vs. Reversal Modes**: Toggle alerts for trend-following breaks (crosses of Max/MinVolBreak) or reversal signals (crosses of CrossClose).
- **Multi-TF Fusion**: Optionally include the chart's native timeframe in Max/Min calculations for finer tuning.
- **Box Management**: Auto-prunes to 5 boxes; focuses on retest/break alignments for "inside bar" logic.
- **Momentum Filters**: Uses rising/falling opens and crossovers for label precision, reducing noise.
- **Customizable**: Simple inputs for alert visibility and timeframe inclusion.
**Settings**
| Input | Default | Description |
|-------|---------|-------------|
| Show Volume Reversal Breaks | False | Enables alerts/labels for CrossClose crosses (cycle reversals). |
| Show Trend Following Breaks | True | Enables alerts for Max/MinVolBreak crosses (trend signals). |
| Use Current Time | False | Includes chart's native TF in multi-TF Max/Min calculations. |
**Alerts**
- **Reversal Alerts** (if enabled): "Volume Reverse Bullish/Bearish Break of " on close crosses of CrossClose.
- **Trend Alerts** (if enabled): "Trend Volume Bullish/Bearish Signal" on close crosses of Max/MinVolBreak; plus notes if prior low/high aligns with levels.
- All alerts include ticker and level value for easy scanning. Use `alert.freq_once_per_bar` to avoid spam.
**Trading Ideas**
- **Bullish Entry**: Green box formation + price holding MinVolBreak + upward arrow on retest box. Target next resistance.
- **Bearish Entry**: Red box + close above MaxVolBreak + red fill activation. Stop below recent low.
- **Cycle Trading**: Watch CrossClose crosses for regime shifts—fade extremes in overextended cycles.
- **Best Timeframes**: 5-30min for intraday; combine with daily for swings. Works best on liquid assets with reliable volume data.
**Limitations & Notes**
- Relies on accurate volume data (e.g., stocks/forex); less effective on low-volume or synthetic instruments.
- Boxes extend rightward but don't auto-delete—monitor for clutter on long histories (max_bars_back=500).
- Some logic (e.g., exact 3-bar retest) is rigid; backtest for your market.
- Open-source under MPL 2.0—fork and tweak as needed!
For questions or enhancements, drop a comment below. Happy trading! 🚀

ICT HTF Volume Candles (Based on HTF Candles by Fadi)# ICT HTF Volume Candles - Multi-Timeframe Volume Analysis
## Overview
This indicator provides multi-timeframe volume visualization designed to complement price action analysis. It displays volume data from up to 6 higher timeframes simultaneously in a separate panel, allowing traders to identify volume spikes, divergences, and institutional activity without switching between timeframes.
**Original Concept Credits:** This indicator builds upon the HTF Candles framework by Fadi, adapting it specifically for volume analysis with enhanced features including gap-filling for extended hours, multiple scaling methods, and advanced synchronization.
## What Makes This Script Original
### Key Innovations:
1. **Three Volume Scaling Methods:**
- **Per-HTF Auto Scale:** Each timeframe scales independently for detailed comparison
- **Global Auto Scale:** All timeframes use unified scale for relative volume comparison
- **Manual Scale:** User-defined maximum for consistent analysis across sessions
2. **Bullish/Bearish Volume Differentiation:**
- Volume bars colored based on price movement (close vs open)
- Separate styling for bullish (green) and bearish (red) volume periods
- Helps identify whether volume supports price direction
3. **Advanced Time Synchronization:**
- Custom daily candle open times (Midnight, 8:30 AM, 9:30 AM ET)
- Timezone-aware calculations for New York trading hours
- Real-time countdown timers for each timeframe
- **Gap-filling technology** for continuous display during extended hours and weekends
4. **Flexible Display Options:**
- Configurable spacing and positioning
- Label placement (top, bottom, or both)
- Day-of-week or time interval labels on candles
- Works reliably in backtesting and live trading
## How It Works
### Volume Calculation
The indicator uses `request.security()` with optimized parameters to fetch volume data from higher timeframes:
- **Volume Open/High/Low/Close (OHLC):** Tracks volume changes within each HTF candle
- **Color Logic:** Compares HTF close vs open prices to determine bullish/bearish classification
- **Alignment:** All volume bars share a common baseline for easy visual comparison
- **Gap Handling:** Uses `gaps=barmerge.gaps_off` to maintain continuity during non-trading hours
### Technical Implementation
```
1. Monitors HTF timeframe changes using request.security() with lookahead
2. Creates new VolumeCandle object when HTF bar opens
3. Updates current candle's volume H/L/C on each chart bar
4. Applies selected scaling method to normalize display height
5. Repositions all candles and labels on each bar update
6. Fills gaps automatically during extended hours for consistent display
```
### Scaling Methods Explained
**Method 1 - Auto Scale per HTF:**
Each timeframe displays volume relative to its own maximum. Best for identifying patterns within each individual timeframe.
**Method 2 - Global Auto Scale:**
All timeframes share the same scale based on the highest volume across all HTFs. Best for comparing relative volume strength between timeframes.
**Method 3 - Manual Scale:**
User sets maximum volume value. Best for maintaining consistent scale across different trading sessions or instruments.
## How to Use This Indicator
### Setup
1. Add indicator to your chart (it appears in a separate panel below price)
2. Configure up to 6 higher timeframes (default: 5m, 15m, 1H, 4H, 1D, 1W)
3. Set number of candles to display for each timeframe
4. Choose volume scaling method based on your analysis needs
5. Enable "Fix gaps in non-trading hours" for extended hours trading (enabled by default)
### Interpretation
**Volume Spikes:**
- Sudden increase in volume height indicates institutional activity or strong conviction
- Compare volume between timeframes to identify where the real money is moving
- Look for volume spikes that appear across multiple timeframes simultaneously
**Bullish vs Bearish Volume:**
- **Green volume bars:** Price closed higher (buying pressure)
- **Red volume bars:** Price closed lower (selling pressure)
- High green volume during uptrend = confirmation of strength
- High red volume during downtrend = confirmation of weakness
- High volume opposite to trend = potential reversal warning
**Multi-Timeframe Context:**
- **5m/15m:** Scalping and day trading activity
- **1H/4H:** Swing trading and intraday institutional flows
- **Daily/Weekly:** Major position building and long-term trends
**Divergences:**
- Price making new highs but volume declining = weakening trend
- Volume increasing while price consolidates = potential breakout brewing
- Price breaks level but volume doesn't confirm = likely false breakout
### Practical Examples
**Example 1 - Institutional Confirmation:**
Price breaks above resistance. Check volume across timeframes:
- 5m shows spike = retail interest
- 15m + 1H + 4H all show spikes = institutional confirmation
- **Trade confidence: HIGH**
**Example 2 - False Breakout Detection:**
Price breaks resistance with:
- High volume on 5m only
- Normal/low volume on 1H and 4H
- **Interpretation:** Likely retail trap, institutions not participating
- **Action:** Wait for pullback or avoid
**Example 3 - Accumulation Phase:**
Price ranges sideways but:
- Daily volume gradually increasing
- Weekly volume above average
- **Interpretation:** Smart money accumulating
- **Action:** Prepare for breakout in direction of volume
**Example 4 - Volume Divergence:**
Price makes new high:
- Current high has lower volume than previous high across all timeframes
- **Interpretation:** Weakening momentum
- **Action:** Consider profit-taking or reversal trade
## Configuration Parameters
### Timeframe Settings
- **HTF 1-6:** Select timeframes (must be higher than chart timeframe)
- **Max Display:** Number of candles to show per timeframe (1-50)
- **Limit to Next HTFs:** Display only first N enabled timeframes (1-6)
### Styling
- **Bull/Bear Colors:** Separate colors for body, border, and wick
- **Padding from current candles:** Distance offset from live price action
- **Space between candles:** Gap between individual volume bars
- **Space between Higher Timeframes:** Gap between different timeframe groups
- **Candle Width:** Thickness of volume bars (1-4, multiplied by 2)
### Volume Settings
- **Volume Scale Method:** Choose 1, 2, or 3
- 1 = Auto Scale per HTF (each TF independent)
- 2 = Global Auto Scale (all TF unified)
- 3 = Manual Scale (user-defined max)
- **Auto Scale Volume:** Enable/disable automatic scaling
- **Manual Scale Max Volume:** Set maximum when using Method 3
### Label Settings
- **HTF Label:** Show/hide timeframe names with color and size options
- **Label Positions:** Display at Top, Bottom, or Both
- **Label Alignment:** Align centered or Follow Candles
- **Remaining Time:** Show countdown timer until next HTF candle
- **Interval Value:** Display day-of-week or time on each candle
### Custom Daily Candle
- **Enable Custom Daily:** Override default daily candle timing
- **Open Time Options:**
- **Midnight:** Standard 00:00 ET daily open
- **8:30 AM:** Align with economic data releases
- **9:30 AM:** Align with NYSE market open
- Useful for specific trading strategies or market alignment
### Advanced Settings
- **Fix gaps in non-trading hours:** Maintains alignment during extended hours and weekends (recommended: ON)
- Prevents visual gaps during forex weekend closures
- Ensures consistent display during crypto 24/7 trading
- Improves backtesting reliability
## Best Practices
1. **Pair with Price Action:** Use alongside HTF price candles indicator for complete picture
2. **Start Simple:** Enable 2-3 timeframes initially (e.g., 15m, 1H, 4H), add more as needed
3. **Match Settings:** Use same candle width/spacing as companion price indicator for visual alignment
4. **Scale Appropriately:**
- Use **Global scale** (Method 2) when comparing timeframes
- Use **Per-HTF scale** (Method 1) for pattern analysis within each timeframe
- Use **Manual scale** (Method 3) for consistent day-to-day comparison
5. **Watch for Volume Clusters:** High volume appearing simultaneously across multiple HTFs signals significant market events
6. **Confirm Breakouts:** Always check if volume supports the price movement across higher timeframes
7. **Extended Hours:** Keep "Fix gaps" enabled for 24/7 markets (Forex, Crypto) and weekend analysis
## Technical Notes
- **Timezone:** All calculations use America/New_York timezone for consistency
- **Real-time Updates:** Volume and timers update on each tick during market hours
- **Performance:** Optimized with max_bars_back=5000 for extensive historical analysis
- **Compatibility:** Works on all instruments with volume data (Stocks, Forex, Crypto, Futures)
- **Gap Handling:** Uses `barmerge.gaps_off` to fill data gaps during non-trading periods
- **Backtesting:** Uses `lookahead=barmerge.lookahead_on` for stable historical data without repainting
- **Data Continuity:** Automatically handles market closures, weekends, and extended hours
## Updates & Improvements
**Version 2.0 (Current):**
- ✅ Fixed alignment issues during extended hours and weekends
- ✅ Eliminated repainting in backtesting
- ✅ Added gap-filling technology for continuous display
- ✅ Improved data synchronization across all timeframes
- ✅ Enhanced NA value handling for data integrity
- ✅ Added advanced settings group for user control
## Support
For questions, suggestions, or feedback, please comment on the publication or message the author.
---
**Disclaimer:** This indicator is for educational and informational purposes only. It does not constitute financial advice. Past performance is not indicative of future results. Always perform your own analysis and implement proper risk management before making trading decisions.

VOLUME Full [Titans_Invest]VOLUME Full
Designed for traders who want to take volume analysis to the next level.
This version delivers deeper insight into volume activity, integrating multiple customizable filters to highlight key buying and selling pressure. It's a comprehensive solution for volume-based decision-making.
⯁ WHAT IS THE VOLUME❓
The Volume indicator is a fundamental technical analysis tool that measures the number of shares or contracts traded in a security or market during a given period. It helps traders and investors understand the strength or weakness of a price movement, confirm trends, and predict potential reversals. Volume is typically displayed as a histogram below a price chart, with each bar representing the volume traded during a specific time interval.
⯁ HOW TO USE THE VOLUME❓
The Volume indicator can be used in several ways to enhance trading decisions:
• Trend Confirmation: High volume during a price move confirms the strength of that trend, while low volume can indicate a weak or unsustainable trend.
• Breakouts: A price breakout from a pattern or range accompanied by high volume is more likely to be valid and sustainable.
• Divergence: When the price moves in one direction and volume moves in the opposite direction, it can signal a potential reversal.
• Overbought/Oversold Conditions: Extreme volume levels can sometimes indicate that an asset is overbought or oversold, though this is less straightforward than with oscillators like the RSI.
⯁ ENTRY CONDITIONS
The conditions below are fully flexible and allow for complete customization of the signal.
______________________________________________________
🔹 CONDITIONS TO BUY 📈
______________________________________________________
▪︎ Signal Validity: The signal will remain valid for X bars .
▪︎ Signal Sequence: Configurable as AND or OR .
🔹 volume Positive
🔹 volume Negative
🔹 volume > volume
🔹 volume < volume
🔹 volume > volume_MA
🔹 volume > volume_MA * Trigger Signal (close > open)
🔹 volume > volume_MA * Trigger Signal (Keep State P)
🔹 volume > volume_MA * Trigger Signal (close < open)
🔹 volume > volume_MA * Trigger Signal (Keep State N)
______________________________________________________
______________________________________________________
🔸 CONDITIONS TO SELL 📉
______________________________________________________
▪︎ Signal Validity: The signal will remain valid for X bars .
▪︎ Signal Sequence: Configurable as AND or OR .
🔸 volume Positive
🔸 volume Negative
🔸 volume > volume
🔸 volume < volume
🔸 volume > volume_MA
🔸 volume > volume_MA * Trigger Signal (close > open)
🔸 volume > volume_MA * Trigger Signal (Keep State P)
🔸 volume > volume_MA * Trigger Signal (close < open)
🔸 volume > volume_MA * Trigger Signal (Keep State N)
______________________________________________________
______________________________________________________
🤖 AUTOMATION 🤖
• You can automate the BUY and SELL signals of this indicator.
______________________________________________________
______________________________________________________
⯁ UNIQUE FEATURES
______________________________________________________
Signal Validity: The signal will remain valid for X bars
Signal Sequence: Configurable as AND/OR
Condition Table: BUY/SELL
Condition Labels: BUY/SELL
Plot Labels in the Graph Above: BUY/SELL
Displays Positive & Negative Volume.
Automate and Monitor Signals/Alerts: BUY/SELL
Signal Validity: The signal will remain valid for X bars
Signal Sequence: Configurable as AND/OR
Table of Conditions: BUY/SELL
Conditions Label: BUY/SELL
Plot Labels in the graph above: BUY/SELL
Displays Positive & Negative Volume.
Automate & Monitor Signals/Alerts: BUY/SELL
______________________________________________________
📜 SCRIPT : VOLUME Full
🎴 Art by : @Titans_Invest & @DiFlip
👨💻 Dev by : @Titans_Invest & @DiFlip
🎑 Titans Invest — The Wizards Without Gloves 🧤
✨ Enjoy!
______________________________________________________
o Mission 🗺
• Inspire Traders to manifest Magic in the Market.
o Vision 𐓏
• To elevate collective Energy 𐓷𐓏

ORB + Volume FilterI created this for testing purposes only. If this script works as expected I will add a better description.

Trading Activity Index (Zeiierman)█ Overview
Trading Activity Index (Zeiierman) is a volume-based market activity meter that transforms dollar-volume into a smooth, normalized “activity index.”
It highlights when market participation is unusually low or high with a dynamic color gradient:
Light Blue → Low Activity (thin participation, low liquidity conditions)
Red/Orange → High Activity (active markets, large trades flowing in)
Additional percentile bands (20/40/60/80%) give context, helping you see whether the current activity level is in the bottom quintile, mid-range, or near historical extremes.
█ How It Works
⚪ Dollar Volume Transformation
Each bar, dollar volume is computed:
float dlrVol = close * volume
float dlrVolAvg = ta.sma(dlrVol, len_form)
Dollar volume = price × volume, smoothed by a configurable SMA window.
The result is log-transformed, compressing large outliers for a more stable signal.
⚪ Rolling Percentiles & Ranking
The log-dollar-volume series is compared to its rolling history (len_hist bars):
float p20 = ta.percentile_linear_interpolation(vscale, len_hist, 20)
float p40 = ta.percentile_linear_interpolation(vscale, len_hist, 40)
float p60 = ta.percentile_linear_interpolation(vscale, len_hist, 60)
float p80 = ta.percentile_linear_interpolation(vscale, len_hist, 80)
A normalized rank (0–1) is produced to color the main Trading Activity line.
█ How to Use
⚪ Detect High-Impact Sessions
Quickly see if today’s session is active or quiet relative to its own history — great for filtering setups that need activity.
⚪ Spot Breakouts & Traps
Combine with price action:
High activity near breakouts = strong follow-through likely.
Low activity breakouts = vulnerable to fake-outs.
⚪ Market Regime Context
Percentile bands help you assess whether participation is building up, in the middle of the range, or drying out — valuable for timing mean-reversion trades.
Above 80th percentile (red/orange) → Market is highly active, breakout trades and trend strategies are favored.
Below 20th percentile (light blue) → Market is quiet; fade moves or wait for expansion.
Watch transitions from blue → orange as a signal of growing institutional participation.
█ Settings
Formation Window (bars) – Number of bars used to average dollar volume before log transform.
History Window (bars) – Lookback period for percentile calculations and rank normalization.
-----------------
Disclaimer
The content provided in my scripts, indicators, ideas, algorithms, and systems is for educational and informational purposes only. It does not constitute financial advice, investment recommendations, or a solicitation to buy or sell any financial instruments. I will not accept liability for any loss or damage, including without limitation any loss of profit, which may arise directly or indirectly from the use of or reliance on such information.
All investments involve risk, and the past performance of a security, industry, sector, market, financial product, trading strategy, backtest, or individual's trading does not guarantee future results or returns. Investors are fully responsible for any investment decisions they make. Such decisions should be based solely on an evaluation of their financial circumstances, investment objectives, risk tolerance, and liquidity needs.

Volume Stress Level V2Volume Stress Level V2, is designed to provide a nuanced view of "RECENT" trading volume by identifying different levels of volume stress relative to a smoothed average.
Key Features:
Dynamic Volume Stress Calculation: The indicator calculates volume stress based on a Simple Moving Average (SMA) of volume and its standard deviation. The length of the SMA and the multiplier for the standard deviation are fully customizable, allowing you to adapt the indicator to different market conditions and trading styles.
Visual Volume Zones: The script visually categorizes volume into distinct zones:
Low Volume Zone: Represented by a white background, indicating periods of lower-than-average trading activity.
Normal Volume Zone: Highlighted in blue, signifying typical trading volume.
Medium Volume Zone: Displayed in yellow, denoting a moderate increase in volume.
High Volume Zone: Shown in orange, indicating significant volume spikes.
Spike Volume Zone: Marked in black, representing extreme volume events.
Customizable Background: You have the option to enable or disable the colored background fill for these volume zones, providing flexibility in how you visualize the data.
Bar Coloring: The volume bars themselves are color-coded according to the identified volume stress level, offering an immediate visual cue on your chart.
Adjustable Parameters:
VSL Length: Controls the lookback period for the SMA and standard deviation calculations.
Multiplier: Adjusts the sensitivity of the standard deviation bands, thereby influencing the width of the volume zones.
How to Use:
This indicator can be valuable for identifying potential shifts in market sentiment, confirming breakouts, or spotting periods of accumulation and distribution. By observing the transitions between volume zones, traders can gain insights into the conviction behind price movements.
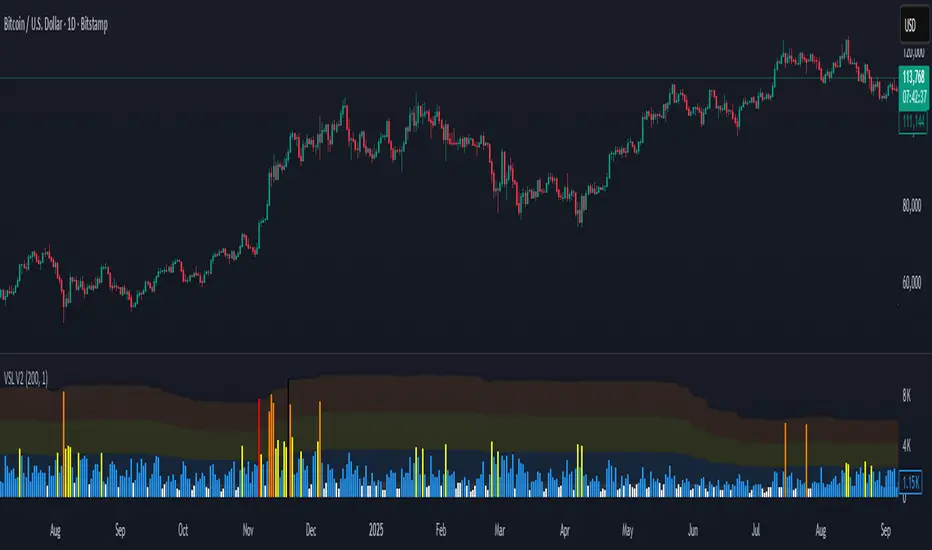
Volumetric Compressed MAVCMA (Volumetric Compressed Moving Average) uses the compressor and weighted standard deviation functions originally translated to pinescript by @gorx1 to plot moving averages in order to use for entry confirmation.
🔹 Concepts and Idea:
When we do music we always use different kinds of filters (low-pass, high pass, etc) for equalization and filtering itself. That stuff we use in finance as well. What we also always use in music are compressors, there dynamic processors that automatically adjust volume so it will be more consistent. Almost all the cool music you hear is compressed (both individual instruments (especially vocals) and the whole track afterwards), otherwise stuff will be too quite and too weak to flex on it, and also DJing it would be a nightmare.
🔹 Model:
I don't wanna explain it all in statistical / DSP way for once.
First of all, I think the population of volumes is log-normally distributed, so let's take logs of volumes, now we have a ~ normally distributed data. We take linearly weighted mean, add and subtract linearly weighted standard deviation from it, these would be our thresholds, the borders between different kinds of volumes explained before.
The upper threshold is for downward compression, that will not let volume pass it higher.
The lower threshold is for upward compression, all the volumes lower than this threshold will be brought up to the threshold's level.
Then we apply multipliers to the thresholds in order to adjust em and find the sweet spots. We do it the same way as in sound engineering when we don't aim for overcompression, we adjust the thresholds until they start to touch the signal and all good.
Afterwards, we delete all the number 1 and number 3 volume, leaving us exclusively with the clear main component, ready to be processed further.
We return the volumes to dem real scale.
For more info on Volume Compression it's highly advised to check @gorx1's initial script Volume Compressor
🔹 Settings:
MA Type: Moving average type to be used for comparison after calculating the compressed version of volume. This creates the second line after the compression line, so we can consider crossovers for confirmation entries.
Upward threshold: Upward threshold where the compression of volume is calculated. Increasing usually causes smoother lines.
Downward threshold: Downward threshold where the compression of volume is calculated. Decreasing usually causes smoother lines.
Compression Lookback: The Main lookback window of a volume that is used for compression. Increasing this would provide smoother lines but might cause delayed signals. Decreasing means more signals, but might cause whiplash and distorted signals.
Comparative Lookback: This is our lookback to be used with our ma type selection. There is no static better or worse lookback value for this indicator. It should be adjusted based on the pair.
🔹 Where to use:
This indicator should be used as another confirmation tool for your entry signals in your existing strategy/market following combination. Green dots (crossovers) mean bullish movement is expected, and red dots (crossbounders) mean bearish movement is expected. Automated crossover alerts are available. A reminder is that this kind of indicator should not be used on its own for trading, but rather should be used as a confirmation along with your trend detection and main entry indicators to provide additional confidence.
If you want to know under the hood, read the How it works section below.
🔹 How it works:
//This is our main compression calculation, which is used for the first line.
Compressed_out = compressor(volume, len_window, up_thresh, down_thresh)
//This is the secondary ratio calculation that we use for the second line.
Comp_ma = ma(ma_type, close * compressed_out, len_ml) / ma(ma_type, compressed_out, len_ml)
Vwma = ma(ma_type, close, len_window)
We calculate the ratio of the compressed volume and plot it against the base MA. Base MA's length is determined by the Compression Lookback input compared to the Comperative Lookback that is used for the compressed version. This provides us with another possible confirmation indicator that can be used to take advantage of volume ranges.
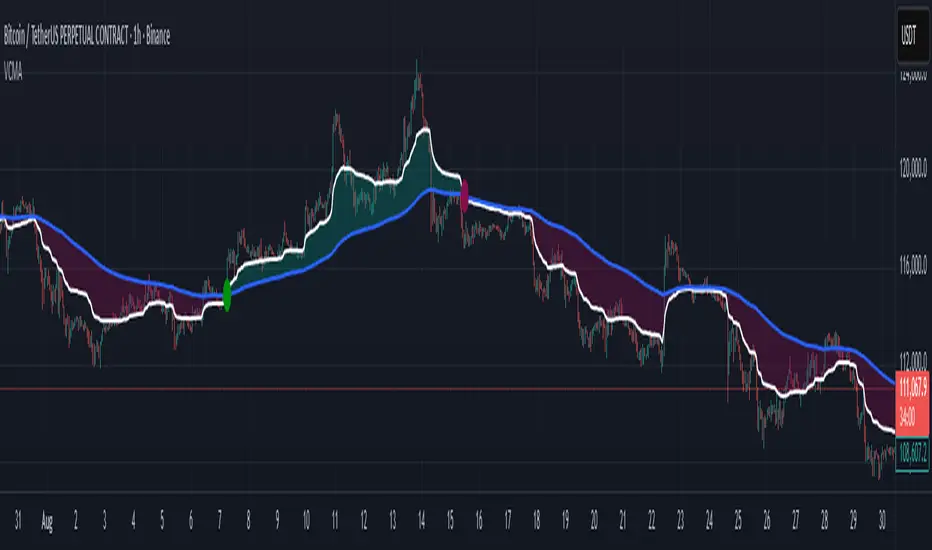
Volume by Time [LuxAlgo]The Volume by Time indicator collects volume data for every point in time over the day and displays the average volume of the specific dataset collected at each respective bar.
The indicator overlays the current volume and the historical average to allow for better comparisons.
🔶 USAGE
Throughout the day, the volume of every bar is stored in groups organized by the time when each bar occurred.
Over time, the datasets accumulate, and from that, we can simply determine the average value at each specific time of the day.
The display is a histogram style, which consists of hollow bars and solid filled columns.
-Hollow bars represent the average volume at that time of the day.
-Solid columns display the current volume from the current bar.
By default, the entire history of data is used, but if desired, the number of days under analysis can be specified to provide a more relevant point of view.
A readout of the number of days being analyzed can be seen in the status bar at any time.
Note: Due to partial sessions, it is typical to see this value change throughout the day; this is simply due to the fact that not every trading session has the exact same schedule 100% of the time.
The analysis type can also be specified; these can be either Average (Default) or Median.
Additionally, a Bi-directional can be toggled for a distinct difference between upwards volume and downwards volume.
🔶 SETTINGS
Analysis Type: Choose between Average or Median analysis modes.
Length (Days): Set the number of days to use for analysis. Set to 0 for full data (Default 0).
Bi-Directional Toggle: Toggle between one-sided or two-sided display.

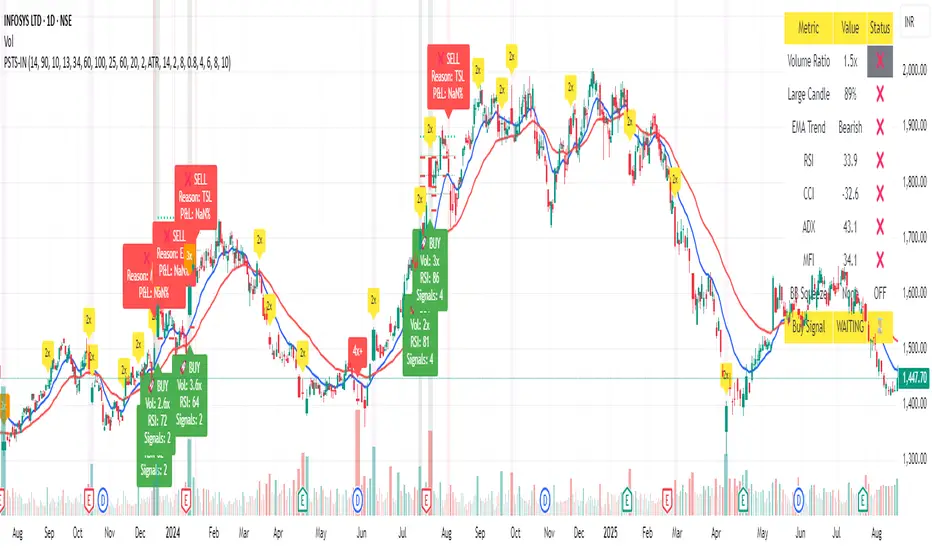
Moving Average Volume (20, 50)Shows two moving averages of volume, the 20 and 50 periods.
white bars in the background show volume, look for breaks of the target lines to confirm a breakout with volume
green shaded regions show how much higher the current volume is compared to historical volume
the greener the shade, the higher the multiple is (cap is 10x higher)
indicator is to be used with other breakout identifiers, or to help confirm the strength of a move out of an SAR level.
