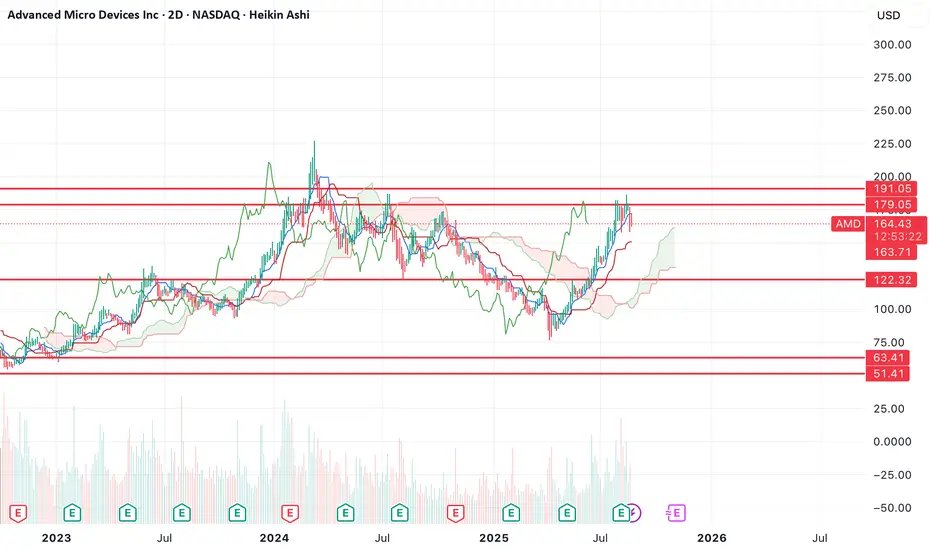
While many people are bullish AMD here, I don't think the chart looks that great. The recent rejection here sets up a double top and the possibility for us to go down and retest the lows again.
You can see using Heikin Ashi candles that bearish momentum has already started on the 2D timeframe. You'd need a very strong move higher from here to negate both the double top and the bearish momentum.
The only possibility for the bulls is to break above $191. However, bullish move that goes belows that level will most likely get sold lower.
If price does continue down from here, then I think the most likely outcome is that we test the bottom two supports on the chart before the bullish move starts.
Looking at the chart, it looks to me like the real bull run starts early 2026.
Ghi chú
Think there's a possibility of a retest of the resistances here, before falling further.Ghi chú
Sold my calls +3x. Not sure if we go higher, but I still favor lower over the long term.Thông báo miễn trừ trách nhiệm
Thông tin và các ấn phẩm này không nhằm mục đích, và không cấu thành, lời khuyên hoặc khuyến nghị về tài chính, đầu tư, giao dịch hay các loại khác do TradingView cung cấp hoặc xác nhận. Đọc thêm tại Điều khoản Sử dụng.
Thông báo miễn trừ trách nhiệm
Thông tin và các ấn phẩm này không nhằm mục đích, và không cấu thành, lời khuyên hoặc khuyến nghị về tài chính, đầu tư, giao dịch hay các loại khác do TradingView cung cấp hoặc xác nhận. Đọc thêm tại Điều khoản Sử dụng.