Let's start with the Daily View:

a) We can see 3 relevant horizontal levels. Those are the main areas we will be paying attention to. Now the price is above a resistance zone (working as support), and we will aim for a bullish movement towards the next resistance zone.
b) Another important item is a Huge Corrective Structure that has been broken (Bullish Signal)
Now we will go to the 1H chart:
a) We can see the clear breakout of the Daily corrective Structure ABC pattern.
b) The price now is above the resistance zone, supporting a small corrective pattern + the Ascending trendline supporting the corrective pattern.
c) Based on those items, we expect a continuation of the bullish movement towards the next resistance zone.
a) We can see 3 relevant horizontal levels. Those are the main areas we will be paying attention to. Now the price is above a resistance zone (working as support), and we will aim for a bullish movement towards the next resistance zone.
b) Another important item is a Huge Corrective Structure that has been broken (Bullish Signal)
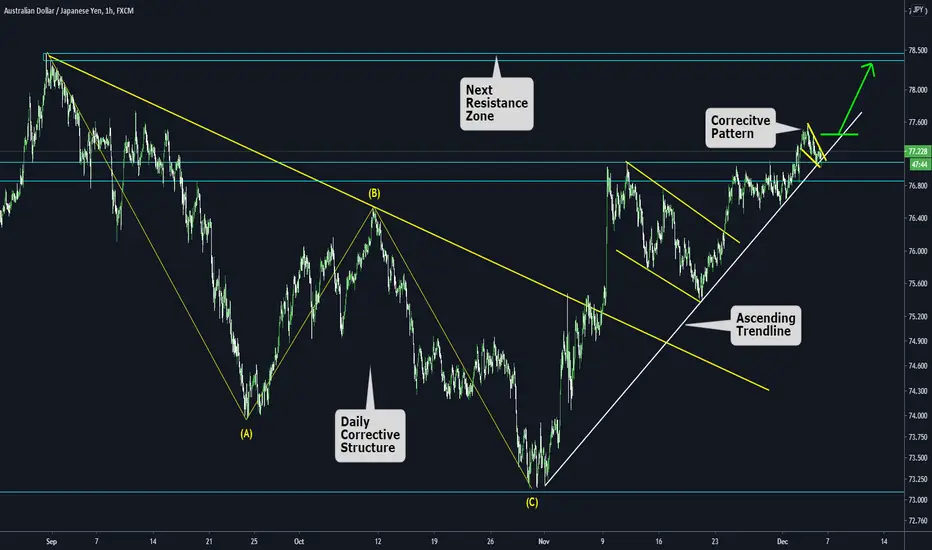
Now we will go to the 1H chart:
a) We can see the clear breakout of the Daily corrective Structure ABC pattern.
b) The price now is above the resistance zone, supporting a small corrective pattern + the Ascending trendline supporting the corrective pattern.
c) Based on those items, we expect a continuation of the bullish movement towards the next resistance zone.
Thông báo miễn trừ trách nhiệm
Thông tin và các ấn phẩm này không nhằm mục đích, và không cấu thành, lời khuyên hoặc khuyến nghị về tài chính, đầu tư, giao dịch hay các loại khác do TradingView cung cấp hoặc xác nhận. Đọc thêm tại Điều khoản Sử dụng.
Thông báo miễn trừ trách nhiệm
Thông tin và các ấn phẩm này không nhằm mục đích, và không cấu thành, lời khuyên hoặc khuyến nghị về tài chính, đầu tư, giao dịch hay các loại khác do TradingView cung cấp hoặc xác nhận. Đọc thêm tại Điều khoản Sử dụng.