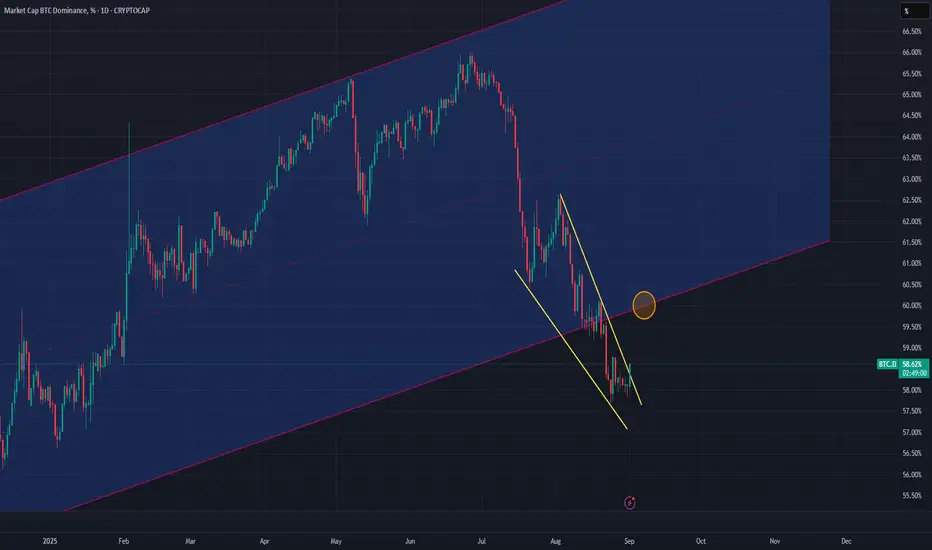
BTC Dominance (BTC.D) chart broke out of a long term parallel channel in late Aug 2025. Chart was forming a wedge pattern which has now broke out towards upside.
Chart is expected to retrace up to bottom trendline of the parallel channel (from where it initial broke out) around 60%.
This in turns means that we should expect some bearish price movements across all alt coins.
Once BTC.D chart hits 60%, it will continue its downward trend.
Chart is expected to retrace up to bottom trendline of the parallel channel (from where it initial broke out) around 60%.
This in turns means that we should expect some bearish price movements across all alt coins.
Once BTC.D chart hits 60%, it will continue its downward trend.
Thông báo miễn trừ trách nhiệm
Thông tin và ấn phẩm không có nghĩa là và không cấu thành, tài chính, đầu tư, kinh doanh, hoặc các loại lời khuyên hoặc khuyến nghị khác được cung cấp hoặc xác nhận bởi TradingView. Đọc thêm trong Điều khoản sử dụng.
Thông báo miễn trừ trách nhiệm
Thông tin và ấn phẩm không có nghĩa là và không cấu thành, tài chính, đầu tư, kinh doanh, hoặc các loại lời khuyên hoặc khuyến nghị khác được cung cấp hoặc xác nhận bởi TradingView. Đọc thêm trong Điều khoản sử dụng.