Chart pattern land mine on DXY . Play the levels, standing firm on my previous analysis. Posted as link below. Playing the levels and patterns as always, not attempting to predict the future. 97.5 bottom Range to 105 top of the range.
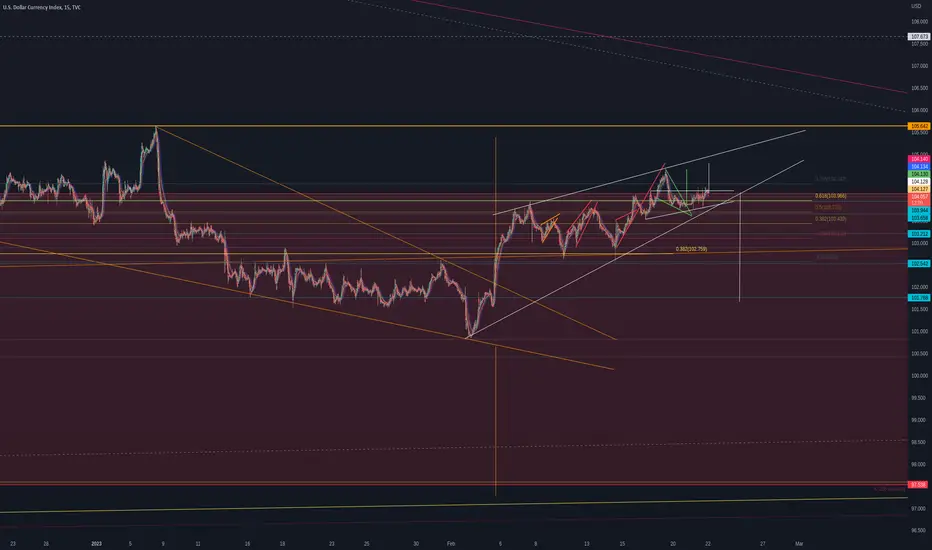
Update: Possible rising wedge forming to mid channel. Middle between 95 and 105 at approximately 100, the bottom of the current Thurs 02 Feb 08:00 low.
Update: Possible rising wedge forming to mid channel. Middle between 95 and 105 at approximately 100, the bottom of the current Thurs 02 Feb 08:00 low.
Ghi chú
This is crazy! There are so many awesome chart patterns. One big one is the rising wedge. DXY testing and currently retest. 0.236 bounce?! Come on! F&**^me what confluence the bounce to know that this area has significance. I love this analysis! If I dont say so myself!Ghi chú
The affect on BTC is massive as wellGhi chú
Losing 104.100 Fib 0.236 level for me for downside and heavier action. Although having said that. I am not sure, have to work on my intelligence on what the DXY actually is. I.e. where the money flow is. But fib wise at least, my analysis.Bài đăng liên quan
Thông báo miễn trừ trách nhiệm
Thông tin và ấn phẩm không có nghĩa là và không cấu thành, tài chính, đầu tư, kinh doanh, hoặc các loại lời khuyên hoặc khuyến nghị khác được cung cấp hoặc xác nhận bởi TradingView. Đọc thêm trong Điều khoản sử dụng.
Bài đăng liên quan
Thông báo miễn trừ trách nhiệm
Thông tin và ấn phẩm không có nghĩa là và không cấu thành, tài chính, đầu tư, kinh doanh, hoặc các loại lời khuyên hoặc khuyến nghị khác được cung cấp hoặc xác nhận bởi TradingView. Đọc thêm trong Điều khoản sử dụng.