1. Price Structure
Previous trend: Gold has been in a strong uptrend since late August, consistently forming higher highs and higher lows.
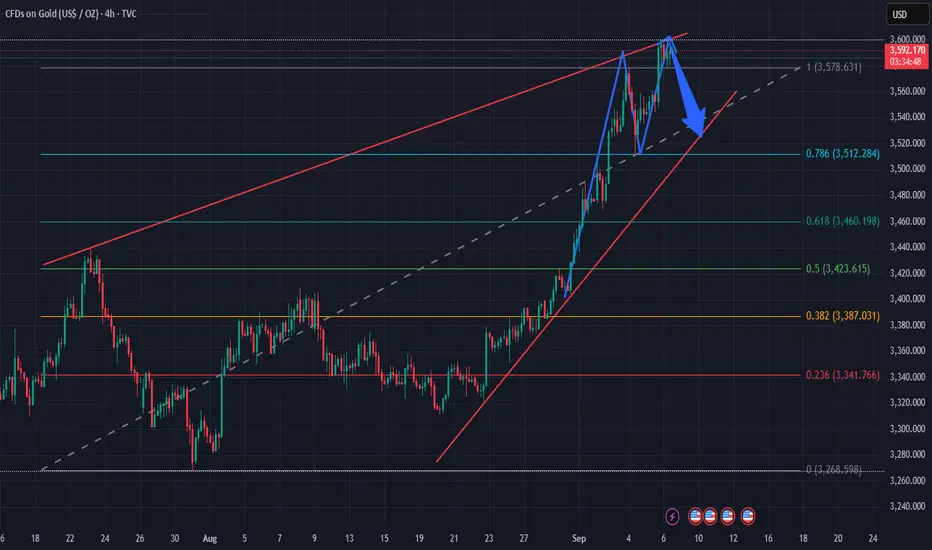
Currently, price has reached the upper channel resistance (red trendline) and is showing a small double-top pattern, signaling potential weakness.
2. Fibonacci & Support Levels
Fibonacci retracement drawn from 3,268 → 3,590.
Key levels:
0.786 = 3,510 (aligned with lower trendline → strong support).
0.618 = 3,460 → medium-term support.
0.382 = 3,380 → if broken, short-term bullish structure weakens.
3. Patterns & Technical Signals
The chart indicates a blue arrow: expectation of a pullback from 3,590 toward around 3,520 (grey trendline + 0.786 Fibo).
If price holds above 3,510 → potential rebound to continue the uptrend.
If 3,510 breaks → deeper correction likely toward 3,460 – 3,420.
4. Trading Scenarios
Scenario 1 (preferred):
Short-term sell from 3,590 → 3,520.
TP: 3,520 – 3,510, SL above 3,600.
Scenario 2:
If 3,510 – 3,520 holds strong → consider long entries in line with the main trend.
TP: 3,590 → 3,620, SL below 3,490.
👉 Summary: Gold is showing short-term weakness after a sharp rally, likely to correct toward 3,510 – 3,520 before the next move becomes clearer.
Previous trend: Gold has been in a strong uptrend since late August, consistently forming higher highs and higher lows.
Currently, price has reached the upper channel resistance (red trendline) and is showing a small double-top pattern, signaling potential weakness.
2. Fibonacci & Support Levels
Fibonacci retracement drawn from 3,268 → 3,590.
Key levels:
0.786 = 3,510 (aligned with lower trendline → strong support).
0.618 = 3,460 → medium-term support.
0.382 = 3,380 → if broken, short-term bullish structure weakens.
3. Patterns & Technical Signals
The chart indicates a blue arrow: expectation of a pullback from 3,590 toward around 3,520 (grey trendline + 0.786 Fibo).
If price holds above 3,510 → potential rebound to continue the uptrend.
If 3,510 breaks → deeper correction likely toward 3,460 – 3,420.
4. Trading Scenarios
Scenario 1 (preferred):
Short-term sell from 3,590 → 3,520.
TP: 3,520 – 3,510, SL above 3,600.
Scenario 2:
If 3,510 – 3,520 holds strong → consider long entries in line with the main trend.
TP: 3,590 → 3,620, SL below 3,490.
👉 Summary: Gold is showing short-term weakness after a sharp rally, likely to correct toward 3,510 – 3,520 before the next move becomes clearer.
✅MY FREE FOREX & XAUUSD SIGNALS TELEGRAM CHANNEL:
t.me/+xkPoUfOB8BsyMzRl
🔴9-12 signals per day
🔴Free knowledge support
🔴24/7 support for newbies.
🔴You always have priority.
FXWARRIOR 😘
t.me/+xkPoUfOB8BsyMzRl
🔴9-12 signals per day
🔴Free knowledge support
🔴24/7 support for newbies.
🔴You always have priority.
FXWARRIOR 😘
Bài đăng liên quan
Thông báo miễn trừ trách nhiệm
Thông tin và các ấn phẩm này không nhằm mục đích, và không cấu thành, lời khuyên hoặc khuyến nghị về tài chính, đầu tư, giao dịch hay các loại khác do TradingView cung cấp hoặc xác nhận. Đọc thêm tại Điều khoản Sử dụng.