### **Technical Analysis of HDFC Bank Ltd. (NSE)**
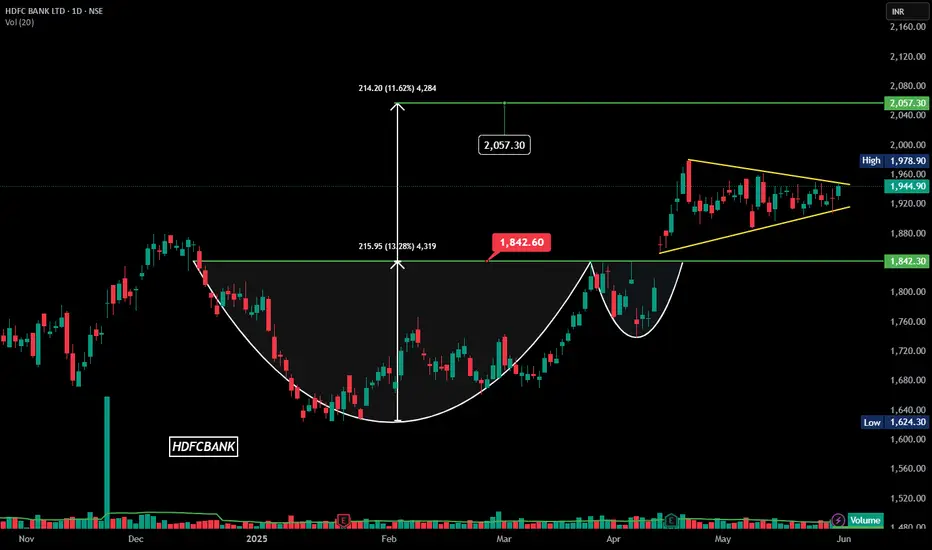
The **daily candlestick chart** of **HDFC Bank Ltd.** highlights key technical patterns, suggesting potential bullish momentum.
### **Key Observations:**
1. **Cup and Handle Formation:**
- A well-defined **cup and handle** pattern is visible, indicating prolonged accumulation.
- Breakout above **1,960.00 INR** confirms bullish sentiment.
- **Projected Target:** **2,057.30 INR**, a **11.62% upside** from breakout.
2. **Symmetrical Triangle Breakout:**
- Price action consolidating within a **symmetrical triangle**, leading to breakout confirmation.
- Strong move above **1,944.90 INR**, validating upward momentum.
3. **Volume & Price Action:**
- **Volume:** **14.37M** surpassing 20-day moving average of **10.13M**, confirming strength.
### **Support & Resistance Levels:**
- **Support:** **1,842.00 INR**, acting as a key cushion in case of pullbacks.
- **Resistance:** **2,057.30 INR**, aligning with the measured move projection.
Thông báo miễn trừ trách nhiệm
Thông tin và ấn phẩm không có nghĩa là và không cấu thành, tài chính, đầu tư, kinh doanh, hoặc các loại lời khuyên hoặc khuyến nghị khác được cung cấp hoặc xác nhận bởi TradingView. Đọc thêm trong Điều khoản sử dụng.
Thông báo miễn trừ trách nhiệm
Thông tin và ấn phẩm không có nghĩa là và không cấu thành, tài chính, đầu tư, kinh doanh, hoặc các loại lời khuyên hoặc khuyến nghị khác được cung cấp hoặc xác nhận bởi TradingView. Đọc thêm trong Điều khoản sử dụng.