📊 Current Snapshot
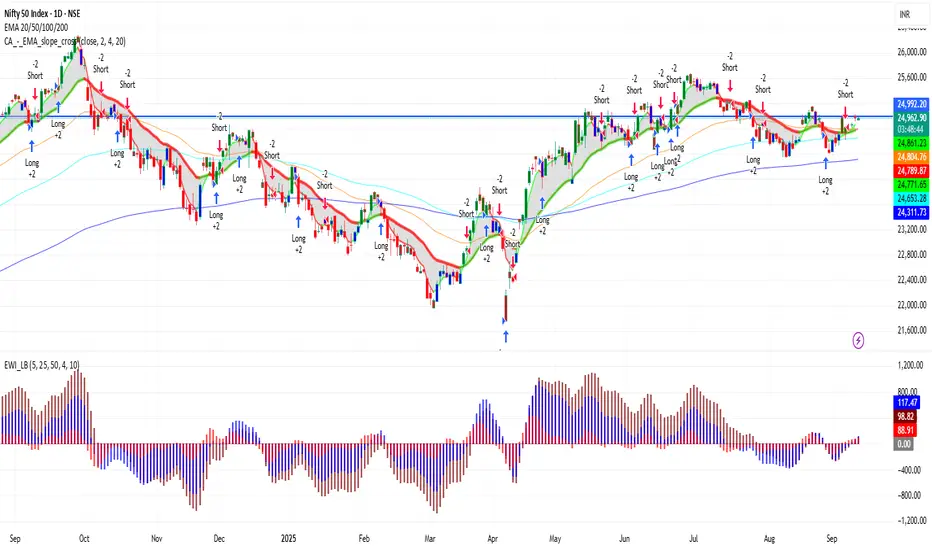
Current Price: ₹24,981
Previous Close: ₹24,960.15
Day’s Range: ₹24,915 – ₹25,035
52-Week Range: ₹21,743 – ₹26,277
Market Cap: Approx. ₹21.5 lakh crore
Volume: ~1.8 crore shares
🔑 Key Support & Resistance Levels
Immediate Support: ₹24,900
Next Support: ₹24,500
Immediate Resistance: ₹25,050
Next Resistance: ₹25,200
📈 Trend & Indicators
Trend: Neutral to mildly bullish; trading near 50-day and 200-day moving averages.
RSI (14): 65 – approaching overbought zone.
MACD: Positive, indicating bullish momentum.
Moving Averages: Short-term moving averages suggest neutral to slightly bullish outlook.
🔮 Outlook
Bullish Scenario: Break above ₹25,050 with strong volume could push Nifty toward ₹25,200.
Bearish Scenario: Drop below ₹24,900 may lead to further decline toward ₹24,500.
Neutral Scenario: Consolidation between ₹24,900 – ₹25,050; breakout needed for directional move.
📌 Key Factors to Watch
Broader market sentiment.
Economic indicators such as interest rates and inflation.
Global cues affecting investor confidence.
Bài đăng liên quan
Thông báo miễn trừ trách nhiệm
Thông tin và các ấn phẩm này không nhằm mục đích, và không cấu thành, lời khuyên hoặc khuyến nghị về tài chính, đầu tư, giao dịch hay các loại khác do TradingView cung cấp hoặc xác nhận. Đọc thêm tại Điều khoản Sử dụng.
Bài đăng liên quan
Thông báo miễn trừ trách nhiệm
Thông tin và các ấn phẩm này không nhằm mục đích, và không cấu thành, lời khuyên hoặc khuyến nghị về tài chính, đầu tư, giao dịch hay các loại khác do TradingView cung cấp hoặc xác nhận. Đọc thêm tại Điều khoản Sử dụng.