📈 Chart Structure Overview
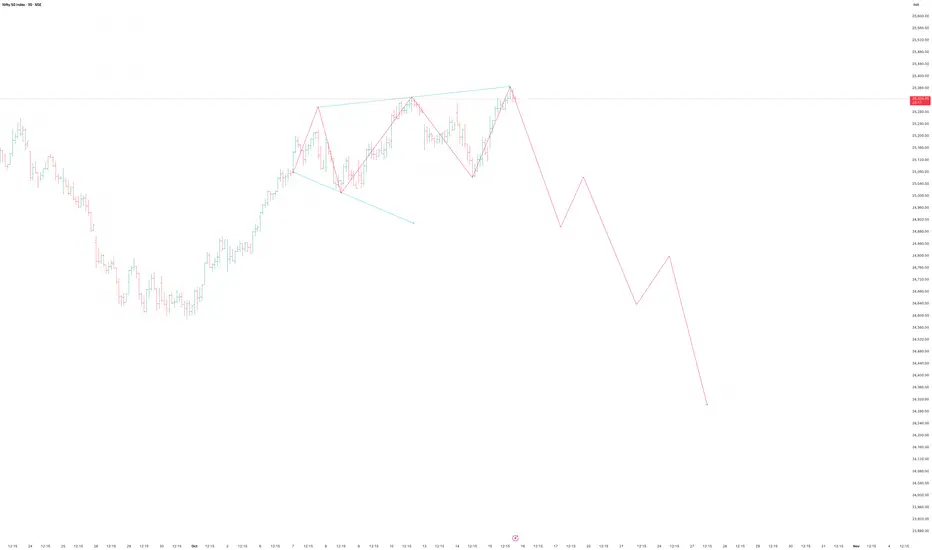
The chart clearly shows a rising wedge formation — a bearish reversal pattern typically appearing at the end of a bullish rally.
✅ Summary View
Aspect Observation
Pattern Rising Wedge (Bearish)
Bias Short-term corrective / bearish
Key Resistance 25,380–25,420
Key Breakdown Zone 25,120
Targets 24,900 → 24,700 → 24,400
Stop-loss (for short) 25,450
Conclusion
Nifty’s price action suggests distribution and exhaustion at the top.
A confirmed breakdown below 25,120 could open up a short-term correction of 500–700 points.
Stay cautious of false breakouts above 25,400 unless backed by strong volume.
Disclaimer:
This analysis is for educational and technical insight purposes only.
Trading decisions should be based on your own confirmation strategy, volume validation, and risk management.
Giao dịch đang hoạt động
Ghi chú
Fall from here is impulsive. Thông báo miễn trừ trách nhiệm
Thông tin và ấn phẩm không có nghĩa là và không cấu thành, tài chính, đầu tư, kinh doanh, hoặc các loại lời khuyên hoặc khuyến nghị khác được cung cấp hoặc xác nhận bởi TradingView. Đọc thêm trong Điều khoản sử dụng.
Thông báo miễn trừ trách nhiệm
Thông tin và ấn phẩm không có nghĩa là và không cấu thành, tài chính, đầu tư, kinh doanh, hoặc các loại lời khuyên hoặc khuyến nghị khác được cung cấp hoặc xác nhận bởi TradingView. Đọc thêm trong Điều khoản sử dụng.