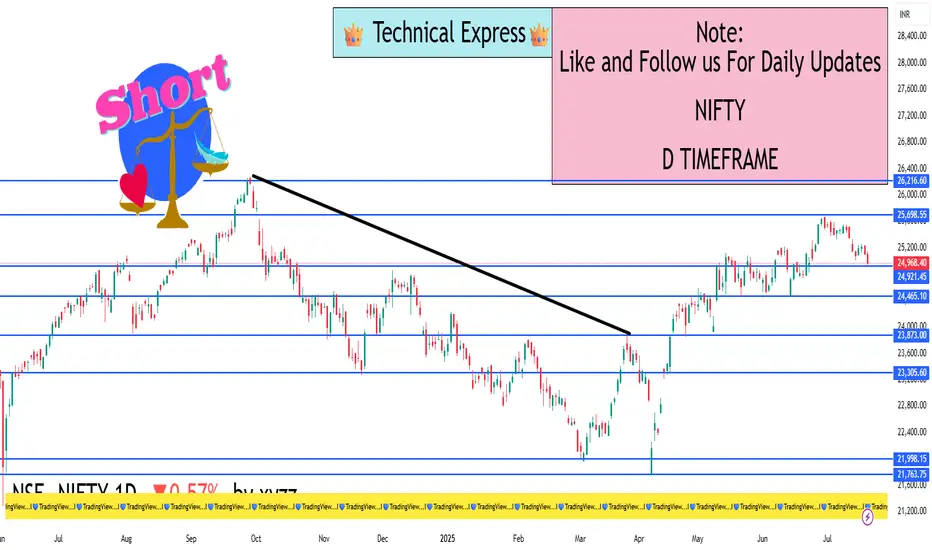
✅ Current Market Status:
Closing Price: ₹24,972.50
Change: –95.20 points
Percentage Change: –0.38%
Day’s Range: ₹24,905.60 – ₹25,095.10
52-Week Range: ₹19,638.30 – ₹25,194.60
🔍 Key Technical Levels:
📌 Support Zones:
Support 1: ₹24,900 – Intraday low and key psychological level
Support 2: ₹24,750 – Previous breakout zone
Support 3: ₹24,500 – Short-term trendline base
📌 Resistance Zones:
Resistance 1: ₹25,100 – Day’s high and minor barrier
Resistance 2: ₹25,200 – All-time high
Resistance 3: ₹25,500 – Next potential rally target if breakout succeeds
🕯️ Candlestick Pattern:
Recent Candle: Bearish candle after range-bound session
Price Action: Failed to sustain above ₹25,100
Implication: Weakness around highs, possible pullback toward support
📊 Market Structure Summary:
Nifty formed a double top near ₹25,200, indicating exhaustion
Currently testing ₹24,900 – if broken, next support is ₹24,750
A breakout will only be valid above ₹25,200 with strong volume
🧠 Institutional Behavior:
Likely profit booking near highs
No major signs of heavy accumulation
May re-enter above ₹25,200 or below ₹24,500 for value buying
🔚 Summary:
🔴 Short-Term Bias: Slightly Bearish
🟡 Watch Levels: ₹24,900 (support) and ₹25,200 (resistance)
✅ Buyers: Wait for breakout above ₹25,200
⚠️ Sellers: Watch for breakdown below ₹24,900 or ₹24,750
I built a Buy & Sell Signal Indicator with 85% accuracy.
📈 Get access via DM or
WhatsApp: wa.link/d997q0
Contact - +91 76782 40962
| Email: techncialexpress@gmail.com
| Script Coder | Trader | Investor | From India
📈 Get access via DM or
WhatsApp: wa.link/d997q0
Contact - +91 76782 40962
| Email: techncialexpress@gmail.com
| Script Coder | Trader | Investor | From India
Bài đăng liên quan
Thông báo miễn trừ trách nhiệm
Thông tin và các ấn phẩm này không nhằm mục đích, và không cấu thành, lời khuyên hoặc khuyến nghị về tài chính, đầu tư, giao dịch hay các loại khác do TradingView cung cấp hoặc xác nhận. Đọc thêm tại Điều khoản Sử dụng.