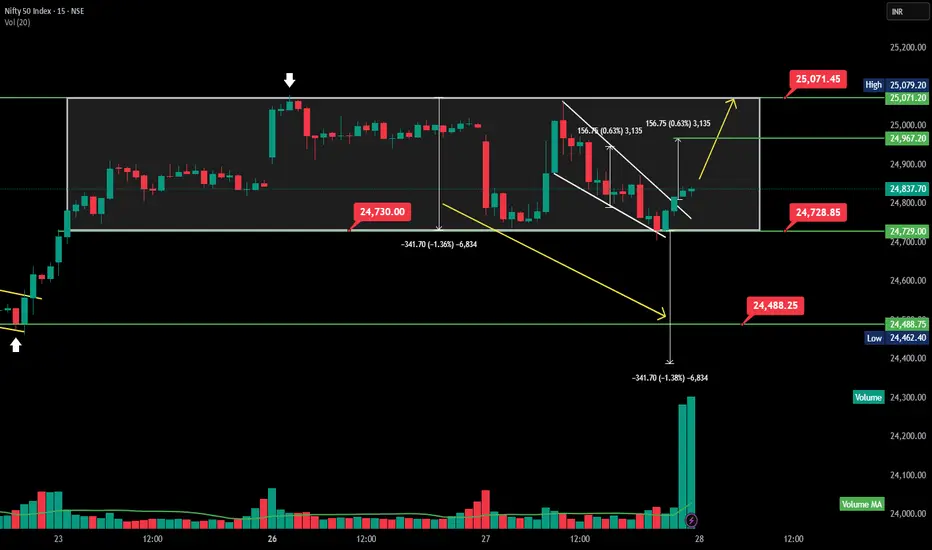
This is a **15-min intraday chart of Nifty 50 Index**, showing a **channel and retest**, followed by a potential **pullback setup** within a rectangle consolidation range.
---
### 📊 **Nifty 50 – Intraday Breakdown & Range Play Analysis**
#### 🔍 Chart Breakdown:
* **Range-bound Movement** between:
📌 Resistance: **25,071.45**
📌 Support: **24,730.00**
* **Breakdown from Rectangle:** Price fell sharply from range top to bottom, testing support at **24,730.00**.
* ** Flag Formation:** After the drop, price formed a flag pattern and gave break out for target - 24967.
* **Measured Move Target:**
Height of rectangle range = \~**342 pts**
📉 Breakdown target: **\~24,488**
📈 Rebound target (if breakout sustains) test top resistance: **\~25,071**
#### 🔄 **Scenario Outlook:**
* 🔼 **Bullish : can test 24,967 for move towards **25,071**
* 🔽 **Bearish below:** 24,728 — breakdown confirmation towards **24,488**
#### 📈 Volume Spike:
* Recent big green volume candle suggests accumulation or short covering.
---
Would you like a YouTube post setup for this intraday chart too?
---
### 📊 **Nifty 50 – Intraday Breakdown & Range Play Analysis**
#### 🔍 Chart Breakdown:
* **Range-bound Movement** between:
📌 Resistance: **25,071.45**
📌 Support: **24,730.00**
* **Breakdown from Rectangle:** Price fell sharply from range top to bottom, testing support at **24,730.00**.
* ** Flag Formation:** After the drop, price formed a flag pattern and gave break out for target - 24967.
* **Measured Move Target:**
Height of rectangle range = \~**342 pts**
📉 Breakdown target: **\~24,488**
📈 Rebound target (if breakout sustains) test top resistance: **\~25,071**
#### 🔄 **Scenario Outlook:**
* 🔼 **Bullish : can test 24,967 for move towards **25,071**
* 🔽 **Bearish below:** 24,728 — breakdown confirmation towards **24,488**
#### 📈 Volume Spike:
* Recent big green volume candle suggests accumulation or short covering.
---
Would you like a YouTube post setup for this intraday chart too?
Thông báo miễn trừ trách nhiệm
Thông tin và các ấn phẩm này không nhằm mục đích, và không cấu thành, lời khuyên hoặc khuyến nghị về tài chính, đầu tư, giao dịch hay các loại khác do TradingView cung cấp hoặc xác nhận. Đọc thêm tại Điều khoản Sử dụng.
Thông báo miễn trừ trách nhiệm
Thông tin và các ấn phẩm này không nhằm mục đích, và không cấu thành, lời khuyên hoặc khuyến nghị về tài chính, đầu tư, giao dịch hay các loại khác do TradingView cung cấp hoặc xác nhận. Đọc thêm tại Điều khoản Sử dụng.