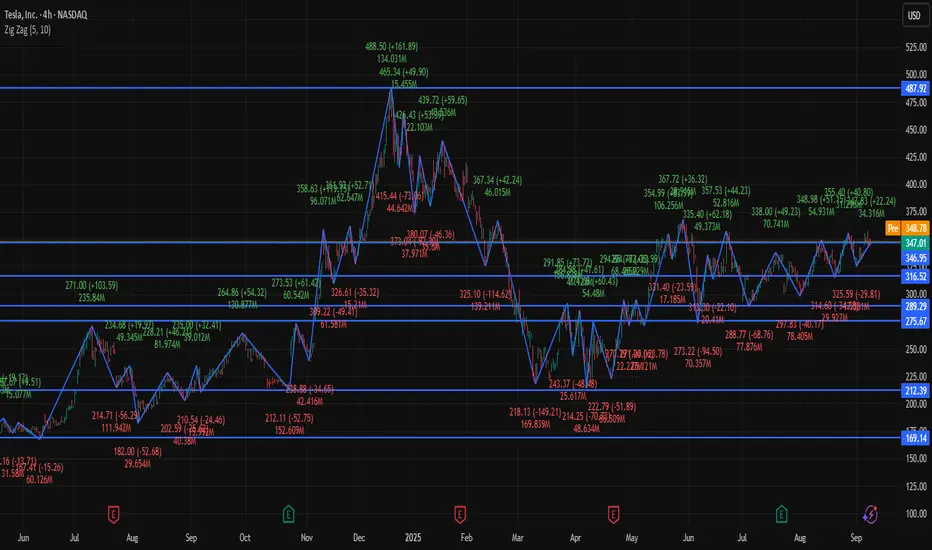
📊 Tesla (TSLA) Snapshot
Current Price: ~$346.97
Recent Range: ~$325 – $358
Intraday Change: Small gain (~+0.2%)
🔎 Key Levels (4H Focus)
Resistance: ~$347 – $351 (immediate ceiling)
Support: ~$325 – $330 (key downside buffer)
📉 Technical Indicators
RSI (14): ~57 → neutral with slight bullish bias
MACD: Positive → upward momentum
Moving Averages: Price trading above 20, 50, 200-period moving averages → bullish trend
Stochastics: Neutral → no overbought/oversold condition
📌 4-Hour Outlook
Bullish Scenario: Break above $347–348 could push price toward $358+.
Bearish Scenario: Drop below $330–332 could test support around $325.
Overall Bias: Moderately bullish; momentum positive but needs to clear resistance for acceleration.
✅ Conclusion: On the 4-hour chart, TSLA is in a moderate bullish phase, trading above key moving averages. The key battle zone is $347–351 for resistance, and $325–330 provides support in case of a pullback.
Thông báo miễn trừ trách nhiệm
Thông tin và ấn phẩm không có nghĩa là và không cấu thành, tài chính, đầu tư, kinh doanh, hoặc các loại lời khuyên hoặc khuyến nghị khác được cung cấp hoặc xác nhận bởi TradingView. Đọc thêm trong Điều khoản sử dụng.
Thông báo miễn trừ trách nhiệm
Thông tin và ấn phẩm không có nghĩa là và không cấu thành, tài chính, đầu tư, kinh doanh, hoặc các loại lời khuyên hoặc khuyến nghị khác được cung cấp hoặc xác nhận bởi TradingView. Đọc thêm trong Điều khoản sử dụng.