1. Price Structure
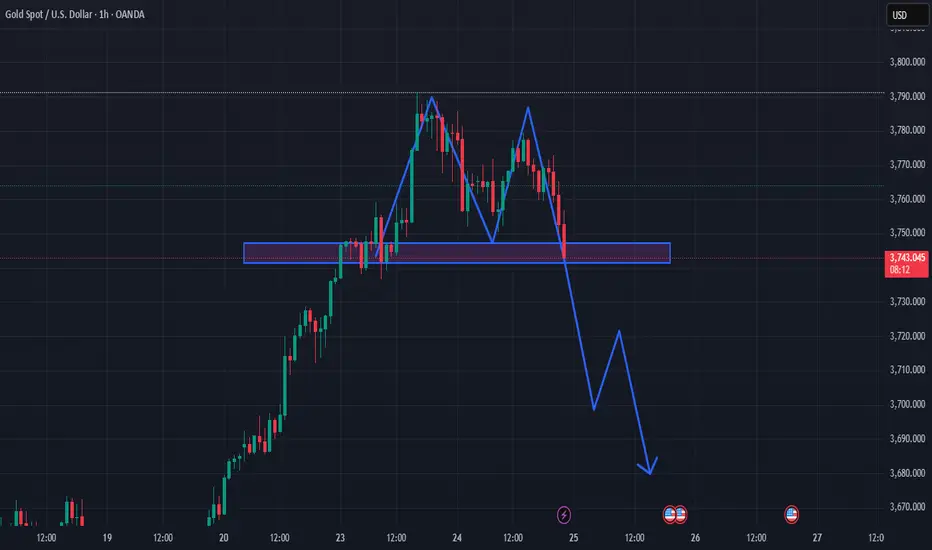
Previous trend: strong uptrend (from the 20th to the 23rd).
After reaching the ~3,790 peak: the market formed two lower highs → a sign of weakness.
The price is now retesting the key support zone around 3,740 – 3,750 (blue box).
2. Technical Pattern
This looks like a Double Top / variant of Head & Shoulders, signaling a bearish reversal.
The blue box area is the neckline – if broken, the pattern completes and the downtrend scenario has high probability.
3. Price Scenarios
If the 3,740 support breaks decisively:
Price may drop quickly towards 3,700 – 3,710 (nearest support).
Further down, it could retest the 3,670 – 3,680 area, as shown by your blue arrow.
If the 3,740 support holds:
Price could bounce back, forming a sideways consolidation before the next move.
However, the probability of a strong recovery is lower, as buying momentum has weakened.
4. Market Sentiment
Retail traders: likely to panic-sell once support breaks, triggering stop-loss cascades.
Big players / institutions: may take advantage around 3,700 to accumulate again after “stop-loss hunting” retailers.
👉 Conclusion: This is a short-term bearish scenario.
For existing long positions, consider taking profit / protecting capital if support breaks.
For dip buyers, it’s safer to wait for a positive reaction around 3,700 – 3,680.
✅MY FREE FOREX & XAUUSD SIGNALS TELEGRAM CHANNEL:
t.me/Jenny_in_your_area
🔴9-12 signals per day
🔴Free knowledge support
🔴24/7 support for newbies.
🔴You always have priority.
JENDA FISH 😘
t.me/Jenny_in_your_area
🔴9-12 signals per day
🔴Free knowledge support
🔴24/7 support for newbies.
🔴You always have priority.
JENDA FISH 😘
Bài đăng liên quan
Thông báo miễn trừ trách nhiệm
Thông tin và ấn phẩm không có nghĩa là và không cấu thành, tài chính, đầu tư, kinh doanh, hoặc các loại lời khuyên hoặc khuyến nghị khác được cung cấp hoặc xác nhận bởi TradingView. Đọc thêm trong Điều khoản sử dụng.