EURUSD H4Bối cảnh: EURUSD đang có xu hướng tăng
Setup: đợi giá nén phá qua mô hình nêm
Lưu ý: đợi giá đóng cửa confirm+ Voume tăng
Mẫu Biểu đồ

BTC H4Giá breakout qua Block
Đặt lệnh Buy limit
Entry: 117496.91
SL: 116205.14
TP: 121137.35
RR: 1:3


XAUUSD Mô hình sóng điều chỉnh chuẩn bị phá vỡTrên khung thời gian 1H, vàng (XAUUSD) đang di chuyển trong một kênh tăng giá hẹp, đồng thời hình thành mô hình sóng điều chỉnh dạng tam giác chéo (Ending Diagonal) rõ nét. Cấu trúc sóng hiện tại (ABCDE) cho thấy hành vi giá có sự tích lũy trước khi breakout khỏi vùng cản phía trên.
Phân tích chi tiết:
- Cấu trúc sóng Elliott:
Vàng đang hoàn tất một mô hình điều chỉnh phức tạp, cụ thể là sóng E vừa kết thúc, báo hiệu khả năng bước vào sóng đẩy mới (Impulse) hướng lên.
Sự xuất hiện của mô hình tam giác điều chỉnh (ABCDE) cuối sóng thường là tín hiệu chuẩn bị cho cú phá vỡ mạnh theo xu hướng chính.
- Trendline & kênh giá:
Cặp trendline song song giới hạn biên độ dao động tăng kể từ ngày 1/8 cho thấy cấu trúc giá vẫn đang duy trì xu hướng tăng.
Giá hiện tại (3,398 USD) đang tiệm cận cạnh trên của kênh tăng, nếu breakout thành công, mục tiêu gần nhất sẽ là vùng kháng cự 3,410 – 3,415.
- Fibonacci Retracement:
Sóng điều chỉnh trước đó đã phản ứng tốt quanh vùng 0.618 Fib (~3,360 USD), xác nhận đây là hỗ trợ quan trọng trong ngày.
Nếu giá điều chỉnh về vùng này, có thể cân nhắc buy the dip tại khu vực 3,360–3,365.
- Chỉ báo EMA và RSI:
EMA 50 đang nằm dưới giá, ủng hộ cho xu hướng tăng tiếp diễn.
RSI duy trì trên ngưỡng 50, chưa vào vùng quá mua, cho thấy động lực tăng vẫn còn dư địa mở rộng.
Các vùng kháng cự và hỗ trợ quan trọng hôm nay:
3,415 – 3,420: Kháng cự mạnh -Đỉnh sóng gần nhất, vùng chốt lời ngắn hạn
3,400 – 3,405: Kháng cự ngắn hạn -Cạnh trên kênh giá, vùng breakout quan sát
3,360 – 3,365: Hỗ trợ quan trọng
Vùng Fibonacci 0.618, cơ hội mua lại nếu điều chỉnh
3,330: Hỗ trợ sâu - Hợp lưu với hỗ trợ cứng H4
Chiến lược giao dịch gợi ý:
+ Chiến lược 1 – Buy breakout:
Mua khi giá phá vỡ rõ ràng vùng 3,405 với khối lượng tăng.
SL: dưới 3,390
TP1: 3,415 | TP2: 3,420+
+ Chiến lược 2 – Buy the dip:
Canh mua lại nếu giá điều chỉnh về vùng hỗ trợ 3,360–3,365.
SL: dưới 3,350
TP: quay lại vùng đỉnh kênh giá 3,405 – 3,415
- Lưu ý quản trị rủi ro: Giá đang tiệm cận vùng kháng cự, tránh FOMO tại đỉnh kênh – chỉ nên mua khi breakout thực sự hoặc chờ hồi về hỗ trợ

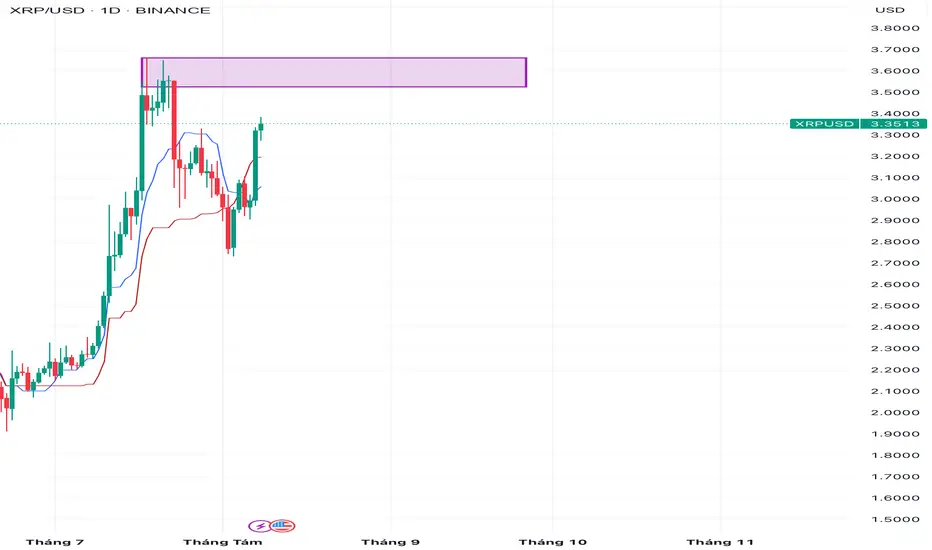
Dự đoán XRP từ 08/08/25.⭐️⭐️⭐️⭐️⭐️ Dự đoán XRP từ 08/08/25.
👉 Sell limit: 3.55-3.65
👉SL: 3.75
👉TP: 3.15-3.25
⭐️ Khuyến cáo: Dự đoán trên chỉ mang tính chất tham khảo.
Phân Tích EURUSD: Khung H1 Xuất Hiện ChoCh – Tín Hiệu Đảo Chiều Phân Tích EURUSD: Khung H1 Xuất Hiện ChoCh – Tín Hiệu Đảo Chiều Giảm
1. Tổng Quan Xu Hướng
Trên khung thời gian H1, EURUSD đã hình thành tín hiệu ChoCh (Change of Character) – dấu hiệu thay đổi cấu trúc từ tăng sang giảm. Sau khi hoàn tất nhịp tăng mạnh, giá không thể vượt qua vùng kháng cự và đã phá vỡ đáy quan trọng trước đó, xác nhận sự chuyển đổi xu hướng. Cấu trúc mới đang hướng tới mô hình Lower High – Lower Low.
2. Nhận Định Thị Trường
Kỹ thuật:
Sau giai đoạn tăng, EURUSD tạo đỉnh mới nhưng nhanh chóng bị từ chối bởi lực bán mạnh.
Cú phá vỡ đáy gần nhất trên H1 đã hoàn tất mô hình ChoCh, báo hiệu sự xuất hiện của xu hướng giảm.
Vùng vào lệnh Sell hợp lý nằm ngay tại khu vực giá retest sau khi phá đáy.
Mục tiêu giảm gần nhất: 1.15884 – tương ứng với đáy hỗ trợ gần nhất.
Vĩ mô:
USD đang có lực hỗ trợ từ việc lợi suất trái phiếu Mỹ duy trì cao.
Thị trường kỳ vọng Fed sẽ giữ lãi suất lâu hơn, tạo áp lực giảm lên EUR.
Kinh tế châu Âu chưa có dấu hiệu phục hồi mạnh, đồng EUR thiếu lực hỗ trợ.
3. Kịch Bản Tham Khảo
Kịch bản chính (ưu tiên):
Entry Sell: tại vùng giá hiện tại khi giá retest khu vực đã phá.
Stop Loss: trên 1.17059 (tránh nhiễu vùng kháng cự).
Take Profit: 1.15884.
Tỷ lệ R:R tiềm năng ~ 1:3.
Kịch bản phụ:
Nếu giá phá và giữ vững trên 1.17059, tín hiệu giảm sẽ bị vô hiệu → đóng lệnh Sell và chờ mô hình tăng mới.
4. Kết Luận
Cấu trúc giảm trên H1 của EURUSD với tín hiệu ChoCh rõ rệt đang tạo cơ hội giao dịch thuận xu hướng mới. Vùng retest hiện tại là điểm vào lệnh tiềm năng với tỷ lệ lợi nhuận/rủi ro hợp lý. Tuy nhiên, cần theo sát phản ứng giá tại vùng kháng cự để xác nhận lực bán duy trì trước khi kỳ vọng về vùng hỗ trợ 1.15884.
Zép lào: Ko 8 4 Chín. 4 Sáu 5. 8 Hai 8

Chiến Lược Giao Dịch (XAUUSD) Ngày 08/08/2025 Căng thẳng thương mại toàn cầu khi Tổng thống Trump áp thuế 10%-50% với hàng chục quốc gia và 100% với chip bán dẫn nhập khẩu.
Fed thiên về nới lỏng: Chủ tịch Fed Minneapolis Kashkari ủng hộ cắt giảm lãi suất, trong bối cảnh đơn xin trợ cấp thất nghiệp cao hơn dự báo và số liệu tiếp tục ở mức cao nhất 3 năm.
Mỹ áp thuế với vàng thỏi 1kg và 100 ounce nhằm giảm phụ thuộc nhập khẩu (đặc biệt từ Thụy Sĩ), có thể thắt chặt nguồn cung và đẩy giá tăng.
Chiến lược giao dịch XAUUSD xung quanh khu vực giá :
SELL XAUUSD quanh vùng 3410-3412
Stoploss : 3416
Take Profit 1 : 3405
Take Profit 2: 3400
Take Profit 3: 3395
Take Profit 4: 3390
BUY XAUUSD quanh vùng 3359-3361
Stoploss : 3355
Take Profit 1 : 3365
Take Profit 2: 3370
Take Profit 3: 3375
Take Profit 4: 3380
Lưu ý : Luôn luôn cài đặt Stoploss trong mọi trường hợp để được an toàn

Phân Tích BTC: Khung M30 Xuất Hiện ChoCh Phân Tích BTC: Khung M30 Xuất Hiện ChoCh – Phe Bán Trở Lại Kiểm Soát
1. Tổng Quan Xu Hướng
Trong các phân tích trước, chúng ta đã dự đoán đúng nhịp tăng của BTC. Tuy nhiên, ở phiên hôm nay, thị trường bắt đầu xuất hiện tín hiệu đảo chiều giảm trên khung M30 thông qua mô hình ChoCh (Change of Character). Đây là dấu hiệu cho thấy cấu trúc giá đã thay đổi từ xu hướng tăng sang xu hướng giảm, với việc phá vỡ đáy quan trọng và khả năng hình thành chuỗi Lower High – Lower Low mới.
2. Nhận Định Thị Trường
Kỹ thuật:
Sau nhịp tăng mạnh, BTC không thể phá vỡ đỉnh cũ, thay vào đó tạo các đỉnh thấp dần.
ChoCh M30 xuất hiện khi giá phá đáy ngắn hạn, xác nhận sự thay đổi cấu trúc.
Vùng cung 117,300 – 117,400 USDT hiện là khu vực kháng cự quan trọng, nơi khả năng cao sẽ xuất hiện lực bán mạnh khi giá hồi.
Mục tiêu giảm trước mắt là vùng 116,070 USDT, xa hơn có thể hướng về 115,630 USDT.
Vĩ mô & tâm lý thị trường:
Bitcoin chịu áp lực chốt lời khi các altcoin và thị trường chứng khoán Mỹ có dấu hiệu điều chỉnh.
Dòng tiền tạm thời rời khỏi crypto khi USD Index phục hồi và lợi suất trái phiếu Mỹ duy trì ở mức cao.
3. Kịch Bản Tham Khảo
Kịch bản chính (ưu tiên):
Entry Sell: khi giá hồi lên vùng 117,300 – 117,400 USDT.
Stop Loss: trên 117,820 USDT (vượt qua vùng cung).
Take Profit: mục tiêu ngắn 116,070 USDT; mục tiêu mở rộng 115,630 USDT.
Tỷ lệ R:R kỳ vọng cao nhờ vào cấu trúc giảm mới hình thành.
Kịch bản phụ:
Nếu BTC phá và giữ vững trên 117,820 USDT, tín hiệu giảm bị vô hiệu → dừng lệnh Sell và chờ tín hiệu mới.
4. Kết Luận
BTC đang bước vào giai đoạn điều chỉnh giảm sau khi xuất hiện ChoCh M30, cùng với áp lực từ vùng cung 117,300 – 117,400 USDT. Đây là cơ hội giao dịch Sell thuận xu hướng mới hình thành, với điểm vào, dừng lỗ và chốt lời rõ ràng, đảm bảo kỷ luật và quản lý rủi ro. Tuy nhiên, cần theo dõi chặt chẽ hành vi giá khi tiếp cận vùng entry để tránh rủi ro từ các cú false break.
Zép lào: Ko 8 4 Chín. 4 Sáu 5. 8 Hai 8

Phân Tích XAU/USD: Vàng Khung M30 Xuất Hiện ChoCh – Tín Hiệu ĐảoPhân Tích XAU/USD: Vàng Khung M30 Xuất Hiện ChoCh – Tín Hiệu Đảo Chiều Giảm Rõ Nét
1. Tổng Quan Xu Hướng
Trên khung thời gian M30, vàng đã chính thức xuất hiện ChoCh (Change of Character), báo hiệu sự thay đổi từ xu hướng tăng sang xu hướng giảm. Sau giai đoạn tăng mạnh trước đó, giá không thể tạo đỉnh cao mới, thay vào đó phá vỡ vùng đáy quan trọng, cho thấy lực mua đã suy yếu và phe bán bắt đầu chiếm ưu thế. Hiện tại, cấu trúc giá đang chuyển sang Lower High – Lower Low điển hình của một xu hướng giảm.
2. Nhận Định Thị Trường
Kỹ thuật:
Vùng cung kháng cự (màu đỏ) sau cú ChoCh, đóng vai trò là điểm phản ứng chính của thị trường.
Nến giảm dài xuất hiện sau khi chạm vùng cung cho thấy lực bán mạnh mẽ.
Hỗ trợ gần nhất nằm tại vùng 3,371 – đây là mục tiêu tiềm năng cho sóng giảm tiếp theo.
3. Kịch Bản Tham Khảo
Kịch bản chính (ưu tiên):
Entry Sell: 3,392 – 3,394.
Stop Loss: 3,404 (trên đỉnh vùng cung).
Take Profit: 3,371.
Tỷ lệ R:R ~ 1:2, phù hợp giao dịch theo xu hướng giảm mới hình thành.
Kịch bản phụ:
Nếu đóng nến giá phá vỡ và giữ trên 3,404, xu hướng giảm bị vô hiệu → đóng lệnh Sell, quan sát tín hiệu Buy mới.
Kịch bản phụ (quản trị rủi ro):
Nếu giá phá vỡ và đóng nến M30/M15 trên vùng cung, xu hướng giảm bị vô hiệu.
Khi đó, đóng lệnh Sell và quan sát cơ hội Buy nếu cấu trúc đảo chiều tăng được hình thành.
4. Kết Luận
Cấu trúc giá M30 với tín hiệu ChoCh rõ ràng, kết hợp yếu tố kỹ thuật đang ủng hộ cho kịch bản giảm về vùng 3,371. Đây là một lệnh theo xu hướng với điểm vào, dừng lỗ và mục tiêu rõ ràng, đảm bảo tính kỷ luật và quản lý rủi ro chặt chẽ. Tuy nhiên, thị trường luôn tiềm ẩn biến động bất ngờ, vì vậy cần bám sát hành vi giá và sẵn sàng điều chỉnh chiến lược khi cần thiết.
Zép lào: Ko 8 4 Chín. 4 Sáu 5. 8 Hai 8

Ý tưởng giao dịch VNM ( Công ty Cổ phần sữa Việt Nam )Dựa trên cấu trúc thị trường, giá hiện tại về vùng zone dưới. Có thể mua nắm giữ dài hạn tới các mức giá như hình 100k , 135k.

Plan XAUUSD ngày 07/08/2025Plan Vàng cho ngày hôm nay, anh em tham khảo nhé:
Vàng buy limit 3376-3374
Sl 3371
Tp 50pip++
Happy trading :)

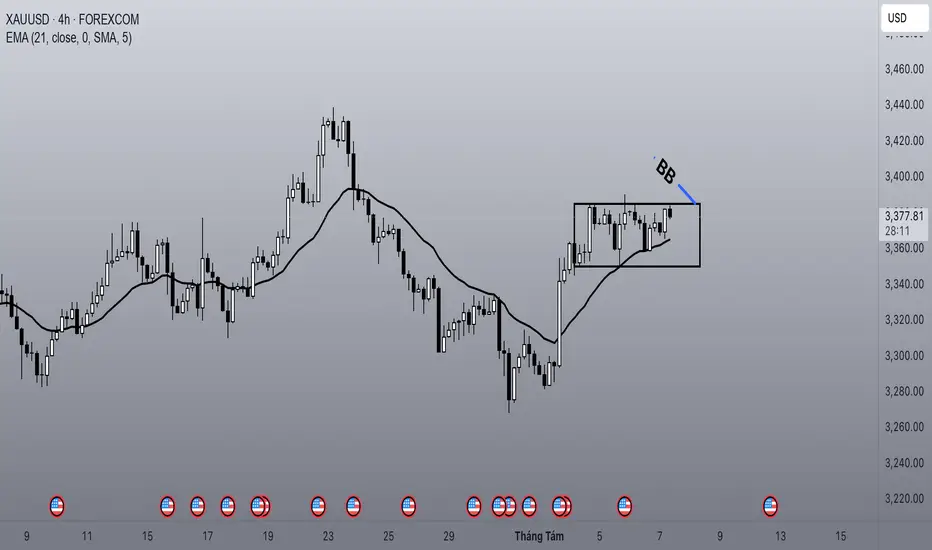
Phân tích Bob Volman khung H4| Kiên nhẫn, thực sự kiên nhẫn| 7/8#VÀNG
Giá đã chuyển sang uptrend và ta thấy sự tôn trọng của giá với ema, tạo thành 1 block. Setup BB được áp dụng ở đây là đúng bài.
#PALLADIUM XPDUSD
Kèo sell được kích hoạt và hiện tại đang có 1R lợi nhuận mở. SL đã được dời xuống đường vàng, giảm bớt 1 phần rủi ro. Chúng ta cùng chờ câu trả lời từ thị trường.
Chiến Lược Giao Dịch (XAUUSD) Ngày 07/08/2025Giá vàng tăng lên gần mức 3.380 USD/ounce vào thứ Năm, phục hồi lại mức giảm của phiên trước và giao dịch ở vùng cao nhất trong hai tuần, nhờ các đe dọa thuế quan mới từ Mỹ và kỳ vọng về chính sách tiền tệ ôn hòa, qua đó gia tăng sức hút của kim loại quý không sinh lãi suất.
Đồng thời, Tổng thống Trump dự kiến sẽ đề cử người kế nhiệm Thống đốc Fed Adriana Kugler vào cuối tuần này.
Ông cũng tiết lộ đang xem xét bốn ứng viên cuối cùng để thay thế Chủ tịch Fed Jerome Powell, làm dấy lên lo ngại mới về tính độc lập của ngân hàng trung ương.
Chiến lược giao dịch XAUUSD xung quanh khu vực giá
SELL XAUUSD quanh vùng 3390-3392
Stoploss : 3396
Take Profit 1 : 3386
Take Profit 2: 3381
Take Profit 3: 3376
Take Profit 4: 3370
BUY XAUUSD quanh vùng 3357-3359
Stoploss : 3353
Take Profit 1 : 3362
Take Profit 2: 3367
Take Profit 3: 3372
Take Profit 4: 3378
Lưu ý : Luôn luôn cài đặt Stoploss trong mọi trường hợp để được an toàn

Phân tích USD/JPY: H1 Giữ Vững Nhịp Hồi – Tiếp Tục Flow TrendPhân tích USD/JPY: H1 Giữ Vững Nhịp Hồi – Tiếp Tục Flow Trend Buy Lên Kháng Cự
Trong bài viết trước, mình đã nhận định đúng về điểm Buy chiến lược của USD/JPY, khi giá bật tăng từ vùng hỗ trợ hợp lưu. Hiện tại, thị trường đang đi đúng kịch bản, duy trì flow trend Buy, hướng tới các vùng kháng cự quan trọng trên khung H1.
1. Phân Tích Kỹ Thuật Hiện Tại
Quan sát USD/JPY trên H1:
Cấu trúc giá:
Sau cú giảm mạnh từ 148,700, giá tạo đáy ngắn hạn quanh 146,900 – 147,000.
Pha hồi phục đã bắt đầu từ vùng này, trùng khớp với vùng hợp lưu hỗ trợ + Fibo hồi.
Entry Buy Trước Đó:
Giá khớp entry tại 147,000, bật tăng theo kịch bản Buy ngắn hạn.
Hiện trạng:
Giá đang đi đúng hướng, chạm vùng 147,500 và duy trì nhịp tăng ổn định.
Xu hướng ngắn hạn vẫn ưu tiên Buy lên kháng cự 147,950 – 148,000.
2. Kịch Bản Và Chiến Lược Giao Dịch
Kịch bản chính – Tiếp tục Flow Buy
Entry Buy: Giữ lệnh từ 147,000 – 147,100.
Stop Loss: 146,800 (dưới vùng hỗ trợ hợp lưu).
Take Profit 1: 147,950 – 148,000 (kháng cự gần).
Take Profit 2: Chốt dần nếu breakout mạnh lên vùng 148,200.
Kịch bản phụ – Rủi ro giảm
Nếu giá thủng 146,800, xu hướng hồi phục bị vô hiệu, thị trường có thể quay lại test 146,400 – 146,200.
Khi đó, tạm dừng Buy và quan sát phản ứng giá ở hỗ trợ thấp hơn.
3. Kết Luận Và Định Hướng
USD/JPY vẫn đang vận động đúng kịch bản Buy đã dự báo trước đó.
Dòng tiền ngắn hạn ủng hộ xu hướng tăng, mục tiêu gần là 147,950 – 148,000.
Chiến lược hiện tại: Giữ Buy theo flow trend, trailing stop để bảo vệ lợi nhuận khi giá tiệm cận kháng cự.
Zép lào: Ko 8 4 Chín. 4 Sáu 5. 8 Hai 8

Phân tích Bitcoin (BTC): Khung 4H Giữ Vững Đà Hồi Phục Phân tích Bitcoin (BTC): Khung 4H Giữ Vững Đà Hồi Phục – Tiếp Tục Flow Trend Buy
Trong bài viết trước, mình đã nhận định xu hướng hồi phục của BTC sau tín hiệu CHoCH (Change of Character) và giá đã phản ứng đúng với dự báo khi bật tăng từ vùng hỗ trợ hợp lưu. Hiện tại, thị trường vẫn đang duy trì flow trend Buy, nhưng cũng bắt đầu xuất hiện nhịp điều chỉnh kỹ thuật ngắn hạn sau khi chạm kháng cự gần.
1. Phân Tích Kỹ Thuật Hiện Tại
Quan sát biểu đồ BTC khung 4H:
Cấu trúc xu hướng:
Sau cú rơi mạnh từ 118,000 USDT, BTC tạo đáy ngắn hạn quanh 112,000 USDT.
Sự xuất hiện của CHoCH trên 4H xác nhận sự chuyển đổi xu hướng từ giảm sang hồi phục ngắn hạn.
Vùng Entry Mua Trước Đó:
Giá khớp entry quanh 112,900 – 113,000 USDT, bật mạnh theo kịch bản Buy đã đề ra.
Hiện trạng:
Giá vừa có nhịp tăng nhanh về 115,700 USDT và đang điều chỉnh kỹ thuật nhẹ.
Xu hướng tổng thể vẫn nghiêng về Buy, với mục tiêu trung hạn là 116,700 USDT – vùng hợp lưu trendline giảm dài hạn.
2. Kịch Bản Và Chiến Lược Giao Dịch
Kịch bản chính – Tiếp tục Flow Buy
Chờ nhịp điều chỉnh ngắn về vùng hỗ trợ 113,950 – 114,100 USDT.
Buy Limit quanh hỗ trợ này để tối ưu vị thế.
Stop Loss: 113,000 USDT.
Take Profit 1: 115,700 USDT (kháng cự gần).
Take Profit 2: 116,700 USDT (hợp lưu trendline giảm dài hạn).
Kịch bản phụ – Rủi ro giảm
Nếu BTC phá thủng 112,900 USDT, xu hướng hồi phục bị vô hiệu, thị trường có thể quay về vùng 111,800 USDT.
Khi đó, tạm dừng Buy và chờ tín hiệu mới từ vùng hỗ trợ sâu hơn.
3. Kết Luận Và Định Hướng
BTC đang đi đúng kịch bản hồi phục, flow trend Buy vẫn còn hiệu lực.
Các lệnh Buy trước đó đang có lợi nhuận và có thể quản trị theo hướng trailing stop để bảo vệ thành quả.
Xu hướng ngắn hạn vẫn tích cực, nhưng vùng 116,700 USDT sẽ là thử thách quan trọng – nếu breakout thành công, xu hướng hồi phục có thể mở rộng sang vùng 118,000 USDT.
Zép lào: Ko 8 4 Chín. 4 Sáu 5. 8 Hai 8

Ý tưởng giao dịch XAUUSD 6.8.2025 21h00Ý tưởng giao dịch XAUUSD 6.8.2025 21h00
Bán quanh khu vực 337x
SL: 3395
TP: 3350

Ý tưởng giao dịch XAUUSD 06.08.2025 18h30Ý tưởng giao dịch XAUUSD 06.08.2025 18h30
Mua quanh khu vực 336x
SL: 3340
TP: 3400
TP2: 3430

Ý tưởng giao dịch XAUUSD 06.08.2025Ý tưởng giao dịch XAUUSD 06.08.2025
Bán quanh khu vực: 337x
SL: 3390
TP1: 3350
TP2: 3300

Phân tích USD/JPY- Khung H1 Thế Đánh QML, Cơ Hội Bắt Sóng HồiPhân tích USD/JPY- Khung H1 Thế Đánh QML, Cơ Hội Bắt Sóng Hồi
Trên khung H1, USD/JPY đang hình thành thế đánh QML (Quasimodo Level) – một trong những mô hình giá đáng tin cậy để săn điểm đảo chiều. Nhưng để tăng độ chính xác, trader cần kết hợp thêm bối cảnh vĩ mô và dòng tiền toàn cầu.
1️⃣ Cấu Trúc Kỹ Thuật – Thế QML Rõ Nét
Xu hướng trước đó: USD/JPY giảm mạnh, tạo các đỉnh – đáy thấp dần, thể hiện lực bán áp đảo.
Quasimodo hình thành:
Giá tạo đỉnh LH rồi phá xuống LL.
Sau đó, lực mua xuất hiện kéo giá vượt qua đỉnh LH, báo hiệu cấu trúc thị trường thay đổi.
Vùng vào lệnh: Giá hiện đang retest vùng QML (màu xanh lá trên biểu đồ).
Entry quanh 147.0 – 147.1
SL dưới 146.5
TP kỳ vọng về vùng 147.9 – 148.0, hợp lưu với đỉnh gần nhất.
2️⃣ Góc Nhìn Vĩ Mô
Chênh lệch lãi suất Mỹ – Nhật:
Fed vẫn duy trì mặt bằng lãi suất cao, trong khi BoJ (Ngân hàng Nhật) tiếp tục nới lỏng tiền tệ.
Điều này khiến dòng tiền ưu tiên nắm giữ USD hơn là JPY, tạo lực đỡ cho xu hướng hồi phục USD/JPY.
Tâm lý thị trường toàn cầu:
Thị trường chứng khoán Mỹ hồi phục, dòng tiền rủi ro tăng → áp lực trú ẩn vào JPY giảm.
Khi JPY mất vai trò phòng thủ, USD/JPY dễ bật tăng trở lại từ các vùng hỗ trợ kỹ thuật.
Dòng tiền carry trade:
Nhà đầu tư quốc tế tiếp tục vay JPY lãi suất thấp để mua USD và các tài sản lợi suất cao hơn → củng cố khả năng bật tăng từ vùng QML hiện tại.
3️⃣ Chiến Lược Giao Dịch
Buy quanh vùng QML 147.0 – 147.1
Stoploss: 146.5 (dưới đáy cũ, loại bỏ cú quét giả)
Take Profit: 147.9 – 148.0 (vùng kháng cự gần nhất)
R:R ~ 1:2, phù hợp cả swing ngắn hạn và scalping H1.
Lưu ý:
Nếu giá phá thủng 146.5 kèm volume mạnh → hủy kèo, đợi cấu trúc mới.
Kết hợp thêm tin tức kinh tế Mỹ – Nhật, đặc biệt là phát biểu từ Fed và BoJ, để xác nhận xu hướng vĩ mô.
⏳ Kết Luận:
USD/JPY đang hội tụ cả tín hiệu kỹ thuật QML và hỗ trợ vĩ mô cho một nhịp hồi phục. Đây là cơ hội cho trader bắt sóng ngắn hạn theo hướng Buy, nhưng vẫn phải tuân thủ kỷ luật cắt lỗ và quản lý vốn chặt chẽ.
Zép lào: Ko 8 4 Chín. 4 Sáu 5. 8 Hai 8

Dự đoán SOL từ 06/08/25.⭐️⭐️⭐️⭐️⭐️ Dự đoán SOL từ 06/08/25.
👉Buy limit: 145-155
👉SL: 140
👉TP: 170-180
⭐️ Khuyến cáo: Dự đoán trên chỉ mang tính chất tham khảo.

Chiến Lược Giao Dịch (XAUUSD) Ngày 06/08/2025Giá vàng giảm nhẹ xuống khoảng 3.375 USD/ounce vào thứ Tư, nhưng vẫn giữ được phần lớn mức tăng gần đây và duy trì quanh mức cao nhất trong hai tuần, nhờ kỳ vọng ngày càng tăng rằng chính sách tiền tệ sẽ trở nên ôn hòa hơn, từ đó hỗ trợ sức hấp dẫn của kim loại quý không sinh lãi suất.
Các số liệu khác công bố tuần trước cũng cho thấy dấu hiệu suy yếu trong thị trường lao động và chi tiêu tiêu dùng.
Những tín hiệu cho thấy nền kinh tế lớn nhất thế giới đang yếu đi đã củng cố kỳ vọng rằng Cục Dự trữ Liên bang (Fed) sẽ nới lỏng chính sách trong cuộc họp tháng 9, với thị trường hiện đang định giá 90% khả năng xảy ra một đợt cắt giảm lãi suất.
Chiến lược giao dịch XAUUSD xung quanh khu vực giá
SELL XAUUSD quanh vùng 3392-3394
Stoploss : 3398
Take Profit 1 : 3388
Take Profit 2: 3383
Take Profit 3: 3379
Take Profit 4: 3374
BUY XAUUSD quanh vùng 3348-3350
Stoploss : 3344
Take Profit 1 : 3355
Take Profit 2: 3360
Take Profit 3: 3365
Take Profit 4: 3370
Lưu ý : Luôn luôn cài đặt Stoploss trong mọi trường hợp để được an toàn

Phân Tích XAU/USD: H1 Hoàn Thành 5 SóngPhân Tích XAU/USD: H1 Hoàn Thành 5 Sóng – Chờ Sóng Điều Chỉnh ABC
Phiên hôm trước, mình đã gửi tới ACE nhận định rằng vàng trên khung H1 đang hoàn tất một chu kỳ 5 sóng Elliott, và thực tế giá đã phản ứng đúng như dự kiến khi chạm vùng 3,385 – 3,395. Đây chính là tín hiệu cho thấy đà tăng ngắn hạn đã yếu đi, và thị trường đang bắt đầu bước vào giai đoạn điều chỉnh kỹ thuật.
1. Phân Tích Sóng Elliott Trên Khung H1
Quan sát biểu đồ hiện tại:
Sóng (1) – (2): Pha mở đầu tăng, vàng bật mạnh sau khi hoàn thành chu kỳ giảm trước đó.
Sóng (3): Sóng tăng chủ đạo, với động lượng lớn, xác nhận phe mua kiểm soát.
Sóng (4): Nhịp điều chỉnh về vùng 3,350 – 3,355, cũng chính là key zone cho phe Buy.
Sóng (5): Hoàn tất ở vùng 3,385 – 3,395, đánh dấu sự kết thúc của nhịp tăng ngắn hạn.
Khi 5 sóng đã đầy đủ, thị trường thường bước vào nhịp ABC Correction:
Sóng A: Nhịp giảm đầu tiên, thường đưa giá về gần đáy sóng (4).
Sóng B: Nhịp hồi kỹ thuật, nhưng động lượng yếu hơn sóng tăng trước.
Sóng C: Nhịp giảm cuối cùng, phá đáy sóng A và thường chạm vùng hỗ trợ quan trọng hơn.
Ở tình huống hiện tại, vùng 3,350 vừa là đáy sóng (4) vừa là ngưỡng xác nhận CHoCH, nếu bị phá sẽ xác nhận xu hướng giảm ngắn hạn.
2. Kịch Bản Và Chiến Lược Giao Dịch
Kịch bản 1 – Điều chỉnh ngắn hạn:
Vàng nhiều khả năng sẽ hình thành sóng A giảm trước, với mục tiêu kiểm tra 3,360 – 3,350. Nếu lực bán yếu, giá có thể bật sóng B hồi kỹ thuật trước khi hình thành sóng C.
Kịch bản 2 – Xác nhận Trend Giảm:
Khi 3,350 bị phá vỡ dứt khoát, thị trường sẽ xuất hiện CHoCH, mở ra cơ hội Sell theo trend mới. Khi đó, mục tiêu giá có thể mở rộng về các vùng thấp hơn.
Chiến lược giao dịch đề xuất:
Ưu tiên Sell kỹ thuật ngắn hạn quanh 3,380 – 3,395.
Stop Loss: Trên 3,396 để bảo vệ vốn khi thị trường bất ngờ bứt phá.
Take Profit: 3,360 – 3,350, và cân nhắc chốt dần khi thị trường tiếp cận key zone.
Nếu 3,350 bị phá, có thể cân nhắc giữ lệnh Sell hoặc bổ sung vị thế theo trend mới.
3. Kết Luận Và Lưu Ý Giao Dịch
Xu hướng chính H1: Tăng đã hoàn tất 5 sóng, hiện tại bước vào pha điều chỉnh ABC.
Chiến lược hợp lý: Sell ngắn hạn theo nhịp hồi và chờ xác nhận phá 3,350 để theo trend giảm.
Quản trị vốn: Giao dịch trong vùng sideway đỉnh cần giữ rủi ro thấp, vì biến động có thể bất ngờ khi thị trường đang ở cuối chu kỳ sóng.
Nếu ACE theo đúng nhịp này, thì các lệnh Sell ngắn hoàn toàn có cơ sở kỹ thuật, nhưng mọi view Sell hiện tại đều mang tính chiến thuật, chưa phải chiến lược dài hạn.
Zép lào Trao Đổi và Tư vấn: Ko 8 4 Chín. 4 Sáu 5. 8 Hai 8

Phân tích Bob Volman khung H4 | Ít kèo | ⅝Cơ hội trên thị trường lúc này không có nhiều, dưới đây là số ít các cặp tiền có bối cảnh giao dịch được trong vài ngày tới…
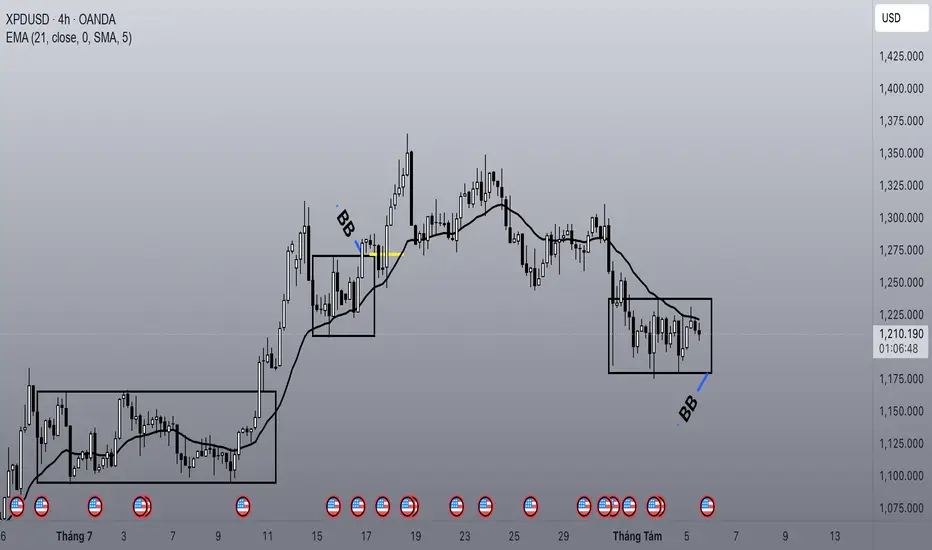
#PALLADIUM XPDUSD
Downtrend đã hình thành và giá đang tạo block nằm ngang, thuận lợi cho thiết lập BB. Chờ đoạn nén dày hơn rồi phá xuống để sell
#EURNZD
Uptrend vừa hình thành và giá đang di chuyển ngang để tạo block. Chờ đoạn nén dày hơn rồi phá vỡ để buy (BB).