PROTECTED SOURCE SCRIPT
VWAP Mean Reversion Zones
Description:
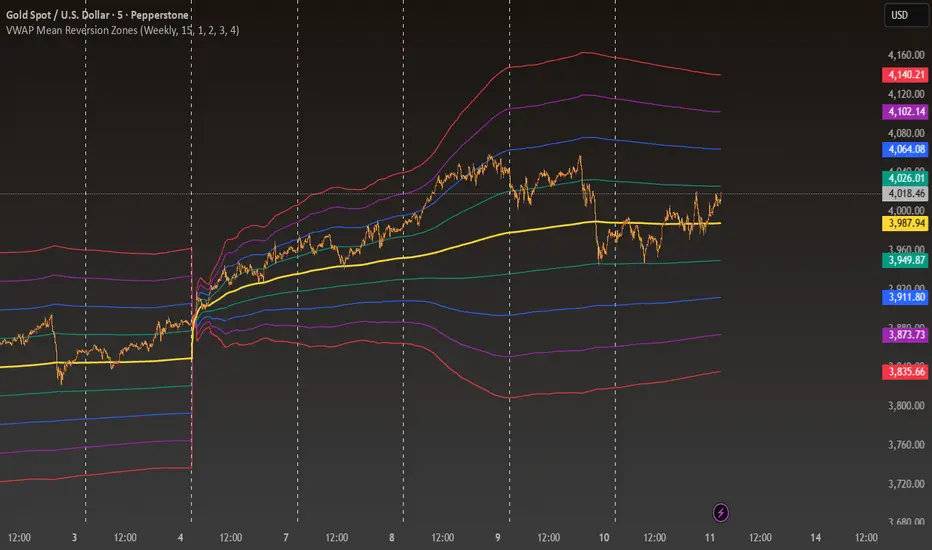
VWAP Mean Reversion Zones is a multi-timeframe VWAP indicator designed to reveal price deviations and volatility structure across higher-timeframe anchors. It calculates a Volume-Weighted Average Price (VWAP) from a user-selectable timeframe (Daily, Weekly, or Monthly) and overlays it directly on your chart.
The script also computes multiple standard deviation bands around the smoothed VWAP, allowing traders to identify areas of potential mean reversion, trend extension, and volatility compression. Each deviation band helps distinguish the relative distance of price from the VWAP centerline.
Key Features:
Selectable VWAP anchor period: Daily, Weekly, or Monthly.
Multi-timeframe VWAP calculation using volume and price weighting.
Four customizable standard deviation bands with independent multipliers.
Distinct colors and full opacity for clear visual separation.
Smoothed VWAP centerline for reduced noise and better trend visualization.
Use Cases:
Identify overbought or oversold conditions relative to VWAP.
Detect volatility expansion and contraction zones.
Align entries and exits with higher-timeframe VWAP structure.
Combine with price action or other indicators for confluence trading.
This indicator is ideal for traders who rely on VWAP dynamics and mean-reversion principles to guide entries, exits, and risk management.
Mã được bảo vệ
Tập lệnh này được đăng dưới dạng mã nguồn đóng. Tuy nhiên, bạn có thể tự do sử dụng tập lệnh mà không có bất kỳ hạn chế nào – tìm hiểu thêm tại đây.
Thông báo miễn trừ trách nhiệm
Thông tin và ấn phẩm không có nghĩa là và không cấu thành, tài chính, đầu tư, kinh doanh, hoặc các loại lời khuyên hoặc khuyến nghị khác được cung cấp hoặc xác nhận bởi TradingView. Đọc thêm trong Điều khoản sử dụng.