TRADER JUMBLO SIGNAL — Dip & Rally System
A precision-built smart trading system that detects market dips and rallies — allowing you to catch reversals right from the turning points, not halfway through the move.
🧠 How It Works (Concept Overview — no code)
The TRADER JUMBLO SIGNAL system combines trend-following and reversal-detection logic into one tool.
It analyses the last few bars (adjustable Lookback Period) to identify local extremes — the “roots” and “peaks” — and confirms entries using price structure and moving averages.
When conditions align:
-🟢 BUY Signal: Detected near the local lowest low within the lookback period during an uptrend.
-🔴 SELL Signal: Detected near the highest high during a downtrend.
-Each trade automatically sets a dynamic Stop Loss and Take Profit using the ATR (volatility-based).
-Intrabar or close-confirmed entries can be toggled for aggressive or conservative trading styles.
This system ensures you don’t chase candles — instead, it times entries at the core reversal points of the market structure.
⚙️ Key Features
-Dip & Rally Detection: Finds local highs/lows (roots and peaks) within an adjustable lookback window.
-Trend Filter: Only trades in the direction of the dominant moving-average trend.
-Intrabar Mode: Option to allow real-time entries before the candle closes.
-RSI Filter (optional): Filters out weak or overbought/oversold setups.
- ATR-based SL & TP: Automatic volatility-adjusted Stop Loss and Take Profit.
- Smart Table Display: Real-time info panel showing Entry, SL, TP, Lowest, Highest, Tolerance %, and Lookback bars.
-Customizable UI: Enable/disable labels, markers, and SL/TP lines.
Built-in Alerts:
✅ Buy (Dip) Trigger
❌ Sell (Rally) Trigger
🎯 TP Hit
🛑 SL Hit
📊 What Makes It Unique
Unlike basic crossover or RSI systems, this indicator focuses on price reaction around extremes — meaning you enter where reversals start, not after they’ve already moved.
It helps prevent:
Late entries after momentum is gone
Buying tops / selling bottoms
Random entries without market structure context
Instead, you’ll see:
Clean entries from the “roots” (local dips)
Exits or reversals from the “peaks” (local rallies)
Visual feedback for SL/TP hits — so you learn from each setup instantly.
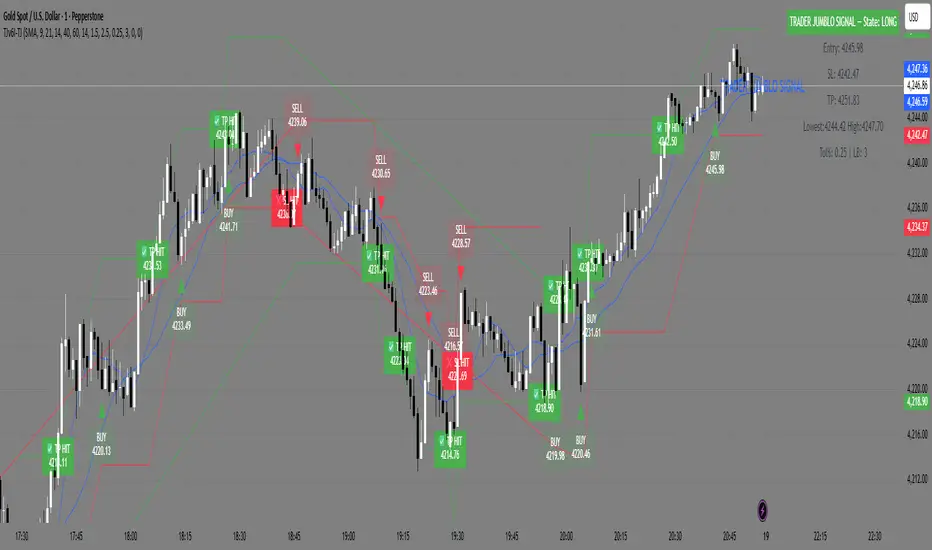
📈 Visuals
🟢 Green markers = BUY entries near local lows.
🔴 Red markers = SELL entries near local highs.
✅ “TP Hit” or ❌ “SL Hit” labels appear on price touch.
🟦 Floating table on chart shows live trade info and state (LONG / SHORT / FLAT).
Tập lệnh chỉ hiển thị cho người được mời
Chỉ những người dùng được tác giả chấp thuận mới có thể truy cập tập lệnh này. Bạn sẽ cần yêu cầu và được cấp quyền sử dụng. Thông thường quyền này được cấp sau khi thanh toán. Để biết thêm chi tiết, làm theo hướng dẫn của tác giả bên dưới hoặc liên hệ trực tiếp với TraderJumblo.
TradingView KHÔNG khuyến nghị bạn trả phí hoặc sử dụng một tập lệnh trừ khi bạn hoàn toàn tin tưởng vào tác giả và hiểu cách hoạt động của tập lệnh. Bạn cũng có thể tìm các lựa chọn miễn phí, mã nguồn mở trong các script cộng đồng của chúng tôi.
Hướng dẫn của tác giả
Thông báo miễn trừ trách nhiệm
Tập lệnh chỉ hiển thị cho người được mời
Chỉ những người dùng được tác giả chấp thuận mới có thể truy cập tập lệnh này. Bạn sẽ cần yêu cầu và được cấp quyền sử dụng. Thông thường quyền này được cấp sau khi thanh toán. Để biết thêm chi tiết, làm theo hướng dẫn của tác giả bên dưới hoặc liên hệ trực tiếp với TraderJumblo.
TradingView KHÔNG khuyến nghị bạn trả phí hoặc sử dụng một tập lệnh trừ khi bạn hoàn toàn tin tưởng vào tác giả và hiểu cách hoạt động của tập lệnh. Bạn cũng có thể tìm các lựa chọn miễn phí, mã nguồn mở trong các script cộng đồng của chúng tôi.