PROTECTED SOURCE SCRIPT
Cập nhật Dynamic Structure Overlay [AlgoXcalibur]
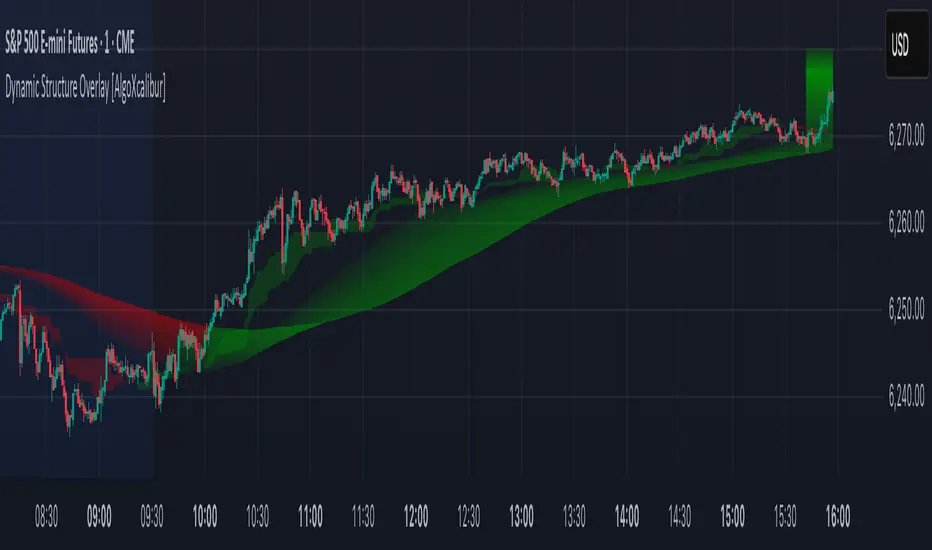
Dynamic Structure Overlay combines an ultra-dynamic Ribbon, adaptive supply/demand Zones, and a versatile momentum-based Cloud to paint a stunning picture of market structure. Whether you're riding strong trends or patiently analyzing consolidation, this tool helps visualize factors that influence trend direction and price movement.
📊 Indicator Components and Functions
This indicator integrates three core elements to provide an intuitive analysis of trend and market structure. Each component can be independently enabled or disabled to suit your preferences.
• Dynamic Ribbon
At the center of attention is the Dynamic Ribbon, which uses multi-layered moving averages rendered as a flowing ribbon with adaptive color gradients. It reacts to price action in real time, revealing trend direction, strength, and periods of expansion or compression.
• Dynamic Zones
These volume-weighted supply and demand zones are derived from price-to-volume deviations relative to VWAP. These zones often guide price action during strong trends.
• Dynamic Cloud
A unique momentum-based structure derived from dynamic price ranges by averaging the highs and lows from recent price action. The Cloud captures momentum strength and directional pressure, providing a visual guide to trend continuations and transitions.
Together, these components form a comprehensive overlay that adapts in real time to changing market conditions.
🚀 Ride the Trend
Dynamic Structure Overlay is a multi-dimensional tool — its framework helps visualize dynamic factors that often influence price action, assisting traders in staying aligned with the evolving trend.
Phát hành các Ghi chú
Update: Enhanced color brightness and transparencyMã được bảo vệ
Tập lệnh này được đăng dưới dạng mã nguồn đóng. Tuy nhiên, bạn có thể sử dụng tự do và không giới hạn – tìm hiểu thêm tại đây.
Thông báo miễn trừ trách nhiệm
Thông tin và các ấn phẩm này không nhằm mục đích, và không cấu thành, lời khuyên hoặc khuyến nghị về tài chính, đầu tư, giao dịch hay các loại khác do TradingView cung cấp hoặc xác nhận. Đọc thêm tại Điều khoản Sử dụng.
Mã được bảo vệ
Tập lệnh này được đăng dưới dạng mã nguồn đóng. Tuy nhiên, bạn có thể sử dụng tự do và không giới hạn – tìm hiểu thêm tại đây.
Thông báo miễn trừ trách nhiệm
Thông tin và các ấn phẩm này không nhằm mục đích, và không cấu thành, lời khuyên hoặc khuyến nghị về tài chính, đầu tư, giao dịch hay các loại khác do TradingView cung cấp hoặc xác nhận. Đọc thêm tại Điều khoản Sử dụng.